Fault Detection and Classification Market Analysis APAC, North America, Europe, Middle East and Africa, South America - US, China, Japan, Germany, UK - Size and Forecast 2024-2028

Fault Detection and Classification Market Analysis APAC, North America, Europe, Middle East and Africa, South America - US, China, Japan, Germany, UK - Size and Forecast 2024-2028

Published: Jan 2024 162 Pages SKU: IRTNTR77193

Market Overview at a Glance

$2.49 B
Market Opportunity
8.83%
CAGR
8.24
YoY growth 2023-2024(%)

Fault Detection and Classification Market Size 2024-2028 

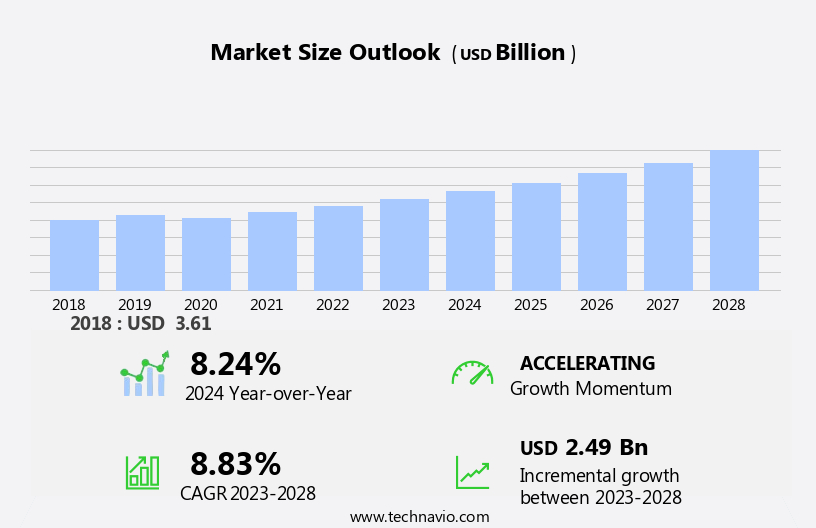
The fault detection and classification market size is forecast to increase by USD 2.49 billion at a CAGR of 8.83% between 2023 and 2028.

  • The market is experiencing significant growth due to the increasing complexity in manufacturing processes and the integration of advanced technologies, such as artificial intelligence (AI), into industrial processes. Complex system integration, particularly in the manufacturing industry, is driving the need for robust fault detection and classification systems to ensure operational efficiency and maintain high-quality production processes. Machine vision systems are increasingly being used for inspection and fault diagnosis, employing various classification algorithms to identify and respond to faults in real-time. Fortunately, advancements in computer software, automation, and data-driven technologies offer data-driven solutions for early fault detection and classification. Real-time monitoring of vehicle components and industrial systems enables manufacturers to respond to abnormalities before they escalate into costly repairs.
  • Moreover, these systems enable quality control to be performed more accurately and efficiently than with human senses alone. Throughput and response times are critical factors in the manufacturing industry, making the ability to quickly and accurately identify and classify faults essential for maintaining production and minimizing downtime. Baselines are established to monitor normal operating conditions and detect deviations, enabling proactive intervention and reducing the risk of more significant issues arising. Overall, the market for fault detection and classification solutions is poised for continued growth as industries seek to optimize their operations and improve the reliability of their complex systems.

What will be the Size of the Market During the Forecast Period?

Fault Detection and Classification Market Size

 Request Free Sample

  • The industrial sector's increasing reliance on complex systems, such as engine monitoring, cybersecurity, and equipment reliability, has led to a significant demand for advanced fault detection and classification solutions. These systems, which include brake monitoring, remote monitoring, and transmission monitoring, among others, are integral to ensuring operational efficiency, system integration, and industrial data analysis. Fault detection and classification play a crucial role in optimizing cost and improving asset management in industries, such as semiconductor manufacturing and supply chain resilience.
  • With the advent of Industry 4.0 and the Internet of Things (IoT), real-time diagnostics and predictive maintenance have become essential components of industrial operations. Error identification and anomaly detection are the foundation of fault detection and classification. Machine health monitoring and automated fault diagnosis enable proactive maintenance, reducing production downtime and increasing operational efficiency. Advanced analytics, condition monitoring, and sensor data analysis are key components of these solutions, providing data-driven decision-making capabilities. Cybersecurity is a critical aspect of fault detection and classification, ensuring the protection of complex systems from potential threats. Malfunction investigation and production line monitoring are essential for maintaining industrial data analysis and optimizing processes.
  • Additionally, the market for fault detection and classification solutions is driven by several factors. The need for system integration and operational efficiency is a significant driver, as is the increasing complexity of industrial systems and the requirement for preventive maintenance. The adoption of digital twins and smart manufacturing is also fueling growth in this market. The cost optimization benefits of fault detection and classification are substantial. By identifying and addressing issues before they escalate, organizations can save on maintenance costs and minimize production downtime. Additionally, these solutions enable predictive maintenance, allowing for more efficient use of resources and improved asset management.
  • Further, fault classification is a critical component of fault detection and classification, enabling organizations to prioritize maintenance activities and allocate resources effectively. By categorizing faults based on their severity and impact, organizations can focus on critical issues and prevent minor issues from escalating into major problems. In conclusion, the market for fault detection and classification solutions is growing rapidly, driven by the increasing complexity of industrial systems, the need for operational efficiency, and the adoption of Industry 4.0 and IoT technologies. These solutions provide significant benefits, including cost optimization, improved asset management, and enhanced cybersecurity. By investing in advanced fault detection and classification solutions, organizations can ensure the reliability and efficiency of their complex industrial systems.

How is this market segmented and which is the largest segment?

The market research report provides comprehensive data (region-wise segment analysis), with forecasts and estimates in "USD billion" for the period 2024-2028, as well as historical data from 2018-2022 for the following segments.
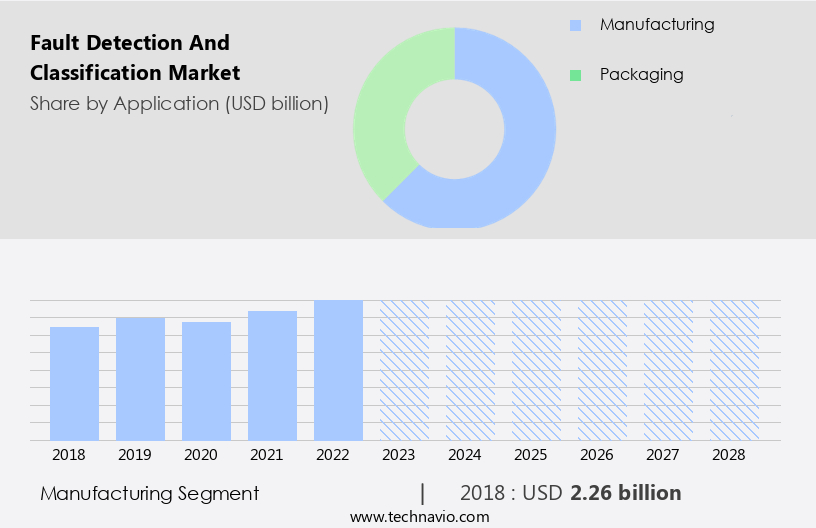
  • Application
    • Manufacturing
    • Packaging
  • Component
    • Hardware
    • Software
    • Services
  • Geography
    • APAC
      • China
      • Japan
    • North America
      • US
    • Europe
      • Germany
      • UK
    • Middle East and Africa
    • South America

By Application Insights

  • The manufacturing segment is estimated to witness significant growth during the forecast period.

In the manufacturing sector, minor glitches or production halts can significantly affect productivity and profitability. Early identification of faults through advanced detection systems is crucial to minimize downtime and maintain optimal equipment performance. Unforeseen production stoppages can lead to substantial financial losses. By implementing fault detection solutions, manufacturers can predict and prevent unexpected breakdowns, thereby reducing associated repair costs and optimizing maintenance schedules. Maintaining product quality is a top priority in the industry. Fault detection systems can identify anomalies in the production process, preventing the manufacture of defective products and preserving quality standards. Expensive machinery and equipment are essential assets in manufacturing facilities.

Fault detection technologies assist in monitoring their health, extending their operational life, and enhancing their overall performance. The integration of Industry 4.0 technologies, such as machine learning algorithms and autonomous fault detection, further streamlines the manufacturing process and improves system reliability. Manufacturing workers depend on the seamless operation of transportation systems to ensure the timely movement of goods. Fault detection solutions can identify potential issues in these systems, preventing delays and minimizing waste. Transmission line faults can cause significant disruptions in power supply, affecting both production and worker safety. Advanced fault detection systems can quickly identify and classify these anomalies, ensuring uninterrupted power supply and reducing the risk of accidents.

In conclusion, fault detection and classification solutions play a vital role in enhancing productivity, ensuring accuracy, and improving system reliability in the manufacturing sector. These technologies help monitor complex operating conditions, reduce downtime, and optimize the performance of expensive machinery and equipment. By implementing advanced fault detection systems, manufacturers can maintain product quality, minimize waste, and create a safer working environment.

Fault Detection and Classification Market Size

Get a glance at the market report of share of various segments Request Free Sample

The manufacturing segment was valued at USD 2.26 billion in 2018 and showed a gradual increase during the forecast period.

Regional Analysis

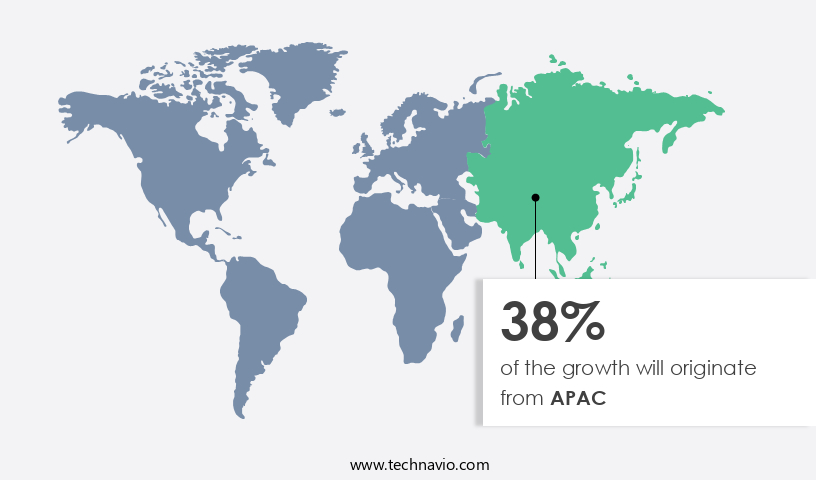
  • APAC is estimated to contribute 38% to the growth of the global market during the forecast period.

Technavio's analysts have elaborately explained the regional trends and drivers that shape the market during the forecast period.

Fault Detection and Classification Market Share by Geography

For more insights on the market share of various regions Request Free Sample

In the Asia Pacific (APAC) region, industries such as manufacturing, automotive, electronics, and energy are experiencing significant growth. With this expansion comes the increased importance of minimizing equipment downtime and addressing electrical malfunctions, engine misfires, and other disruptions in real-time. To meet these demands, APAC industries are adopting Industry 4.0 practices, including automation, IoT, and data analytics. Fault detection systems play a crucial role in this trend, allowing for data-driven maintenance and predictive analysis of vehicle components and industrial machinery. Furthermore, in a region prioritizing energy efficiency, these solutions enable the monitoring of energy consumption, optimization of processes, and identification of inefficiencies for resource conservation.

As infrastructure development continues to expand in APAC, fault detection systems become essential for maintaining the health and reliability of critical infrastructure such as power grids, transportation systems, and utilities. By implementing these solutions, industries can reduce maintenance costs, enhance vehicle performance, and ensure operational excellence.

Market Dynamics

Our researchers analyzed the data with 2023 as the base year, along with the key drivers, trends, and challenges. A holistic analysis of drivers will help companies refine their marketing strategies to gain a competitive advantage.

What are the key market drivers leading to the rise in adoption of Fault Detection and Classification Market?

Increasing complexity in the manufacturing process is the key driver of the market.

  • The intricacy of modern systems and equipment in various industries has led to heightened demand for advanced fault detection solutions. As systems become increasingly interconnected, the likelihood of electrical malfunctions, engine misfires, disruptions, and other malfunctions in vehicle components, engines, automation, and manufacturing processes increases. To mitigate these issues, industries are integrating technologies such as computer software, real-time monitoring, machine learning, and data-driven analysis. Fault detection systems enable early identification of anomalies, improving system reliability and operational efficiency. These solutions are particularly crucial in industries with high equipment downtime costs, such as manufacturing, process industries, and the automotive sector.
  • Further, fault detection devices, sensors, and machine vision systems help diagnose faults in complex systems, ensuring optimal vehicle performance and reducing maintenance costs. In the automotive segment, fault detection is essential for fuel efficiency, engine performance, and safety. Semiconductor manufacturers and automotive applications rely on application-specific integrated circuits and AI models for autonomous fault detection and deep learning models for predictive maintenance. In the energy sector, real-time monitoring of transmission line faults and power plant performance is vital for system failure prevention and productivity enhancement.
  • In conclusion, customized solutions, including integration of robotics and machine learning algorithms, are increasingly popular. These solutions enable accurate classification of faults and responses, ensuring timely maintenance and minimizing downtime. As industries continue to adopt advanced technologies, the importance of fault detection systems in maintaining system performance, product quality, and worker safety will only grow.

What are the market trends shaping the Fault Detection and Classification Market?

Integration of AI with industrial processes is the upcoming trend in the market.

  • The integration of Industry 4.0 technologies, such as IoT, AI, and machine learning, has significantly increased automation in various industries. This automation relies on the seamless functioning of machinery and processes, making fault detection systems essential. IoT sensors and devices collect copious amounts of data from industrial equipment, which is vital for fault detection systems. By analyzing patterns, trends, and abnormalities in this data, potential faults can be identified and addressed proactively. Predictive maintenance is facilitated through real-time data analysis, enabling preventive measures before equipment downtime occurs. The manufacturing, process industries, automotive, and energy sectors are among those benefiting from these advancements.
  • Also, fault detection systems enhance operational efficiency, productivity, and system reliability while reducing maintenance costs and vehicle downtime. Application-specific integrated circuits, machine learning algorithms, and robotics play a crucial role in the integration and deployment of these systems. Semiconductor manufacturers and AI models are key contributors to the development of advanced fault detection solutions. In the automotive segment, fault detection devices monitor engine misfires, electrical malfunctions, fuel system faults, and transmission issues. In the packaging sector, sensors detect anomalies in packaging lines and brakes.
  • In the manufacturing industry, machine vision systems ensure product quality and inspection, while in the energy sector, real-time monitoring of transmission line faults is crucial. Customized solutions cater to specific industry needs, ensuring scalability and integration with existing systems. The deployment of these systems is expected to continue, as the importance of early fault detection and classification becomes increasingly apparent.

What challenges does Fault Detection and Classification Market face during the growth?

Complex system integration is a key challenge affecting market growth.

  • The market encompasses various industries, including manufacturing, automotive, and energy, where minimizing equipment downtime and ensuring system reliability are paramount. Electrical malfunctions in engines, engine misfires, and disruptions in vehicle components can significantly impact vehicle performance and incur substantial maintenance costs. Real-time monitoring of these malfunctions using computer software, automation, and fault-detection devices is essential for early detection and classification. In the manufacturing industry, fault detection is crucial for maintaining operational efficiency, productivity, and product quality. Machine learning algorithms, AI models, and deep learning models are increasingly being used for fault detection and classification in complex systems.
  • Also, application-specific integrated circuits and sensor data play a vital role in detecting anomalies and system failures. In the automotive segment, fault detection is essential for maintaining fuel efficiency, ensuring safety, and minimizing vehicle downtime. Semiconductor manufacturers are developing customized solutions for automotive applications, including fault detection systems for transmissions, fuel systems, and brakes. The integration of fault detection systems into existing infrastructure can be complex, requiring expertise in data science, machine learning, and domain-specific knowledge. Bridging the gap between these disciplines within a team or finding individuals with a multidisciplinary skill set can be challenging. However, the benefits of early fault detection and classification, including reduced downtime, improved system performance, and increased productivity, make it a worthwhile investment for businesses across various industries.
  • In the packaging sector, fault detection is critical for maintaining throughput and ensuring product quality. Machine vision systems and inspection technologies are used to detect defects and anomalies in packaging materials and products. The deployment times for these systems can be significant, and the response to faults must be quick to minimize waste and maintain production processes. In the energy sector, fault detection is essential for maintaining the reliability of power plants and transmission lines. Sensor data and AI models are used to detect anomalies and respond to fault scenarios in real-time. Government measures and regulations are driving the adoption of fault detection systems in this sector to ensure system reliability and prevent costly system failures.
  • Overall, The market is expected to grow significantly during the forecast period due to the increasing demand for early fault detection and classification in various industries. The integration of fault detection systems into existing infrastructure and the development of accurate and customized solutions will continue to be key challenges for market growth.

Exclusive Customer Landscape

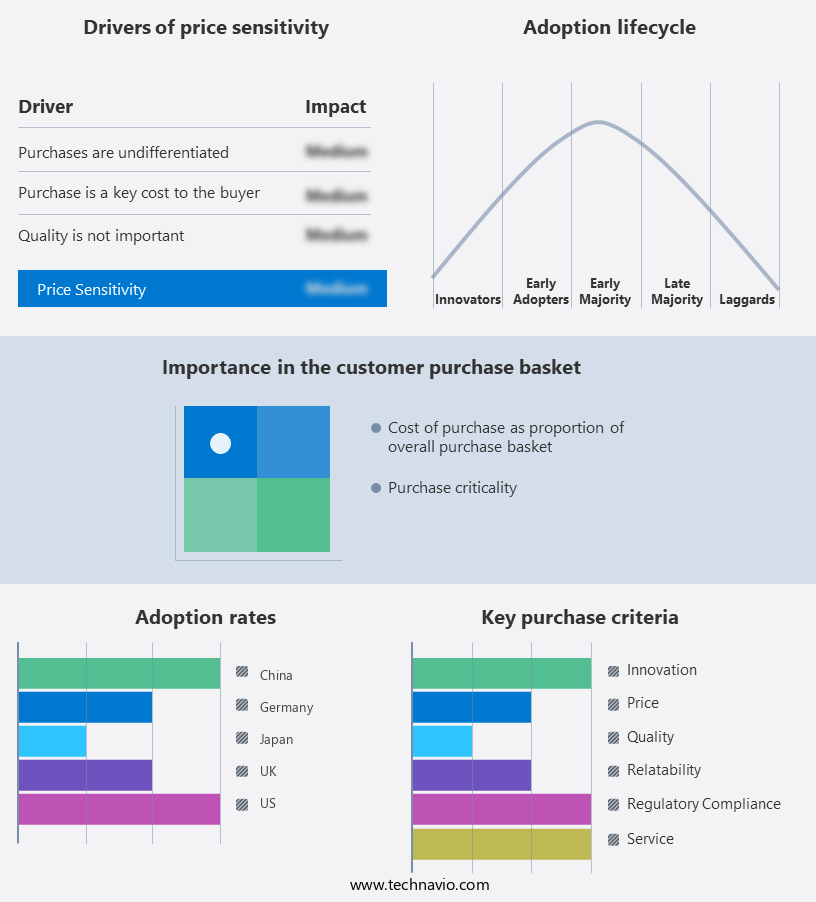
The market forecasting report includes the adoption lifecycle of the market, covering from the innovator's stage to the laggard's stage. It focuses on adoption rates in different regions based on penetration. Furthermore, the market report also includes key purchase criteria and drivers of price sensitivity to help companies evaluate and develop their market growth analysis strategies.

Fault Detection and Classification Market Share by Geography

 Customer Landscape

Key Companies & Market Insights

Companies are implementing various strategies, such as strategic alliances, market forecast, partnerships, mergers and acquisitions, geographical expansion, and product/service launches, to enhance their presence in the market.

The market research and growth report includes detailed analyses of the competitive landscape of the market and information about key companies, including:

  • ABB Ltd.
  • Amazon.com Inc.
  • Applied Materials Inc.
  • Clockworks Analytics
  • Cognex Corp.
  • DNV Group AS
  • einnoSys Technologies Inc.
  • elunic AG
  • INFICON Holding AG
  • Keyence Corp.
  • KLA Corp.
  • Microsoft Corp.
  • OMRON Corp.
  • Siemens AG
  • Synopsys Inc.

Qualitative and quantitative analysis of companies has been conducted to help clients understand the wider business environment as well as the strengths and weaknesses of key market players. Data is qualitatively analyzed to categorize companies as pure play, category-focused, industry-focused, and diversified; it is quantitatively analyzed to categorize companies as dominant, leading, strong, tentative, and weak.

Research Analyst Overview

In today's industrial and transportation sectors, fault detection and classification are crucial for minimizing equipment downtime and maintaining optimal vehicle performance. Electrical malfunctions, engine misfires, and other disruptions can lead to significant losses in income levels, especially in process industries like manufacturing and automotive segments. Application-specific integrated circuits and machine learning algorithms play a vital role in fault detection and classification.

In summary, these technologies enable the identification of complex fault scenarios and the development of customized solutions for various industries, including packaging, energy, and transportation. Fault detection devices, such as sensors and machine vision systems, provide valuable data for classification algorithms. These algorithms analyze sensor data and compare it to baselines to identify anomalies and classify faults. The manufacturing industry benefits significantly from autonomous fault detection and classification, improving system reliability and operational efficiency. Skilled professionals can leverage AI models like AutoML and deep learning models to diagnose process issues and optimize production processes. The integration of robotics and machine learning further enhances the capabilities of fault detection and classification systems, enabling faster deployment times and increased scalability. As the importance of fault detection and classification continues to grow, it's essential to stay informed about the latest trends and government measures in this field.

Market Scope

Report Coverage

Details

Page number

162

Base year

2023

Historic period

2018-2022

Forecast period

2024-2028

Growth momentum & CAGR

Accelerate at a CAGR of 8.83%

Market growth 2024-2028

USD 2.49 billion

Market structure

Fragmented

YoY growth 2023-2024(%)

8.24

Key countries

US, China, Japan, Germany, and UK

Competitive landscape

Leading Companies, Market Positioning of Companies, Competitive Strategies, and Industry Risks

Request Free Sample

What are the Key Data Covered in this Market Research and Growth Report?

  • CAGR of the market during the forecast period
  • Detailed information on factors that will drive the market growth and forecasting between 2024 and 2028
  • Precise estimation of the size of the market  and its contribution of the market in focus to the parent market
  • Accurate predictions about upcoming market growth and trends and changes in consumer behaviour
  • Growth of the market across APAC, North America, Europe, Middle East and Africa, and South America
  • Thorough analysis of the market's competitive landscape and detailed information about companies
  • Comprehensive analysis of factors that will challenge the growth of market companies

We can help! Our analysts can customize this market research report to meet your requirements. Get in touch

1 Executive Summary

  • 1.1 Market overview
    • Exhibit 01: Executive Summary – Chart on Market Overview
    • Exhibit 02: Executive Summary – Data Table on Market Overview
    • Exhibit 03: Executive Summary – Chart on Global Market Characteristics
    • Exhibit 04: Executive Summary – Chart on Market by Geography
    • Exhibit 05: Executive Summary – Chart on Market Segmentation by Application
    • Exhibit 06: Executive Summary – Chart on Market Segmentation by Component
    • Exhibit 07: Executive Summary – Chart on Incremental Growth
    • Exhibit 08: Executive Summary – Data Table on Incremental Growth
    • Exhibit 09: Executive Summary – Chart on Vendor Market Positioning

2 Market Landscape

  • 2.1 Market ecosystem
    • Exhibit 10: Parent market
    • Exhibit 11: Market Characteristics

3 Market Sizing

  • 3.1 Market definition
    • Exhibit 12: Offerings of vendors included in the market definition
  • 3.2 Market segment analysis
    • Exhibit 13: Market segments
  • 3.3 Market size 2023
    • 3.4 Market outlook: Forecast for 2023-2028
      • Exhibit 14: Chart on Global - Market size and forecast 2023-2028 ($ billion)
      • Exhibit 15: Data Table on Global - Market size and forecast 2023-2028 ($ billion)
      • Exhibit 16: Chart on Global Market: Year-over-year growth 2023-2028 (%)
      • Exhibit 17: Data Table on Global Market: Year-over-year growth 2023-2028 (%)

    4 Historic Market Size

    • 4.1 Global fault detection and classification market 2018 - 2022
      • Exhibit 18: Historic Market Size – Data Table on global fault detection and classification market 2018 - 2022 ($ billion)
    • 4.2 Application Segment Analysis 2018 - 2022
      • Exhibit 19: Historic Market Size – Application Segment 2018 - 2022 ($ billion)
    • 4.3 Component Segment Analysis 2018 - 2022
      • Exhibit 20: Historic Market Size – Component Segment 2018 - 2022 ($ billion)
    • 4.4 Geography Segment Analysis 2018 - 2022
      • Exhibit 21: Historic Market Size – Geography Segment 2018 - 2022 ($ billion)
    • 4.5 Country Segment Analysis 2018 - 2022
      • Exhibit 22: Historic Market Size – Country Segment 2018 - 2022 ($ billion)

    5 Five Forces Analysis

    • 5.1 Five forces summary
      • Exhibit 23: Five forces analysis - Comparison between 2023 and 2028
    • 5.2 Bargaining power of buyers
      • Exhibit 24: Chart on Bargaining power of buyers – Impact of key factors 2023 and 2028
    • 5.3 Bargaining power of suppliers
      • Exhibit 25: Bargaining power of suppliers – Impact of key factors in 2023 and 2028
    • 5.4 Threat of new entrants
      • Exhibit 26: Threat of new entrants – Impact of key factors in 2023 and 2028
    • 5.5 Threat of substitutes
      • Exhibit 27: Threat of substitutes – Impact of key factors in 2023 and 2028
    • 5.6 Threat of rivalry
      • Exhibit 28: Threat of rivalry – Impact of key factors in 2023 and 2028
    • 5.7 Market condition
      • Exhibit 29: Chart on Market condition - Five forces 2023 and 2028

    6 Market Segmentation by Application

    • 6.1 Market segments
      • Exhibit 30: Chart on Application - Market share 2023-2028 (%)
      • Exhibit 31: Data Table on Application - Market share 2023-2028 (%)
    • 6.2 Comparison by Application
      • Exhibit 32: Chart on Comparison by Application
      • Exhibit 33: Data Table on Comparison by Application
    • 6.3 Manufacturing - Market size and forecast 2023-2028
      • Exhibit 34: Chart on Manufacturing - Market size and forecast 2023-2028 ($ billion)
      • Exhibit 35: Data Table on Manufacturing - Market size and forecast 2023-2028 ($ billion)
      • Exhibit 36: Chart on Manufacturing - Year-over-year growth 2023-2028 (%)
      • Exhibit 37: Data Table on Manufacturing - Year-over-year growth 2023-2028 (%)
    • 6.4 Packaging - Market size and forecast 2023-2028
      • Exhibit 38: Chart on Packaging - Market size and forecast 2023-2028 ($ billion)
      • Exhibit 39: Data Table on Packaging - Market size and forecast 2023-2028 ($ billion)
      • Exhibit 40: Chart on Packaging - Year-over-year growth 2023-2028 (%)
      • Exhibit 41: Data Table on Packaging - Year-over-year growth 2023-2028 (%)
    • 6.5 Market opportunity by Application
      • Exhibit 42: Market opportunity by Application ($ billion)
      • Exhibit 43: Data Table on Market opportunity by Application ($ billion)

    7 Market Segmentation by Component

    • 7.1 Market segments
      • Exhibit 44: Chart on Component - Market share 2023-2028 (%)
      • Exhibit 45: Data Table on Component - Market share 2023-2028 (%)
    • 7.2 Comparison by Component
      • Exhibit 46: Chart on Comparison by Component
      • Exhibit 47: Data Table on Comparison by Component
    • 7.3 Hardware - Market size and forecast 2023-2028
      • Exhibit 48: Chart on Hardware - Market size and forecast 2023-2028 ($ billion)
      • Exhibit 49: Data Table on Hardware - Market size and forecast 2023-2028 ($ billion)
      • Exhibit 50: Chart on Hardware - Year-over-year growth 2023-2028 (%)
      • Exhibit 51: Data Table on Hardware - Year-over-year growth 2023-2028 (%)
    • 7.4 Software - Market size and forecast 2023-2028
      • Exhibit 52: Chart on Software - Market size and forecast 2023-2028 ($ billion)
      • Exhibit 53: Data Table on Software - Market size and forecast 2023-2028 ($ billion)
      • Exhibit 54: Chart on Software - Year-over-year growth 2023-2028 (%)
      • Exhibit 55: Data Table on Software - Year-over-year growth 2023-2028 (%)
    • 7.5 Services - Market size and forecast 2023-2028
      • Exhibit 56: Chart on Services - Market size and forecast 2023-2028 ($ billion)
      • Exhibit 57: Data Table on Services - Market size and forecast 2023-2028 ($ billion)
      • Exhibit 58: Chart on Services - Year-over-year growth 2023-2028 (%)
      • Exhibit 59: Data Table on Services - Year-over-year growth 2023-2028 (%)
    • 7.6 Market opportunity by Component
      • Exhibit 60: Market opportunity by Component ($ billion)
      • Exhibit 61: Data Table on Market opportunity by Component ($ billion)

    8 Customer Landscape

    • 8.1 Customer landscape overview
      • Exhibit 62: Analysis of price sensitivity, lifecycle, customer purchase basket, adoption rates, and purchase criteria

    9 Geographic Landscape

    • 9.1 Geographic segmentation
      • Exhibit 63: Chart on Market share by geography 2023-2028 (%)
      • Exhibit 64: Data Table on Market share by geography 2023-2028 (%)
    • 9.2 Geographic comparison
      • Exhibit 65: Chart on Geographic comparison
      • Exhibit 66: Data Table on Geographic comparison
    • 9.3 APAC - Market size and forecast 2023-2028
      • Exhibit 67: Chart on APAC - Market size and forecast 2023-2028 ($ billion)
      • Exhibit 68: Data Table on APAC - Market size and forecast 2023-2028 ($ billion)
      • Exhibit 69: Chart on APAC - Year-over-year growth 2023-2028 (%)
      • Exhibit 70: Data Table on APAC - Year-over-year growth 2023-2028 (%)
    • 9.4 North America - Market size and forecast 2023-2028
      • Exhibit 71: Chart on North America - Market size and forecast 2023-2028 ($ billion)
      • Exhibit 72: Data Table on North America - Market size and forecast 2023-2028 ($ billion)
      • Exhibit 73: Chart on North America - Year-over-year growth 2023-2028 (%)
      • Exhibit 74: Data Table on North America - Year-over-year growth 2023-2028 (%)
    • 9.5 Europe - Market size and forecast 2023-2028
      • Exhibit 75: Chart on Europe - Market size and forecast 2023-2028 ($ billion)
      • Exhibit 76: Data Table on Europe - Market size and forecast 2023-2028 ($ billion)
      • Exhibit 77: Chart on Europe - Year-over-year growth 2023-2028 (%)
      • Exhibit 78: Data Table on Europe - Year-over-year growth 2023-2028 (%)
    • 9.6 Middle East and Africa - Market size and forecast 2023-2028
      • Exhibit 79: Chart on Middle East and Africa - Market size and forecast 2023-2028 ($ billion)
      • Exhibit 80: Data Table on Middle East and Africa - Market size and forecast 2023-2028 ($ billion)
      • Exhibit 81: Chart on Middle East and Africa - Year-over-year growth 2023-2028 (%)
      • Exhibit 82: Data Table on Middle East and Africa - Year-over-year growth 2023-2028 (%)
    • 9.7 South America - Market size and forecast 2023-2028
      • Exhibit 83: Chart on South America - Market size and forecast 2023-2028 ($ billion)
      • Exhibit 84: Data Table on South America - Market size and forecast 2023-2028 ($ billion)
      • Exhibit 85: Chart on South America - Year-over-year growth 2023-2028 (%)
      • Exhibit 86: Data Table on South America - Year-over-year growth 2023-2028 (%)
    • 9.8 US - Market size and forecast 2023-2028
      • Exhibit 87: Chart on US - Market size and forecast 2023-2028 ($ billion)
      • Exhibit 88: Data Table on US - Market size and forecast 2023-2028 ($ billion)
      • Exhibit 89: Chart on US - Year-over-year growth 2023-2028 (%)
      • Exhibit 90: Data Table on US - Year-over-year growth 2023-2028 (%)
    • 9.9 China - Market size and forecast 2023-2028
      • Exhibit 91: Chart on China - Market size and forecast 2023-2028 ($ billion)
      • Exhibit 92: Data Table on China - Market size and forecast 2023-2028 ($ billion)
      • Exhibit 93: Chart on China - Year-over-year growth 2023-2028 (%)
      • Exhibit 94: Data Table on China - Year-over-year growth 2023-2028 (%)
    • 9.10 Japan - Market size and forecast 2023-2028
      • Exhibit 95: Chart on Japan - Market size and forecast 2023-2028 ($ billion)
      • Exhibit 96: Data Table on Japan - Market size and forecast 2023-2028 ($ billion)
      • Exhibit 97: Chart on Japan - Year-over-year growth 2023-2028 (%)
      • Exhibit 98: Data Table on Japan - Year-over-year growth 2023-2028 (%)
    • 9.11 Germany - Market size and forecast 2023-2028
      • Exhibit 99: Chart on Germany - Market size and forecast 2023-2028 ($ billion)
      • Exhibit 100: Data Table on Germany - Market size and forecast 2023-2028 ($ billion)
      • Exhibit 101: Chart on Germany - Year-over-year growth 2023-2028 (%)
      • Exhibit 102: Data Table on Germany - Year-over-year growth 2023-2028 (%)
    • 9.12 UK - Market size and forecast 2023-2028
      • Exhibit 103: Chart on UK - Market size and forecast 2023-2028 ($ billion)
      • Exhibit 104: Data Table on UK - Market size and forecast 2023-2028 ($ billion)
      • Exhibit 105: Chart on UK - Year-over-year growth 2023-2028 (%)
      • Exhibit 106: Data Table on UK - Year-over-year growth 2023-2028 (%)
    • 9.13 Market opportunity by geography
      • Exhibit 107: Market opportunity by geography ($ billion)
      • Exhibit 108: Data Tables on Market opportunity by geography ($ billion)

    10 Drivers, Challenges, and Trends

    • 10.1 Market drivers
      • 10.2 Market challenges
        • 10.3 Impact of drivers and challenges
          • Exhibit 109: Impact of drivers and challenges in 2023 and 2028
        • 10.4 Market trends

          11 Vendor Landscape

          • 11.1 Overview
            • 11.2 Vendor landscape
              • Exhibit 110: Overview on Criticality of inputs and Factors of differentiation
            • 11.3 Landscape disruption
              • Exhibit 111: Overview on factors of disruption
            • 11.4 Industry risks
              • Exhibit 112: Impact of key risks on business

            12 Vendor Analysis

            • 12.1 Vendors covered
              • Exhibit 113: Vendors covered
            • 12.2 Market positioning of vendors
              • Exhibit 114: Matrix on vendor position and classification
            • 12.3 ABB Ltd.
              • Exhibit 115: ABB Ltd. - Overview
              • Exhibit 116: ABB Ltd. - Business segments
              • Exhibit 117: ABB Ltd. - Key offerings
              • Exhibit 118: ABB Ltd. - Segment focus
            • 12.4 Amazon.com Inc.
              • Exhibit 119: Amazon.com Inc. - Overview
              • Exhibit 120: Amazon.com Inc. - Business segments
              • Exhibit 121: Amazon.com Inc. - Key news
              • Exhibit 122: Amazon.com Inc. - Key offerings
              • Exhibit 123: Amazon.com Inc. - Segment focus
            • 12.5 Applied Materials Inc.
              • Exhibit 124: Applied Materials Inc. - Overview
              • Exhibit 125: Applied Materials Inc. - Business segments
              • Exhibit 126: Applied Materials Inc. - Key offerings
              • Exhibit 127: Applied Materials Inc. - Segment focus
            • 12.6 Clockworks Analytics
              • Exhibit 128: Clockworks Analytics - Overview
              • Exhibit 129: Clockworks Analytics - Product / Service
              • Exhibit 130: Clockworks Analytics - Key offerings
            • 12.7 Cognex Corp.
              • Exhibit 131: Cognex Corp. - Overview
              • Exhibit 132: Cognex Corp. - Product / Service
              • Exhibit 133: Cognex Corp. - Key offerings
            • 12.8 DNV Group AS
              • Exhibit 134: DNV Group AS - Overview
              • Exhibit 135: DNV Group AS - Business segments
              • Exhibit 136: DNV Group AS - Key news
              • Exhibit 137: DNV Group AS - Key offerings
              • Exhibit 138: DNV Group AS - Segment focus
            • 12.9 einnoSys Technologies Inc.
              • Exhibit 139: einnoSys Technologies Inc. - Overview
              • Exhibit 140: einnoSys Technologies Inc. - Product / Service
              • Exhibit 141: einnoSys Technologies Inc. - Key offerings
            • 12.10 elunic AG
              • Exhibit 142: elunic AG - Overview
              • Exhibit 143: elunic AG - Product / Service
              • Exhibit 144: elunic AG - Key offerings
            • 12.11 INFICON Holding AG
              • Exhibit 145: INFICON Holding AG - Overview
              • Exhibit 146: INFICON Holding AG - Product / Service
              • Exhibit 147: INFICON Holding AG - Key offerings
            • 12.12 Keyence Corp.
              • Exhibit 148: Keyence Corp. - Overview
              • Exhibit 149: Keyence Corp. - Product / Service
              • Exhibit 150: Keyence Corp. - Key offerings
            • 12.13 KLA Corp.
              • Exhibit 151: KLA Corp. - Overview
              • Exhibit 152: KLA Corp. - Business segments
              • Exhibit 153: KLA Corp. - Key offerings
              • Exhibit 154: KLA Corp. - Segment focus
            • 12.14 Microsoft Corp.
              • Exhibit 155: Microsoft Corp. - Overview
              • Exhibit 156: Microsoft Corp. - Business segments
              • Exhibit 157: Microsoft Corp. - Key news
              • Exhibit 158: Microsoft Corp. - Key offerings
              • Exhibit 159: Microsoft Corp. - Segment focus
            • 12.15 OMRON Corp.
              • Exhibit 160: OMRON Corp. - Overview
              • Exhibit 161: OMRON Corp. - Business segments
              • Exhibit 162: OMRON Corp. - Key news
              • Exhibit 163: OMRON Corp. - Key offerings
              • Exhibit 164: OMRON Corp. - Segment focus
            • 12.16 Siemens AG
              • Exhibit 165: Siemens AG - Overview
              • Exhibit 166: Siemens AG - Business segments
              • Exhibit 167: Siemens AG - Key news
              • Exhibit 168: Siemens AG - Key offerings
              • Exhibit 169: Siemens AG - Segment focus
            • 12.17 Synopsys Inc.
              • Exhibit 170: Synopsys Inc. - Overview
              • Exhibit 171: Synopsys Inc. - Business segments
              • Exhibit 172: Synopsys Inc. - Key offerings
              • Exhibit 173: Synopsys Inc. - Segment focus

            13 Appendix

            • 13.1 Scope of the report
              • 13.2 Inclusions and exclusions checklist
                • Exhibit 174: Inclusions checklist
                • Exhibit 175: Exclusions checklist
              • 13.3 Currency conversion rates for US$
                • Exhibit 176: Currency conversion rates for US$
              • 13.4 Research methodology
                • Exhibit 177: Research methodology
                • Exhibit 178: Validation techniques employed for market sizing
                • Exhibit 179: Information sources
              • 13.5 List of abbreviations
                • Exhibit 180: List of abbreviations

              Research Methodology

              Technavio presents a detailed picture of the market by way of study, synthesis, and summation of data from multiple sources. The analysts have presented the various facets of the market with a particular focus on identifying the key industry influencers. The data thus presented is comprehensive, reliable, and the result of extensive research, both primary and secondary.

              INFORMATION SOURCES

              Primary sources

              • Manufacturers and suppliers
              • Channel partners
              • Industry experts
              • Strategic decision makers

              Secondary sources

              • Industry journals and periodicals
              • Government data
              • Financial reports of key industry players
              • Historical data
              • Press releases

              DATA ANALYSIS

              Data Synthesis

              • Collation of data
              • Estimation of key figures
              • Analysis of derived insights

              Data Validation

              • Triangulation with data models
              • Reference against proprietary databases
              • Corroboration with industry experts

              REPORT WRITING

              Qualitative

              • Market drivers
              • Market challenges
              • Market trends
              • Five forces analysis

              Quantitative

              • Market size and forecast
              • Market segmentation
              • Geographical insights
              • Competitive landscape

              Interested in this report?

              Get your sample now to see our research methodology and insights!

              Download Now

              Frequently Asked Questions

              Fault Detection and Classification market growth will increase by $ 2.49 bn during 2024-2028 .

              The Fault Detection and Classification market is expected to grow at a CAGR of 8.83% during 2024-2028 .

              Fault Detection and Classification market is segmented by Application( Manufacturing, Packaging) Component( Hardware, Software, Services)

              ABB Ltd., Amazon.com Inc., Applied Materials Inc., Clockworks Analytics, Cognex Corp., DNV Group AS, einnoSys Technologies Inc., elunic AG, INFICON Holding AG, Keyence Corp., KLA Corp., Microsoft Corp., OMRON Corp., Siemens AG, Synopsys Inc. are a few of the key vendors in the Fault Detection and Classification market.

              APAC will register the highest growth rate of 38% among the other regions. Therefore, the Fault Detection and Classification market in APAC is expected to garner significant business opportunities for the vendors during the forecast period.

              US, China, Japan, Germany, UK

              • Increasing complexity in manufacturing processThe increasing complexity of systems across various industries indeed plays a significant role in boosting the demand for robust fault detection solutions. Modern industries rely on interconnected systems where numerous components work together. As these systems become more intricate is the driving factor this market.
              • the likelihood of faults increases. Fault detection systems become crucial in monitoring and identifying issues within this interconnected network. Industries are integrating diverse technologies like IoT is the driving factor this market.
              • AI is the driving factor this market.
              • cloud computing is the driving factor this market.
              • and big data analytics. While these advancements enhance efficiency is the driving factor this market.
              • they also introduce complexities in system operations. Fault detection systems help manage and ensure the seamless functioning of these integrated technologies. Complex machinery and specialized equipment are becoming more prevalent. These systems often have unique failure modes or intricate operational patterns that require sophisticated fault detection methods for accurate monitoring and maintenance. The evolving complexity in industrial systems creates a demand for advanced fault detection solutions capable of handling diverse and intricate operational scenarios. As a result is the driving factor this market.
              • the fault detection market continues to grow to meet these increasing demands is the driving factor this market.
              • which is expected to boost the growth of the global fault detection and classification market during the forecast period. is the driving factor this market.

              The Fault Detection and Classification market vendors should focus on grabbing business opportunities from the Manufacturing segment as it accounted for the largest market share in the base year.