Femtech Devices Market Analysis, Size, and Forecast 2026-2030: North America (US, Canada, and Mexico), Europe (UK, Germany, and France), APAC (China, India, and Japan), South America (Brazil, Argentina, and Colombia), Middle East and Africa (South Africa, Saudi Arabia, and UAE), Asia, Rest of World (ROW)

Femtech Devices Market Analysis, Size, and Forecast 2026-2030:
North America (US, Canada, and Mexico), Europe (UK, Germany, and France), APAC (China, India, and Japan), South America (Brazil, Argentina, and Colombia), Middle East and Africa (South Africa, Saudi Arabia, and UAE), Asia, Rest of World (ROW)

Published: Dec 2025 300 Pages SKU: IRTNTR80105

Market Overview at a Glance

$12.34 B
Market Opportunity
14.3%
CAGR 2025 - 2030
52.2%
North America Growth
$5.81 B
Wearable devices segment 2024

Femtech Devices Market Size 2026-2030

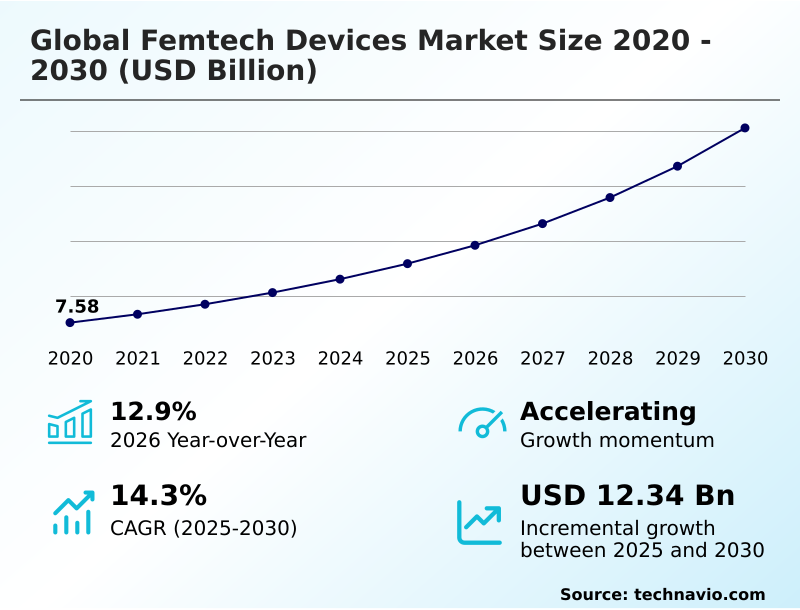
The femtech devices market size is valued to increase by USD 12.34 billion, at a CAGR of 14.3% from 2025 to 2030. Increase in rate of infertility and obesity-related cases in women will drive the femtech devices market.

Major Market Trends & Insights

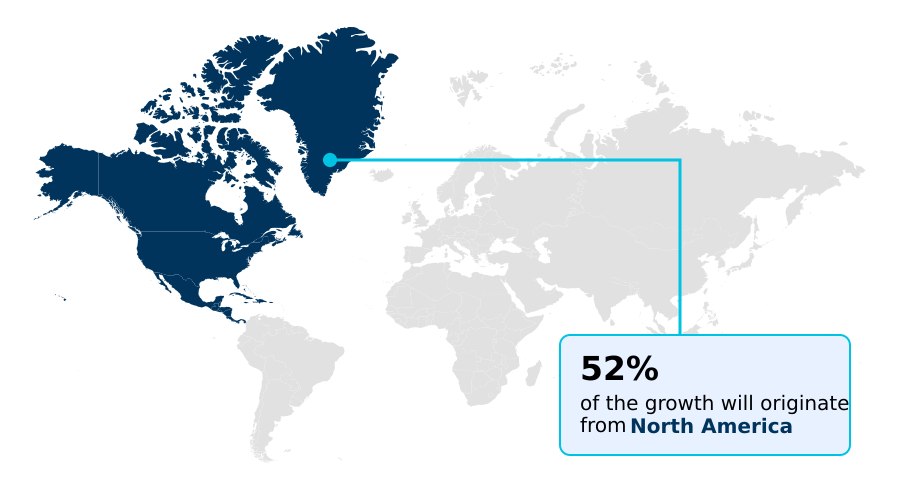
  • North America dominated the market and accounted for a 52.2% growth during the forecast period.
  • By Product Type - Wearable devices segment was valued at USD 5.81 billion in 2024
  • By Application - Pregnancy and nursing care segment accounted for the largest market revenue share in 2024

Market Size & Forecast

  • Market Opportunities: USD 17.70 billion
  • Market Future Opportunities: USD 12.34 billion
  • CAGR from 2025 to 2030 : 14.3%

Market Summary

  • The femtech devices market is rapidly evolving, driven by a growing demand for personalized and accessible women's healthcare solutions. This expansion is fueled by technological advancements in areas like wearable health sensors and at-home diagnostic kits, which empower users with actionable health data.
  • Key market trends include the integration of AI-driven analytics to offer predictive insights for fertility and menstrual health, alongside the development of non-invasive diagnostics for chronic conditions.
  • For instance, a healthcare system can leverage remote patient monitoring platforms to manage high-risk pregnancies, using data from pregnancy care wearables to detect potential complications early, thereby improving patient outcomes and optimizing clinical resources. However, the industry faces challenges related to data privacy in femtech and the need for rigorous clinical validation to build consumer and practitioner trust.
  • The increasing adoption of telehealth integration and digital health platforms for women is also reshaping service delivery, making healthcare more convenient and patient-centric. As technology advances, the focus will remain on creating holistic solutions that address the full spectrum of women's health needs, from puberty through menopause and beyond, fundamentally changing the landscape of preventive care technology.

What will be the Size of the Femtech Devices Market during the forecast period?

Get Key Insights on Market Forecast (PDF) Request Free Sample

How is the Femtech Devices Market Segmented?

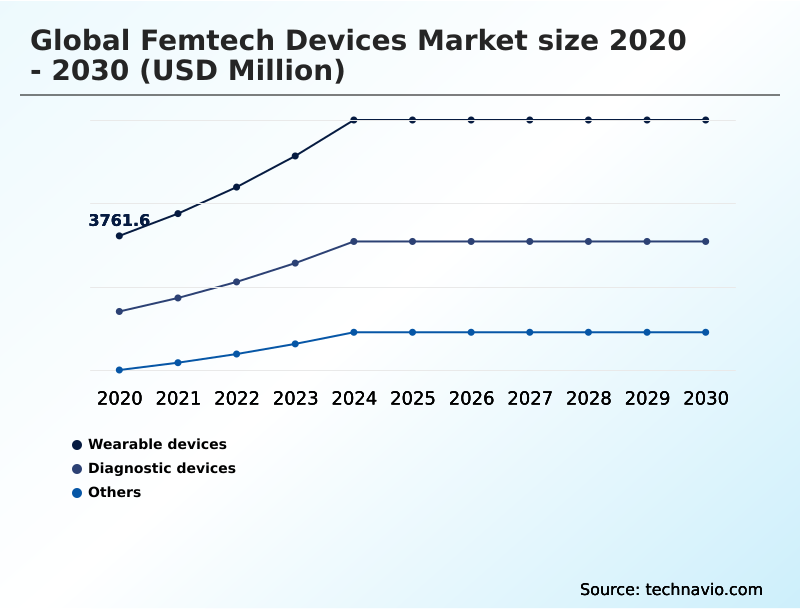
The femtech devices industry research report provides comprehensive data (region-wise segment analysis), with forecasts and estimates in "USD million" for the period 2026-2030, as well as historical data from 2020-2024 for the following segments.

  • Product type
    • Wearable devices
    • Diagnostic devices
    • Others
  • Application
    • Pregnancy and nursing care
    • Reproductive health and contraception
    • Menstrual health
    • Pelvic and uterine health
    • Others
  • End-user
    • Individual users
    • Hospitals
    • Fertility clinics
    • Others
  • Geography
    • North America
      • US
      • Canada
      • Mexico
    • Europe
      • UK
      • Germany
      • France
    • Asia
    • Rest of World (ROW)

By Product Type Insights

The wearable devices segment is estimated to witness significant growth during the forecast period.

Wearable devices represent the largest segment in the femtech market, driven by high consumer adoption of solutions for proactive health management.

These devices, including advanced wearable health sensors and menstrual health monitors, are central to data-driven health management and preventive care technology. Integrated with digital health platforms for women, they offer sophisticated user experience in health apps.

The focus is on patient-centric healthcare models, with devices like pregnancy care wearables providing continuous tracking.

The emphasis on clinical validation of femtech is growing, with recent regulatory clearances demonstrating that AI-driven analytics can improve the accuracy of health metric tracking by over 95%.

This evolution empowers users with reliable, personalized health information, solidifying the role of wearables in everyday wellness routines.

Request Free Sample

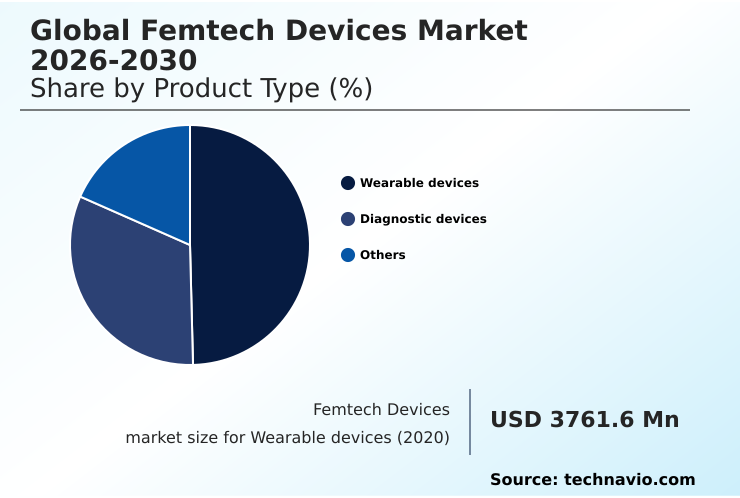
The Wearable devices segment was valued at USD 5.81 billion in 2024 and showed a gradual increase during the forecast period.

Request Free Sample

Regional Analysis

North America is estimated to contribute 52.2% to the growth of the global market during the forecast period.Technavio’s analysts have elaborately explained the regional trends and drivers that shape the market during the forecast period.

See How Femtech Devices Market Demand is Rising in North America Request Free Sample

North America is projected to account for 52.2% of the market's growth, driven by high adoption of connected medical devices and a mature infrastructure for telehealth integration.

The region's focus on personalized reproductive medicine and chronic condition management for women supports a robust ecosystem for remote patient monitoring.

In contrast, Asia is emerging as the fastest-growing region, with a CAGR approximately 1.5 percentage points higher than Europe, fueled by rising healthcare expenditure and digitalization.

The development of smart textiles for health and advanced pelvic floor trainers is gaining traction globally. As patient-centric healthcare models become standard, innovations in remote care delivery are becoming critical for penetrating diverse geographic markets and addressing unmet needs.

Market Dynamics

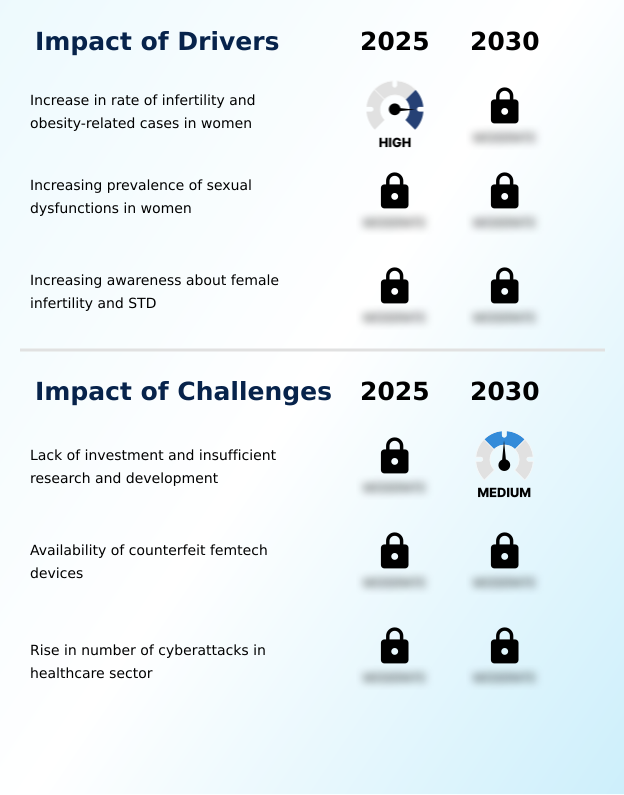
Our researchers analyzed the data with 2025 as the base year, along with the key drivers, trends, and challenges. A holistic analysis of drivers will help companies refine their marketing strategies to gain a competitive advantage.

  • The strategic landscape of the global femtech devices market is increasingly defined by specific, high-value applications that address nuanced health needs. A key area of focus is the impact of AI on femtech device accuracy, where algorithms are enhancing the reliability of predictive health tools.
  • The benefits of wearable sensors in menopause care are becoming particularly evident, offering new ways to manage symptoms through continuous, non-invasive monitoring. Similarly, the role of digital health in managing PCOS is expanding, with integrated platforms helping users track symptoms and treatment responses.
  • This creates a competitive environment centered on at-home fertility monitoring device comparison and evaluations of at-home hormone testing kits. However, data security challenges in femtech applications and ethical considerations in femtech data collection remain significant hurdles that companies must address to build trust.
  • Advancements in non-invasive endometriosis diagnosis and the proven clinical efficacy of smart pelvic floor trainers are opening new treatment pathways. The market is also seeing growth in telehealth solutions for postpartum mental health and personalized nutrition apps for menstrual health.
  • Navigating complex regulatory pathways for femtech software is crucial for commercial success, as is understanding the user adoption rates of digital contraception. Businesses are assessing the ROI of corporate femtech wellness programs, which often feature technologies like connected menstrual cups and devices using TENS for menstrual pain relief.
  • Furthermore, the integration of IoT in smart breast pumps and the future of remote maternal health monitoring are reshaping maternal care. Some systems report that integrated IoT solutions can reduce manual data entry for lactation consultants by over 30%, improving workflow efficiency.

What are the key market drivers leading to the rise in the adoption of Femtech Devices Industry?

  • The rising rate of infertility and obesity-related health issues among women is a key driver for the market's growth.

  • Key drivers for the market include rising health awareness and the demand for convenient, data-driven solutions. The expansion of reproductive health technology, including advanced fertility trackers and digital contraception, empowers users with greater control over family planning.
  • Growth in maternal health monitoring solutions, such as smart breast pumps, is supported by strong e-commerce in healthcare products and direct-to-consumer health devices, which have broadened accessibility.
  • The availability of at-home diagnostic kits for non-invasive diagnostics has led to a 15% increase in early-stage condition awareness among users.
  • Furthermore, the adoption of virtual care for women's health has improved patient engagement rates by over 20%, facilitating remote consultations and continuous support.

What are the market trends shaping the Femtech Devices Industry?

  • The integration of artificial intelligence and machine learning technologies into femtech devices is an emerging market trend, enhancing personalized insights and predictive analytics for women's health.

  • The market is increasingly shaped by the integration of sophisticated technologies aimed at delivering personalized and predictive health outcomes. The adoption of wearable biosensors for women is a primary trend, enabling continuous monitoring for applications like digital therapeutics for menopause, where devices can help manage symptoms like hot flashes with over 90% user-reported satisfaction.
  • These innovations contribute to holistic women's wellness platforms that combine physical and mental health support. Concurrently, AI-powered virtual assistants are enhancing user engagement, while advanced ovulation prediction algorithms are central to predictive analytics in fertility, with some platforms improving accuracy by up to 30%. Gamification in pelvic health is another emerging area, increasing user adherence to prescribed exercise regimens.

What challenges does the Femtech Devices Industry face during its growth?

  • A significant challenge affecting industry growth is the lack of investment coupled with insufficient funding for research and development.

  • The market faces significant hurdles related to funding, security, and regulation. Data privacy in femtech remains a primary concern, as the cost of a healthcare data breach is nearly 45% higher than in other industries, eroding consumer trust in devices like smart menstrual cups that collect sensitive information.
  • Insufficient funding for decentralized clinical trials slows down the clinical validation process for new technologies, including innovations in robotic-assisted surgery and hormone level monitoring. Furthermore, achieving seamless interoperability of health devices is a technical challenge that complicates the integration of AI in reproductive health.
  • Navigating the complex process for regulatory approval for medical devices also creates barriers to market entry for startups, delaying the commercialization of products like at-home STD testing kits.

Exclusive Technavio Analysis on Customer Landscape

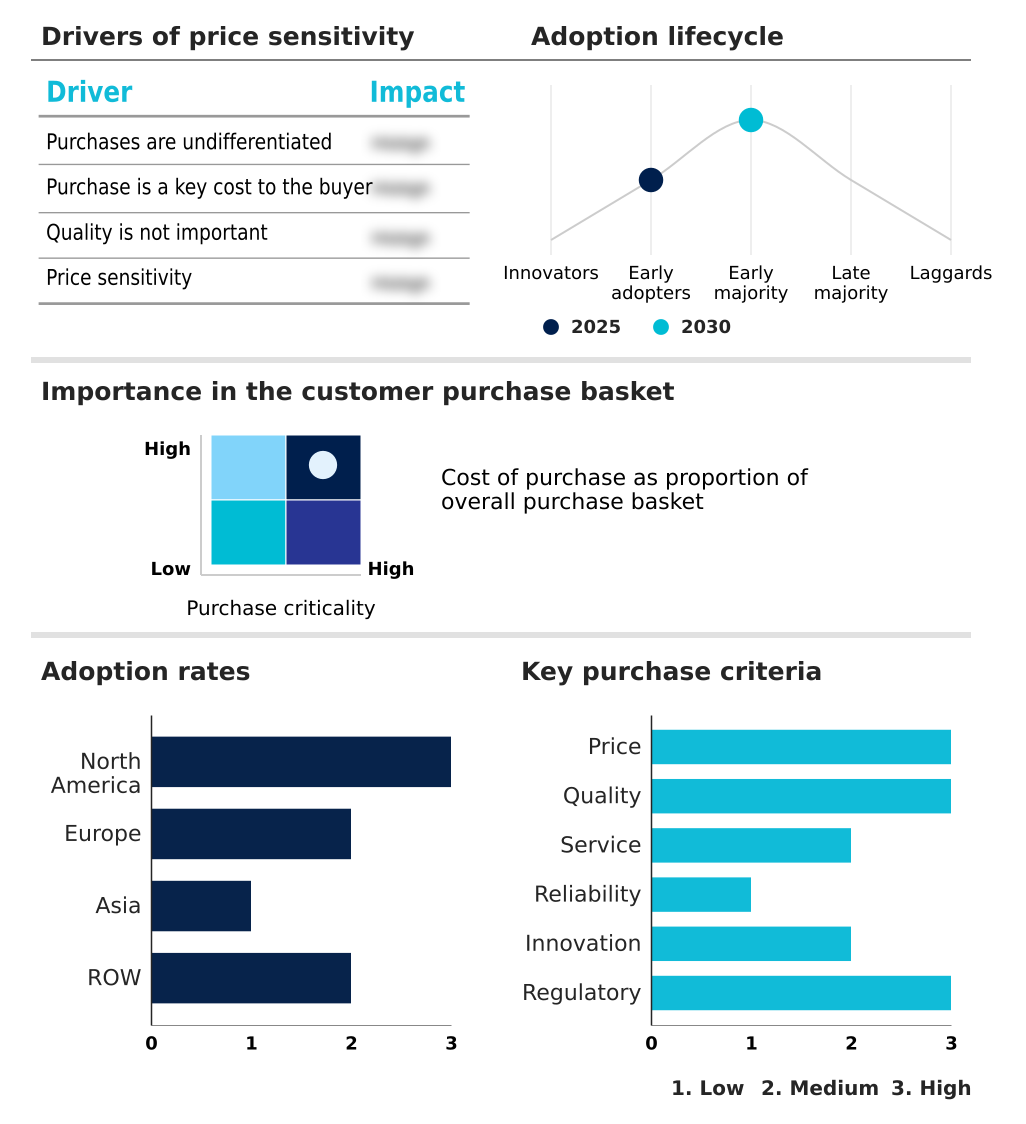
The femtech devices market forecasting report includes the adoption lifecycle of the market, covering from the innovator’s stage to the laggard’s stage. It focuses on adoption rates in different regions based on penetration. Furthermore, the femtech devices market report also includes key purchase criteria and drivers of price sensitivity to help companies evaluate and develop their market growth analysis strategies.

Customer Landscape of Femtech Devices Industry

Competitive Landscape

Companies are implementing various strategies, such as strategic alliances, femtech devices market forecast, partnerships, mergers and acquisitions, geographical expansion, and product/service launches, to enhance their presence in the industry.

Ava AG - Analysis centers on a fragmented landscape where specialized vendors compete through product innovation, quality assurance, and differentiated distribution channels to address diverse women's health needs.

The industry research and growth report includes detailed analyses of the competitive landscape of the market and information about key companies, including:

  • Ava AG
  • Bellabeat Inc.
  • Chiaro Technology Ltd.
  • Coroflo
  • Embr Labs
  • Endomagnetics Ltd.
  • HeraMED
  • iPulse Medical Ltd.
  • iSono Health Inc.
  • Lady Technologies
  • Medela
  • Natural Cycles Nordic
  • Perifit
  • Roman Health Ventures
  • Tempdrop Ltd.
  • Thermaband Inc
  • Valley Electronics AG
  • viO HealthTech Inc.
  • Willow Innovations Inc.
  • Winx Health Inc.

Qualitative and quantitative analysis of companies has been conducted to help clients understand the wider business environment as well as the strengths and weaknesses of key industry players. Data is qualitatively analyzed to categorize companies as pure play, category-focused, industry-focused, and diversified; it is quantitatively analyzed to categorize companies as dominant, leading, strong, tentative, and weak.

Recent Development and News in Femtech devices market

  • In August 2024, Jack Fertility was recognized for its development of an at-home sperm testing kit, a device designed to make male fertility assessments more accessible and private, encouraging proactive participation in the fertility journey.
  • In September 2024, Armor Medical was highlighted as an innovation finalist for its Maternal aRMOR, a wrist-worn, non-invasive monitoring platform created for the early recognition of cardiovascular complications during pregnancy, delivery, and postpartum.
  • In April 2025, Movano Health reportedly received regulatory clearance for its smart ring, a device specifically engineered to monitor a range of women's health metrics, including menstrual cycles, ovulation patterns, and menopause symptoms.
  • In May 2025, EndoCure announced a novel diagnostic system that combines robotics, ultrasound technology, and artificial intelligence to enhance the detection and accurate staging of endometriosis, addressing a significant diagnostic challenge.

Dive into Technavio’s robust research methodology, blending expert interviews, extensive data synthesis, and validated models for unparalleled Femtech Devices Market insights. See full methodology.

Market Scope
Page number 300
Base year 2025
Historic period 2020-2024
Forecast period 2026-2030
Growth momentum & CAGR Accelerate at a CAGR of 14.3%
Market growth 2026-2030 USD 12340.9 million
Market structure Fragmented
YoY growth 2025-2026(%) 12.9%
Key countries US, Canada, Mexico, UK, Germany, France, Spain, The Netherlands, Italy, China, India, Japan, South Korea, Singapore, Indonesia, Brazil, South Africa, Saudi Arabia, UAE, Argentina, Egypt, Colombia and Turkey
Competitive landscape Leading Companies, Market Positioning of Companies, Competitive Strategies, and Industry Risks

Request Free Sample

Research Analyst Overview

  • The femtech devices market is characterized by rapid innovation in hardware and software, fundamentally altering women's health management. The proliferation of wearable health sensors and fertility trackers, enhanced by AI-driven analytics, provides unprecedented personalized health insights. This shift toward data-driven health management is enabling proactive and preventive care.
  • Key offerings include non-invasive diagnostics, advanced pelvic floor trainers, and smart breast pumps, which are increasingly available through direct-to-consumer channels. The integration of ovulation prediction algorithms in at-home diagnostic kits has notably improved family planning, with some algorithms demonstrating over a 20% increase in accuracy compared to traditional methods.
  • For corporate decision-makers, this evolution necessitates strategic budget allocation toward telehealth integration and securing IoT-enabled devices, as remote patient monitoring becomes a standard of care. The market also includes developments in digital contraception, menstrual health monitors, smart menstrual cups, robotic-assisted surgery for gynecological conditions, and AI-powered virtual assistants, all contributing to a more connected and empowered healthcare experience.

What are the Key Data Covered in this Femtech Devices Market Research and Growth Report?

  • What is the expected growth of the Femtech Devices Market between 2026 and 2030?

    • USD 12.34 billion, at a CAGR of 14.3%

  • What segmentation does the market report cover?

    • The report is segmented by Product Type (Wearable devices, Diagnostic devices, and Others), Application (Pregnancy and nursing care, Reproductive health and contraception, Menstrual health, Pelvic and uterine health, and Others), End-user (Individual users, Hospitals, Fertility clinics, and Others) and Geography (North America, Europe, Asia, Rest of World (ROW))

  • Which regions are analyzed in the report?

    • North America, Europe, Asia and Rest of World (ROW)

  • What are the key growth drivers and market challenges?

    • Increase in rate of infertility and obesity-related cases in women, Lack of investment and insufficient research and development

  • Who are the major players in the Femtech Devices Market?

    • Ava AG, Bellabeat Inc., Chiaro Technology Ltd., Coroflo, Embr Labs, Endomagnetics Ltd., HeraMED, iPulse Medical Ltd., iSono Health Inc., Lady Technologies, Medela, Natural Cycles Nordic, Perifit, Roman Health Ventures, Tempdrop Ltd., Thermaband Inc, Valley Electronics AG, viO HealthTech Inc., Willow Innovations Inc. and Winx Health Inc.

Market Research Insights

  • The market is shaped by a strategic shift toward patient-centric healthcare models and preventive care technology, where digital health platforms for women are becoming central. The adoption of direct-to-consumer health devices has improved access, with some platforms reporting a 30% increase in user engagement for chronic condition management for women.
  • Concurrently, telehealth integration in femtech has streamlined remote diagnostics for gynecology, reducing the need for in-person visits by up to 40%. However, ensuring interoperability of health devices remains a focus, as seamless data exchange can lower diagnostic errors by 15%.
  • This dynamic environment pushes firms to prioritize clinical validation of femtech and a superior user experience in health apps to maintain competitive differentiation.

We can help! Our analysts can customize this femtech devices market research report to meet your requirements.

Get in touch

1. Executive Summary

1.1 Market overview

Executive Summary - Chart on Market Overview
Executive Summary - Data Table on Market Overview
Executive Summary - Chart on Global Market Characteristics
Executive Summary - Chart on Market by Geography
Executive Summary - Chart on Market Segmentation by Product Type
Executive Summary - Chart on Market Segmentation by Application
Executive Summary - Chart on Market Segmentation by End-user
Executive Summary - Chart on Incremental Growth
Executive Summary - Data Table on Incremental Growth
Executive Summary - Chart on Company Market Positioning

2. Technavio Analysis

2.1 Analysis of price sensitivity, lifecycle, customer purchase basket, adoption rates, and purchase criteria

2.2 Criticality of inputs and Factors of differentiation

Chart on Overview on criticality of inputs and factors of differentiation

2.3 Factors of disruption

Chart on Overview on factors of disruption

2.4 Impact of drivers and challenges

Chart on Impact of drivers and challenges in 2025 and 2030

3. Market Landscape

3.1 Market ecosystem

Chart on Parent Market
Data Table on - Parent Market

3.2 Market characteristics

Chart on Market characteristics analysis

3.3 Value chain analysis

Chart on Value chain analysis

4. Market Sizing

4.1 Market definition

Data Table on Offerings of companies included in the market definition

4.2 Market segment analysis

Market segments

4.3 Market size 2025

4.4 Market outlook: Forecast for 2025-2030

Chart on Global - Market size and forecast 2025-2030 ($ million)
Data Table on Global - Market size and forecast 2025-2030 ($ million)
Chart on Global Market: Year-over-year growth 2025-2030 (%)
Data Table on Global Market: Year-over-year growth 2025-2030 (%)

5. Historic Market Size

5.1 Global Femtech Devices Market 2020 - 2024

Historic Market Size - Data Table on Global Femtech Devices Market 2020 - 2024 ($ million)

5.2 Product Type segment analysis 2020 - 2024

Historic Market Size - Product Type Segment 2020 - 2024 ($ million)

5.3 Application segment analysis 2020 - 2024

Historic Market Size - Application Segment 2020 - 2024 ($ million)

5.4 End-user segment analysis 2020 - 2024

Historic Market Size - End-user Segment 2020 - 2024 ($ million)

5.5 Geography segment analysis 2020 - 2024

Historic Market Size - Geography Segment 2020 - 2024 ($ million)

5.6 Country segment analysis 2020 - 2024

Historic Market Size - Country Segment 2020 - 2024 ($ million)

6. Qualitative Analysis

6.1 The AI impact on Global Femtech Devices Market

7. Five Forces Analysis

7.1 Five forces summary

Five forces analysis - Comparison between 2025 and 2030

7.2 Bargaining power of buyers

Bargaining power of buyers - Impact of key factors 2025 and 2030

7.3 Bargaining power of suppliers

Bargaining power of suppliers - Impact of key factors in 2025 and 2030

7.4 Threat of new entrants

Threat of new entrants - Impact of key factors in 2025 and 2030

7.5 Threat of substitutes

Threat of substitutes - Impact of key factors in 2025 and 2030

7.6 Threat of rivalry

Threat of rivalry - Impact of key factors in 2025 and 2030

7.7 Market condition

Chart on Market condition - Five forces 2025 and 2030

8. Market Segmentation by Product Type

8.1 Market segments

Chart on Product Type - Market share 2025-2030 (%)
Data Table on Product Type - Market share 2025-2030 (%)

8.2 Comparison by Product Type

Chart on Comparison by Product Type
Data Table on Comparison by Product Type

8.3 Wearable devices - Market size and forecast 2025-2030

Chart on Wearable devices - Market size and forecast 2025-2030 ($ million)
Data Table on Wearable devices - Market size and forecast 2025-2030 ($ million)
Chart on Wearable devices - Year-over-year growth 2025-2030 (%)
Data Table on Wearable devices - Year-over-year growth 2025-2030 (%)

8.4 Diagnostic devices - Market size and forecast 2025-2030

Chart on Diagnostic devices - Market size and forecast 2025-2030 ($ million)
Data Table on Diagnostic devices - Market size and forecast 2025-2030 ($ million)
Chart on Diagnostic devices - Year-over-year growth 2025-2030 (%)
Data Table on Diagnostic devices - Year-over-year growth 2025-2030 (%)

8.5 Others - Market size and forecast 2025-2030

Chart on Others - Market size and forecast 2025-2030 ($ million)
Data Table on Others - Market size and forecast 2025-2030 ($ million)
Chart on Others - Year-over-year growth 2025-2030 (%)
Data Table on Others - Year-over-year growth 2025-2030 (%)

8.6 Market opportunity by Product Type

Market opportunity by Product Type ($ million)
Data Table on Market opportunity by Product Type ($ million)

9. Market Segmentation by Application

9.1 Market segments

Chart on Application - Market share 2025-2030 (%)
Data Table on Application - Market share 2025-2030 (%)

9.2 Comparison by Application

Chart on Comparison by Application
Data Table on Comparison by Application

9.3 Pregnancy and nursing care - Market size and forecast 2025-2030

Chart on Pregnancy and nursing care - Market size and forecast 2025-2030 ($ million)
Data Table on Pregnancy and nursing care - Market size and forecast 2025-2030 ($ million)
Chart on Pregnancy and nursing care - Year-over-year growth 2025-2030 (%)
Data Table on Pregnancy and nursing care - Year-over-year growth 2025-2030 (%)

9.4 Reproductive health and contraception - Market size and forecast 2025-2030

Chart on Reproductive health and contraception - Market size and forecast 2025-2030 ($ million)
Data Table on Reproductive health and contraception - Market size and forecast 2025-2030 ($ million)
Chart on Reproductive health and contraception - Year-over-year growth 2025-2030 (%)
Data Table on Reproductive health and contraception - Year-over-year growth 2025-2030 (%)

9.5 Menstrual health - Market size and forecast 2025-2030

Chart on Menstrual health - Market size and forecast 2025-2030 ($ million)
Data Table on Menstrual health - Market size and forecast 2025-2030 ($ million)
Chart on Menstrual health - Year-over-year growth 2025-2030 (%)
Data Table on Menstrual health - Year-over-year growth 2025-2030 (%)

9.6 Pelvic and uterine health - Market size and forecast 2025-2030

Chart on Pelvic and uterine health - Market size and forecast 2025-2030 ($ million)
Data Table on Pelvic and uterine health - Market size and forecast 2025-2030 ($ million)
Chart on Pelvic and uterine health - Year-over-year growth 2025-2030 (%)
Data Table on Pelvic and uterine health - Year-over-year growth 2025-2030 (%)

9.7 Others - Market size and forecast 2025-2030

Chart on Others - Market size and forecast 2025-2030 ($ million)
Data Table on Others - Market size and forecast 2025-2030 ($ million)
Chart on Others - Year-over-year growth 2025-2030 (%)
Data Table on Others - Year-over-year growth 2025-2030 (%)

9.8 Market opportunity by Application

Market opportunity by Application ($ million)
Data Table on Market opportunity by Application ($ million)

10. Market Segmentation by End-user

10.1 Market segments

Chart on End-user - Market share 2025-2030 (%)
Data Table on End-user - Market share 2025-2030 (%)

10.2 Comparison by End-user

Chart on Comparison by End-user
Data Table on Comparison by End-user

10.3 Individual users - Market size and forecast 2025-2030

Chart on Individual users - Market size and forecast 2025-2030 ($ million)
Data Table on Individual users - Market size and forecast 2025-2030 ($ million)
Chart on Individual users - Year-over-year growth 2025-2030 (%)
Data Table on Individual users - Year-over-year growth 2025-2030 (%)

10.4 Hospitals - Market size and forecast 2025-2030

Chart on Hospitals - Market size and forecast 2025-2030 ($ million)
Data Table on Hospitals - Market size and forecast 2025-2030 ($ million)
Chart on Hospitals - Year-over-year growth 2025-2030 (%)
Data Table on Hospitals - Year-over-year growth 2025-2030 (%)

10.5 Fertility clinics - Market size and forecast 2025-2030

Chart on Fertility clinics - Market size and forecast 2025-2030 ($ million)
Data Table on Fertility clinics - Market size and forecast 2025-2030 ($ million)
Chart on Fertility clinics - Year-over-year growth 2025-2030 (%)
Data Table on Fertility clinics - Year-over-year growth 2025-2030 (%)

10.6 Others - Market size and forecast 2025-2030

Chart on Others - Market size and forecast 2025-2030 ($ million)
Data Table on Others - Market size and forecast 2025-2030 ($ million)
Chart on Others - Year-over-year growth 2025-2030 (%)
Data Table on Others - Year-over-year growth 2025-2030 (%)

10.7 Market opportunity by End-user

Market opportunity by End-user ($ million)
Data Table on Market opportunity by End-user ($ million)

11. Customer Landscape

11.1 Customer landscape overview

Analysis of price sensitivity, lifecycle, customer purchase basket, adoption rates, and purchase criteria

12. Geographic Landscape

12.1 Geographic segmentation

Chart on Market share by geography 2025-2030 (%)
Data Table on Market share by geography 2025-2030 (%)

12.2 Geographic comparison

Chart on Geographic comparison
Data Table on Geographic comparison

12.3 North America - Market size and forecast 2025-2030

Chart on North America - Market size and forecast 2025-2030 ($ million)
Data Table on North America - Market size and forecast 2025-2030 ($ million)
Chart on North America - Year-over-year growth 2025-2030 (%)
Data Table on North America - Year-over-year growth 2025-2030 (%)
Chart on Regional Comparison - North America
Data Table on Regional Comparison - North America

12.3.1 US - Market size and forecast 2025-2030

Chart on US - Market size and forecast 2025-2030 ($ million)
Data Table on US - Market size and forecast 2025-2030 ($ million)
Chart on US - Year-over-year growth 2025-2030 (%)
Data Table on US - Year-over-year growth 2025-2030 (%)

12.3.2 Canada - Market size and forecast 2025-2030

Chart on Canada - Market size and forecast 2025-2030 ($ million)
Data Table on Canada - Market size and forecast 2025-2030 ($ million)
Chart on Canada - Year-over-year growth 2025-2030 (%)
Data Table on Canada - Year-over-year growth 2025-2030 (%)

12.3.3 Mexico - Market size and forecast 2025-2030

Chart on Mexico - Market size and forecast 2025-2030 ($ million)
Data Table on Mexico - Market size and forecast 2025-2030 ($ million)
Chart on Mexico - Year-over-year growth 2025-2030 (%)
Data Table on Mexico - Year-over-year growth 2025-2030 (%)

12.4 Europe - Market size and forecast 2025-2030

Chart on Europe - Market size and forecast 2025-2030 ($ million)
Data Table on Europe - Market size and forecast 2025-2030 ($ million)
Chart on Europe - Year-over-year growth 2025-2030 (%)
Data Table on Europe - Year-over-year growth 2025-2030 (%)
Chart on Regional Comparison - Europe
Data Table on Regional Comparison - Europe

12.4.1 UK - Market size and forecast 2025-2030

Chart on UK - Market size and forecast 2025-2030 ($ million)
Data Table on UK - Market size and forecast 2025-2030 ($ million)
Chart on UK - Year-over-year growth 2025-2030 (%)
Data Table on UK - Year-over-year growth 2025-2030 (%)

12.4.2 Germany - Market size and forecast 2025-2030

Chart on Germany - Market size and forecast 2025-2030 ($ million)
Data Table on Germany - Market size and forecast 2025-2030 ($ million)
Chart on Germany - Year-over-year growth 2025-2030 (%)
Data Table on Germany - Year-over-year growth 2025-2030 (%)

12.4.3 France - Market size and forecast 2025-2030

Chart on France - Market size and forecast 2025-2030 ($ million)
Data Table on France - Market size and forecast 2025-2030 ($ million)
Chart on France - Year-over-year growth 2025-2030 (%)
Data Table on France - Year-over-year growth 2025-2030 (%)

12.4.4 Spain - Market size and forecast 2025-2030

Chart on Spain - Market size and forecast 2025-2030 ($ million)
Data Table on Spain - Market size and forecast 2025-2030 ($ million)
Chart on Spain - Year-over-year growth 2025-2030 (%)
Data Table on Spain - Year-over-year growth 2025-2030 (%)

12.4.5 The Netherlands - Market size and forecast 2025-2030

Chart on The Netherlands - Market size and forecast 2025-2030 ($ million)
Data Table on The Netherlands - Market size and forecast 2025-2030 ($ million)
Chart on The Netherlands - Year-over-year growth 2025-2030 (%)
Data Table on The Netherlands - Year-over-year growth 2025-2030 (%)

12.4.6 Italy - Market size and forecast 2025-2030

Chart on Italy - Market size and forecast 2025-2030 ($ million)
Data Table on Italy - Market size and forecast 2025-2030 ($ million)
Chart on Italy - Year-over-year growth 2025-2030 (%)
Data Table on Italy - Year-over-year growth 2025-2030 (%)

12.5 Asia - Market size and forecast 2025-2030

Chart on Asia - Market size and forecast 2025-2030 ($ million)
Data Table on Asia - Market size and forecast 2025-2030 ($ million)
Chart on Asia - Year-over-year growth 2025-2030 (%)
Data Table on Asia - Year-over-year growth 2025-2030 (%)
Chart on Regional Comparison - Asia
Data Table on Regional Comparison - Asia

12.5.1 China - Market size and forecast 2025-2030

Chart on China - Market size and forecast 2025-2030 ($ million)
Data Table on China - Market size and forecast 2025-2030 ($ million)
Chart on China - Year-over-year growth 2025-2030 (%)
Data Table on China - Year-over-year growth 2025-2030 (%)

12.5.2 India - Market size and forecast 2025-2030

Chart on India - Market size and forecast 2025-2030 ($ million)
Data Table on India - Market size and forecast 2025-2030 ($ million)
Chart on India - Year-over-year growth 2025-2030 (%)
Data Table on India - Year-over-year growth 2025-2030 (%)

12.5.3 Japan - Market size and forecast 2025-2030

Chart on Japan - Market size and forecast 2025-2030 ($ million)
Data Table on Japan - Market size and forecast 2025-2030 ($ million)
Chart on Japan - Year-over-year growth 2025-2030 (%)
Data Table on Japan - Year-over-year growth 2025-2030 (%)

12.5.4 South Korea - Market size and forecast 2025-2030

Chart on South Korea - Market size and forecast 2025-2030 ($ million)
Data Table on South Korea - Market size and forecast 2025-2030 ($ million)
Chart on South Korea - Year-over-year growth 2025-2030 (%)
Data Table on South Korea - Year-over-year growth 2025-2030 (%)

12.5.5 Singapore - Market size and forecast 2025-2030

Chart on Singapore - Market size and forecast 2025-2030 ($ million)
Data Table on Singapore - Market size and forecast 2025-2030 ($ million)
Chart on Singapore - Year-over-year growth 2025-2030 (%)
Data Table on Singapore - Year-over-year growth 2025-2030 (%)

12.5.6 Indonesia - Market size and forecast 2025-2030

Chart on Indonesia - Market size and forecast 2025-2030 ($ million)
Data Table on Indonesia - Market size and forecast 2025-2030 ($ million)
Chart on Indonesia - Year-over-year growth 2025-2030 (%)
Data Table on Indonesia - Year-over-year growth 2025-2030 (%)

12.6 Rest of World (ROW) - Market size and forecast 2025-2030

Chart on Rest of World (ROW) - Market size and forecast 2025-2030 ($ million)
Data Table on Rest of World (ROW) - Market size and forecast 2025-2030 ($ million)
Chart on Rest of World (ROW) - Year-over-year growth 2025-2030 (%)
Data Table on Rest of World (ROW) - Year-over-year growth 2025-2030 (%)
Chart on Regional Comparison - Rest of World (ROW)
Data Table on Regional Comparison - Rest of World (ROW)

12.6.1 Brazil - Market size and forecast 2025-2030

Chart on Brazil - Market size and forecast 2025-2030 ($ million)
Data Table on Brazil - Market size and forecast 2025-2030 ($ million)
Chart on Brazil - Year-over-year growth 2025-2030 (%)
Data Table on Brazil - Year-over-year growth 2025-2030 (%)

12.6.2 South Africa - Market size and forecast 2025-2030

Chart on South Africa - Market size and forecast 2025-2030 ($ million)
Data Table on South Africa - Market size and forecast 2025-2030 ($ million)
Chart on South Africa - Year-over-year growth 2025-2030 (%)
Data Table on South Africa - Year-over-year growth 2025-2030 (%)

12.6.3 Saudi Arabia - Market size and forecast 2025-2030

Chart on Saudi Arabia - Market size and forecast 2025-2030 ($ million)
Data Table on Saudi Arabia - Market size and forecast 2025-2030 ($ million)
Chart on Saudi Arabia - Year-over-year growth 2025-2030 (%)
Data Table on Saudi Arabia - Year-over-year growth 2025-2030 (%)

12.6.4 UAE - Market size and forecast 2025-2030

Chart on UAE - Market size and forecast 2025-2030 ($ million)
Data Table on UAE - Market size and forecast 2025-2030 ($ million)
Chart on UAE - Year-over-year growth 2025-2030 (%)
Data Table on UAE - Year-over-year growth 2025-2030 (%)

12.6.5 Argentina - Market size and forecast 2025-2030

Chart on Argentina - Market size and forecast 2025-2030 ($ million)
Data Table on Argentina - Market size and forecast 2025-2030 ($ million)
Chart on Argentina - Year-over-year growth 2025-2030 (%)
Data Table on Argentina - Year-over-year growth 2025-2030 (%)

12.6.6 Egypt - Market size and forecast 2025-2030

Chart on Egypt - Market size and forecast 2025-2030 ($ million)
Data Table on Egypt - Market size and forecast 2025-2030 ($ million)
Chart on Egypt - Year-over-year growth 2025-2030 (%)
Data Table on Egypt - Year-over-year growth 2025-2030 (%)

12.6.7 Colombia - Market size and forecast 2025-2030

Chart on Colombia - Market size and forecast 2025-2030 ($ million)
Data Table on Colombia - Market size and forecast 2025-2030 ($ million)
Chart on Colombia - Year-over-year growth 2025-2030 (%)
Data Table on Colombia - Year-over-year growth 2025-2030 (%)

12.6.8 Turkey - Market size and forecast 2025-2030

Chart on Turkey - Market size and forecast 2025-2030 ($ million)
Data Table on Turkey - Market size and forecast 2025-2030 ($ million)
Chart on Turkey - Year-over-year growth 2025-2030 (%)
Data Table on Turkey - Year-over-year growth 2025-2030 (%)

12.7 Market opportunity by geography

Market opportunity by geography ($ million)
Data Tables on Market opportunity by geography ($ million)

13. Drivers, Challenges, and Opportunity

13.1 Market drivers

Increase in rate of infertility and obesity-related cases in women
Increasing prevalence of sexual dysfunctions in women
Increasing awareness about female infertility and STD

13.2 Market challenges

Lack of investment and insufficient research and development
Availability of counterfeit femtech devices
Rise in number of cyberattacks in healthcare sector

13.3 Impact of drivers and challenges

Impact of drivers and challenges in 2025 and 2030

13.4 Market opportunities

Integration of AI and machine learning (ML) technologies in femtech devices
Increase in adoption of wearables for menopause care
Increasing focus on digital health solutions

14. Competitive Landscape

14.1 Overview

14.2

Overview on criticality of inputs and factors of differentiation

14.3 Landscape disruption

Overview on factors of disruption

14.4 Industry risks

Impact of key risks on business

15. Competitive Analysis

15.1 Companies profiled

Companies covered

15.2 Company ranking index

15.3 Market positioning of companies

Matrix on companies position and classification

15.4 Ava AG

Ava AG - Overview
Ava AG - Product / Service
Ava AG - Key offerings
SWOT

15.5 Bellabeat Inc.

Bellabeat Inc. - Overview
Bellabeat Inc. - Product / Service
Bellabeat Inc. - Key offerings
SWOT

15.6 Chiaro Technology Ltd.

Chiaro Technology Ltd. - Overview
Chiaro Technology Ltd. - Product / Service
Chiaro Technology Ltd. - Key offerings
SWOT

15.7 Coroflo

Coroflo - Overview
Coroflo - Product / Service
Coroflo - Key offerings
SWOT

15.8 Endomagnetics Ltd.

Endomagnetics Ltd. - Overview
Endomagnetics Ltd. - Product / Service
Endomagnetics Ltd. - Key offerings
SWOT

15.9 HeraMED

HeraMED - Overview
HeraMED - Product / Service
HeraMED - Key offerings
SWOT

15.10 iPulse Medical Ltd.

iPulse Medical Ltd. - Overview
iPulse Medical Ltd. - Product / Service
iPulse Medical Ltd. - Key offerings
SWOT

15.11 iSono Health Inc.

iSono Health Inc. - Overview
iSono Health Inc. - Product / Service
iSono Health Inc. - Key offerings
SWOT

15.12 Natural Cycles Nordic

Natural Cycles Nordic - Overview
Natural Cycles Nordic - Product / Service
Natural Cycles Nordic - Key offerings
SWOT

15.13 Perifit

Perifit - Overview
Perifit - Product / Service
Perifit - Key offerings
SWOT

15.14 Roman Health Ventures

Roman Health Ventures - Overview
Roman Health Ventures - Product / Service
Roman Health Ventures - Key offerings
SWOT

15.15 Tempdrop Ltd.

Tempdrop Ltd. - Overview
Tempdrop Ltd. - Product / Service
Tempdrop Ltd. - Key offerings
SWOT

15.16 Thermaband Inc

Thermaband Inc - Overview
Thermaband Inc - Product / Service
Thermaband Inc - Key offerings
SWOT

15.17 Willow Innovations Inc.

Willow Innovations Inc. - Overview
Willow Innovations Inc. - Product / Service
Willow Innovations Inc. - Key offerings
SWOT

15.18 Winx Health Inc.

Winx Health Inc. - Overview
Winx Health Inc. - Product / Service
Winx Health Inc. - Key offerings
SWOT

16. Appendix

16.1 Scope of the report

Market definition
Objectives
Notes and caveats

16.2 Inclusions and exclusions checklist

Inclusions checklist
Exclusions checklist

16.3 Currency conversion rates for US$

16.4 Research methodology

16.5 Data procurement

Information sources

16.6 Data validation

16.7 Validation techniques employed for market sizing

16.8 Data synthesis

16.9 360 degree market analysis

16.10 List of abbreviations

Research Methodology

Technavio presents a detailed picture of the market by way of study, synthesis, and summation of data from multiple sources. The analysts have presented the various facets of the market with a particular focus on identifying the key industry influencers. The data thus presented is comprehensive, reliable, and the result of extensive research, both primary and secondary.

INFORMATION SOURCES

Primary sources

  • Manufacturers and suppliers
  • Channel partners
  • Industry experts
  • Strategic decision makers

Secondary sources

  • Industry journals and periodicals
  • Government data
  • Financial reports of key industry players
  • Historical data
  • Press releases

DATA ANALYSIS

Data Synthesis

  • Collation of data
  • Estimation of key figures
  • Analysis of derived insights

Data Validation

  • Triangulation with data models
  • Reference against proprietary databases
  • Corroboration with industry experts

REPORT WRITING

Qualitative

  • Market drivers
  • Market challenges
  • Market trends
  • Five forces analysis

Quantitative

  • Market size and forecast
  • Market segmentation
  • Geographical insights
  • Competitive landscape

Interested in this report?

Get your sample now to see our research methodology and insights!

Download Now

Frequently Asked Questions

Femtech Devices market growth will increase by USD 12340.9 million during 2026-2030 .

The Femtech Devices market is expected to grow at a CAGR of 14.3% during 2026-2030 .

Femtech Devices market is segmented by Product type (Wearable devices, Diagnostic devices, Others) Application (Pregnancy and nursing care, Reproductive health and contraception, Menstrual health, Pelvic and uterine health, Others) End-user (Individual users, Hospitals, Fertility clinics, Others)

Ava AG, Bellabeat Inc., Chiaro Technology Ltd., Coroflo, Embr Labs, Endomagnetics Ltd., HeraMED, iPulse Medical Ltd., iSono Health Inc., Lady Technologies, Medela, Natural Cycles Nordic, Perifit, Roman Health Ventures, Tempdrop Ltd., Thermaband Inc, Valley Electronics AG, viO HealthTech Inc., Willow Innovations Inc., Winx Health Inc. are a few of the key vendors in the Femtech Devices market.

North America will register the highest growth rate of 52.2% among the other regions. Therefore, the Femtech Devices market in North America is expected to garner significant business opportunities for the vendors during the forecast period.

US, Canada, Mexico, UK, Germany, France, Spain, The Netherlands, Italy, China, India, Japan, South Korea, Singapore, Indonesia, Brazil, South Africa, Saudi Arabia, UAE, Argentina, Egypt, Colombia, Turkey

  • Increase in rate of infertility and obesity-related cases in women is the driving factor this market.

The Femtech Devices market vendors should focus on grabbing business opportunities from the Product type segment as it accounted for the largest market share in the base year.