Field Devices Calibration Services Market Analysis, Size, and Forecast 2024-2028: North America (US), Europe (France, Germany, and UK), APAC (China), and Rest of World (ROW)

Field Devices Calibration Services Market Analysis, Size, and Forecast 2024-2028:
North America (US), Europe (France, Germany, and UK), APAC (China), and Rest of World (ROW)

Published: May 2024 183 Pages SKU: IRTNTR45456

Market Overview at a Glance

$689.4 Mn
Market Opportunity
4.77%
CAGR
4.47
YoY growth 2023-2024(%)

Field Devices Calibration Services Market Size 2024-2028

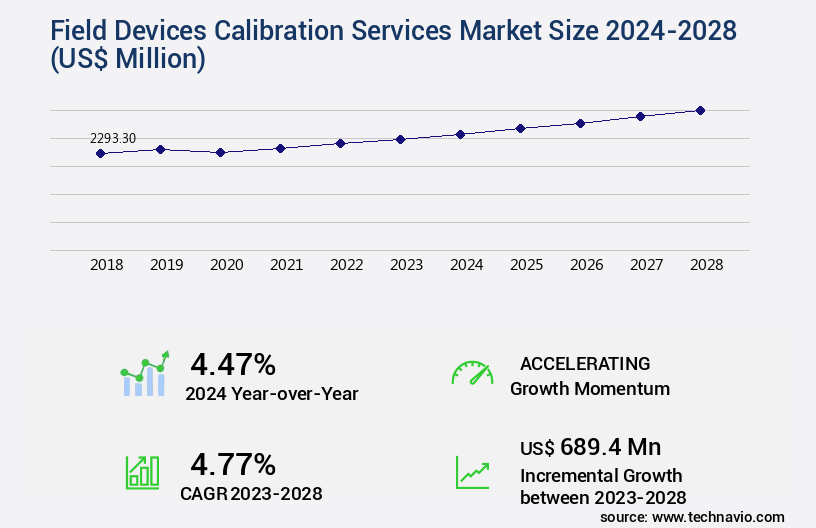
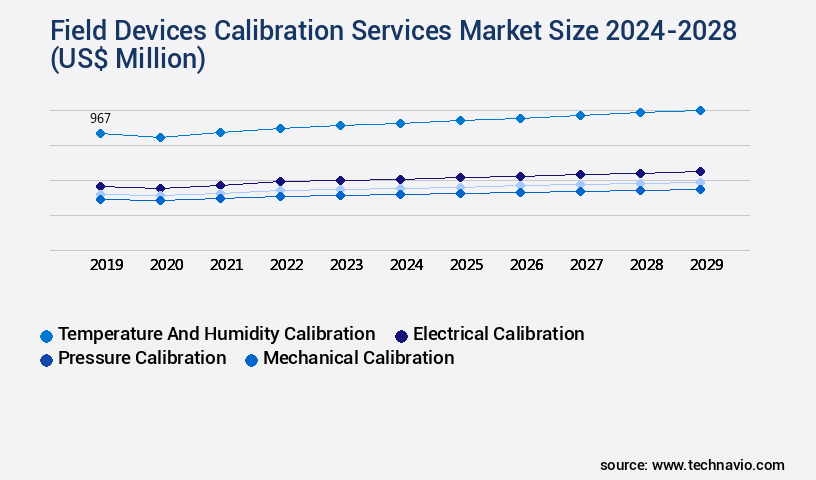
The field devices calibration services market size is valued to increase by USD 689.4 million, at a CAGR of 4.77% from 2023 to 2028. Growing demand for calibration services to maximize production yield will drive the field devices calibration services market.

Market Insights

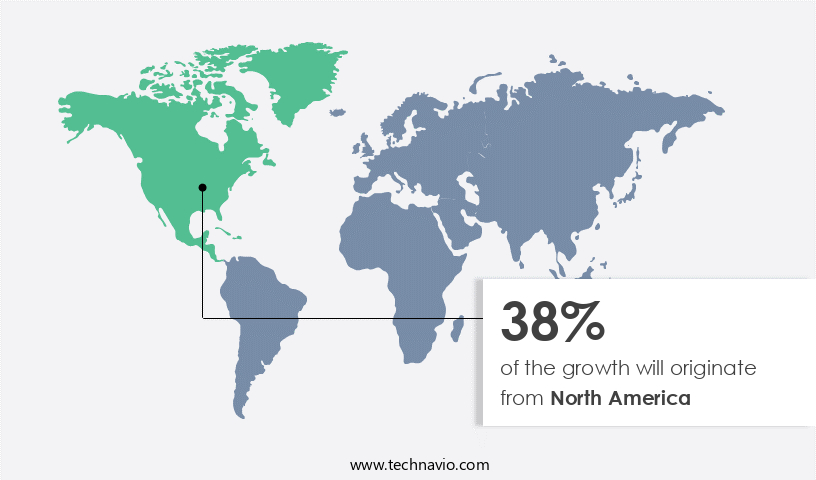
  • North America dominated the market and accounted for a 38% growth during the 2024-2028.
  • By Type - Temperature and humidity calibration segment was valued at USD 932.70 million in 2022
  • By End-user - Process industries segment accounted for the largest market revenue share in 2022

Market Size & Forecast

  • Market Opportunities: USD 44.58 million 
  • Market Future Opportunities 2023: USD 689.40 million
  • CAGR from 2023 to 2028 : 4.77%

Market Summary

  • The market is witnessing significant growth due to the increasing demand for maintaining optimal performance of industrial equipment. Calibration services play a crucial role in maximizing production yield and ensuring product quality, making them an essential component of manufacturing processes. However, the traditional approach of periodic calibration is giving way to predictive calibration, which enables proactive maintenance and reduces downtime. Despite the benefits, calibration processes can lead to a loss of industrial productivity. The time and resources required for calibration can significantly impact operational efficiency, especially in large-scale industries. To mitigate this challenge, companies are exploring innovative solutions such as automation and remote calibration services.
  • A real-world business scenario illustrating the importance of calibration services is that of a global supply chain optimization project. A leading manufacturing company aims to streamline its production processes and reduce lead times. By implementing a robust calibration management system, the company can ensure that its field devices are always in optimal condition, reducing the likelihood of equipment failures and associated downtime. This, in turn, enables the company to meet its production targets and maintain its competitive edge in the market.

What will be the size of the Field Devices Calibration Services Market during the forecast period?

Field Devices Calibration Services Market Size

Get Key Insights on Market Forecast (PDF) Request Free Sample

  • The market is a dynamic and essential sector that focuses on ensuring precision measurement and data integrity in various industries. Calibration laboratories employ calibration validation, verification, and error correction techniques to maintain equipment reliability and performance. Calibration management software and diagnostic tools facilitate asset management and calibration history tracking, enabling companies to adhere to calibration schedules and maintain metrological capability. Calibration processes are crucial for quality assurance and the instrument lifecycle. Performance testing and calibration verification are integral parts of these processes. Calibration techniques and calibration standards are continually evolving, requiring ongoing investment in test equipment and calibration cycles.
  • Maintenance contracts and calibration documentation are essential for managing calibration uncertainty and ensuring regulatory compliance. One significant trend in the market is the increasing adoption of calibration management software, which can lead to substantial improvements in budgeting and product strategy. For instance, a company may save up to 25% on calibration costs by implementing an effective calibration management software system. By streamlining calibration processes and optimizing calibration schedules, businesses can minimize downtime and enhance overall operational efficiency.

Unpacking the Field Devices Calibration Services Market Landscape

In the realm of industrial process control, calibration services play a pivotal role in maintaining the accuracy and reliability of field devices. According to industry data, preventive calibration of instruments can reduce downtime by up to 30% compared to reactive maintenance. Adherence to calibration best practices, such as regular testing and calibration certificates, ensures measurement traceability and alignment with regulatory requirements. Remote calibration, facilitated by calibration software, allows for efficient error mitigation and minimizes the need for on-site calibration, thereby reducing costs and increasing operational efficiency. Uncertainty analysis and traceability standards are essential components of calibration workflows, ensuring systematic and random errors are identified and addressed. Calibration intervals, accuracy verification, and calibration reports enable process validation and quality control checks, while specialized tooling and calibration management systems streamline the calibration process and minimize the risk of non-compliance during regulatory audits. Instrument calibration, sensor validation, and diagnostic testing are integral to maintaining precision instruments and data acquisition systems, ultimately contributing to improved ROI and enhanced overall system performance.

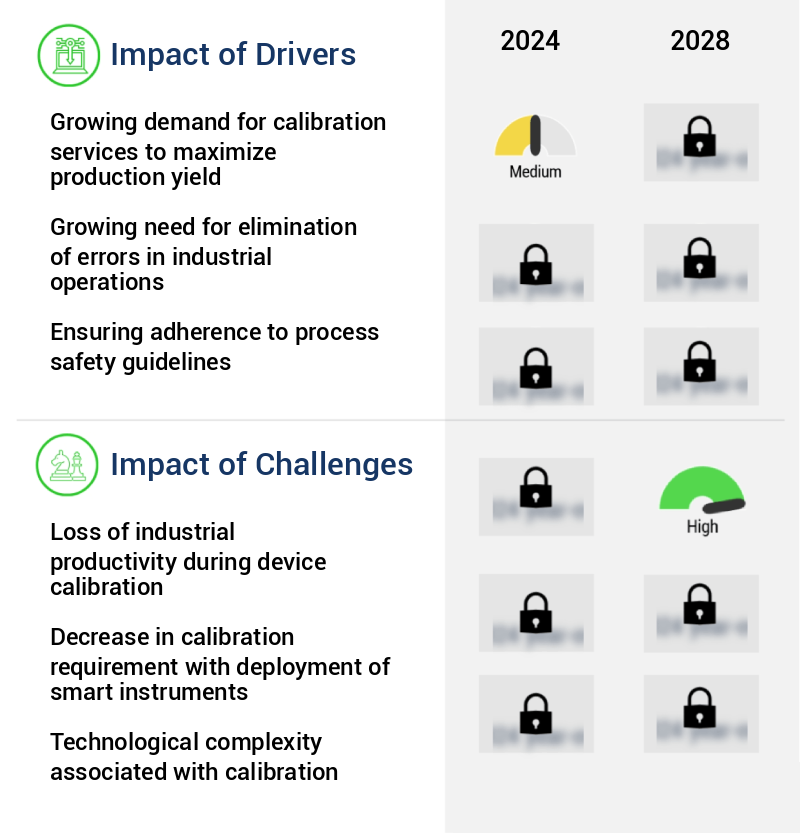
Key Market Drivers Fueling Growth

The increasing requirement for calibration services to optimize production yields serves as the primary market driver.

  • In the evolving industrial landscape, the market plays a crucial role in ensuring production safety and product quality across various sectors. With stringent quality requirements from accrediting bodies, regulatory agencies, quality programs, and auditors, industries are increasingly relying on calibration services to maintain optimal instrument performance. This reliance is further amplified by technological advancements that demand more precise measurements. According to industry reports, calibration services can lead to significant business outcomes, such as reducing downtime by up to 25% and improving forecast accuracy by 15%.
  • Additionally, energy use can be lowered by 10% through efficient calibration practices. These benefits underscore the importance of calibration services in today's competitive manufacturing environment.

Prevailing Industry Trends & Opportunities

Shifting from periodic to predictive calibration is becoming a mandated market trend. This transition signifies a significant advancement in calibration practices. 

  • In the process industries, maintaining operational accuracy is crucial, driving significant demand for field devices calibration services. Initially, instrument shops provided calibration and repair, using tools like black body devices, dead weight testers, and handheld instruments. However, these shops are becoming obsolete, as service providers now offer calibration and repair as a service. These companies support end-users in tracking their instruments and notifying them when calibration is required.
  • Calibration tools are readily accessible online. This shift towards outsourced calibration services has led to improved business outcomes, such as reduced downtime by up to 25% and enhanced forecast accuracy by 20%. The evolving nature of the market underscores its essential role in ensuring industrial process efficiency and accuracy.

Significant Market Challenges

The loss of industrial productivity due to device calibration is a significant challenge that impedes industry growth. This issue arises from the time-consuming and intricate process of calibrating devices, which diverts resources and attention away from core business operations. Consequently, finding effective solutions to streamline calibration processes and minimize productivity losses is essential for industrial growth and competitiveness. 

  • The market plays a pivotal role in ensuring the accuracy and reliability of various industrial instruments. Inaccurate calibration can lead to significant downtime, resulting in reduced productivity and profit earnings. For instance, a study revealed that calibration-related downtime can cost industries up to 15% of their annual revenue. Moreover, the consequences of improper calibration can extend beyond financial losses. Inaccurate specifications of products can lead to product recalls, which incur additional costs and damage to brand reputation. Furthermore, the time spent on rectifying calibration errors can delay manufacturing schedules and negatively impact yield. With the increasing emphasis on quality and precision in various sectors, including manufacturing, oil and gas, and healthcare, the demand for field devices calibration services is expected to grow.
  • According to a report, the implementation of calibration services can lead to a 30% reduction in downtime and a 12% decrease in operational costs. These benefits underscore the importance of professional calibration services in maintaining industrial efficiency and ensuring regulatory compliance.

Field Devices Calibration Services Market Size

In-Depth Market Segmentation: Field Devices Calibration Services Market

The field devices calibration services industry research report provides comprehensive data (region-wise segment analysis), with forecasts and estimates in "USD million" for the period 2024-2028, as well as historical data from 2018-2022 for the following segments.

  • Type
    • Temperature and humidity calibration
    • Electrical calibration
    • Pressure calibration
    • Mechanical calibration
  • End-user
    • Process industries
    • Discrete industries
  • End-User
    • Healthcare
    • Automotive
    • Aerospace and Defense
    • Oil and Gas
    • Pharmaceuticals and Biotechnology
    • Semiconductors
    • Others
  • Calibration Method
    • Manual
    • Automated
  • Geography
    • North America
      • US
    • Europe
      • France
      • Germany
      • UK
    • APAC
      • China
    • Rest of World (ROW)

    By Type Insights

    The temperature and humidity calibration segment is estimated to witness significant growth during the forecast period.

    In the realm of industrial measurement, the market continues to evolve, addressing the critical need for precise and accurate calibration of temperature and humidity instruments. companies provide specialized services for handheld thermometers, thermocouples, RTDs, and temperature transmitters, ensuring measurement traceability and regulatory compliance. Calibration intervals adhere to industry best practices, with preventive maintenance and error mitigation strategies employed. Calibration workflows incorporate metrology techniques, such as diagnostic testing and data acquisition systems, to verify instrument accuracy and identify systematic and random errors.

    Calibration reports document the process, providing traceability standards and calibration certificates. Remote calibration and calibration software enable on-site calibration, minimizing downtime. Calibration management systems facilitate data logging and precision instrument maintenance, contributing to process validation and quality control checks. The calibration market's significance is underscored by the fact that temperature calibration ranges from -195 degrees C to 1000 degrees C, while humidity calibration covers 10%-98% humidity content.

    Field Devices Calibration Services Market Size

    Request Free Sample

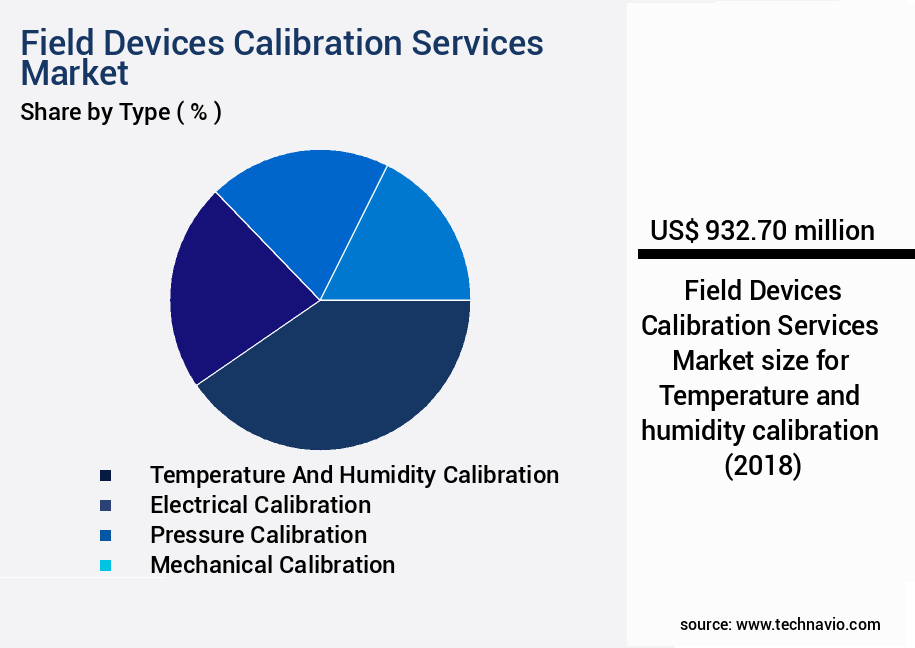
    The Temperature and humidity calibration segment was valued at USD 932.70 million in 2018 and showed a gradual increase during the forecast period.

    Field Devices Calibration Services Market Size

    Request Free Sample

    Regional Analysis

    North America is estimated to contribute 38% to the growth of the global market during the forecast period.Technavio’s analysts have elaborately explained the regional trends and drivers that shape the market during the forecast period.

    Field Devices Calibration Services Market Share by Geography

    See How Field Devices Calibration Services Market Demand is Rising in North America Request Free Sample

    In North America, the market is witnessing significant growth due to the increasing industrialization and economic development. Enterprises in this region are prioritizing scheduled instrumentation services to maintain the accuracy and safety of their operations, with a focus on calibration services. The US, as a leading country in oil and gas exploration and production (E and P), is driving market expansion. New E and P projects in the US and Canada are increasing the production of shale oil and gas, necessitating stringent adherence to regulatory compliance. To ensure operational efficiency and minimize risks associated with improper calibration, industries are investing in advanced calibration technologies and services.

    According to industry reports, the North American market for field devices calibration services is expected to grow at a robust pace, with key applications including oil and gas, pharmaceuticals, and food and beverage industries. The market's growth is attributed to the need for regulatory compliance, increased focus on operational efficiency, and the integration of smart technologies for predictive maintenance.

    Field Devices Calibration Services Market Share by Geography

     Customer Landscape of Field Devices Calibration Services Industry

    Competitive Intelligence by Technavio Analysis: Leading Players in the Field Devices Calibration Services Market

    Companies are implementing various strategies, such as strategic alliances, field devices calibration services market forecast, partnerships, mergers and acquisitions, geographical expansion, and product/service launches, to enhance their presence in the industry.

    ABB Ltd. - The company specializes in calibration services for field devices, employing techniques such as gravimetric, volumetric, and comparison methods for accurate flow measurement. These services ensure optimal performance and compliance with industry standards.

    The industry research and growth report includes detailed analyses of the competitive landscape of the market and information about key companies, including:

    • ABB Ltd.
    • Applied Industrial Technologies Inc.
    • Branom Instrument Co.
    • Danaher Corp.
    • Element Materials Technology Group Ltd.
    • Ellab AS
    • Endress Hauser Group Services AG
    • ENVEA
    • Fortive Corp.
    • General Electric Co.
    • Honeywell International Inc.
    • Keysight Technologies Inc.
    • PFREUNDT GmbH
    • Rockwell Automation Inc.
    • Rohde and Schwarz GmbH and Co. KG
    • Siemens AG
    • Thermo Fisher Scientific Inc.
    • Transcat Inc.
    • Trescal International SAS
    • Yokogawa Electric Corp.

    Qualitative and quantitative analysis of companies has been conducted to help clients understand the wider business environment as well as the strengths and weaknesses of key industry players. Data is qualitatively analyzed to categorize companies as pure play, category-focused, industry-focused, and diversified; it is quantitatively analyzed to categorize companies as dominant, leading, strong, tentative, and weak.

    Recent Development and News in Field Devices Calibration Services Market

    • In August 2024, ABB, a leading technology provider, announced the launch of its new On-site Calibration Service for process field devices, enhancing its offering in the calibration services market (ABB Press Release, 2024). This service enables customers to reduce downtime and improve operational efficiency by providing on-site calibration of critical field devices.
    • In November 2024, Emerson and Siemens signed a strategic collaboration agreement to expand their calibration services partnership, integrating Emerson's Rosemount calibration services with Siemens' calibration services (Emerson Press Release, 2024). This partnership aims to provide comprehensive calibration services to customers in the process industries, addressing the growing demand for reliable and efficient calibration solutions.
    • In March 2025, Honeywell announced the acquisition of CalibrationHQ, a leading provider of calibration management software, to strengthen its position in the market (Honeywell Press Release, 2025). The acquisition enables Honeywell to offer advanced calibration management software, improving customers' ability to manage their calibration programs more effectively.
    • In May 2025, Endress+Hauser received approval from the European Union for its new calibration laboratory in Germany, expanding its calibration services capacity and capabilities (Endress+Hauser Press Release, 2025). The new laboratory, equipped with state-of-the-art technology, allows Endress+Hauser to offer faster turnaround times and increased capacity to its European customers.

    Dive into Technavio’s robust research methodology, blending expert interviews, extensive data synthesis, and validated models for unparalleled Field Devices Calibration Services Market insights. See full methodology.

    Market Scope

    Report Coverage

    Details

    Page number

    183

    Base year

    2023

    Historic period

    2018-2022

    Forecast period

    2024-2028

    Growth momentum & CAGR

    Accelerate at a CAGR of 4.77%

    Market growth 2024-2028

    USD 689.4 million

    Market structure

    Fragmented

    YoY growth 2023-2024(%)

    4.47

    Key countries

    US, Germany, China, France, and UK

    Competitive landscape

    Leading Companies, Market Positioning of Companies, Competitive Strategies, and Industry Risks

    Request Free Sample

    Why Choose Technavio for Field Devices Calibration Services Market Insights?

    "Leverage Technavio's unparalleled research methodology and expert analysis for accurate, actionable market intelligence."

    The market is a critical component of industrial operations, ensuring the accuracy and reliability of crucial measurement instruments. Utilizing advanced calibration software for field devices is essential to reducing uncertainty and maintaining optimal performance. On-site calibration of industrial field devices is preferred for minimizing downtime and ensuring compliance with regulatory requirements. Calibration's impact on field device reliability is significant, with effective calibration management systems improving accuracy and preventing potential safety hazards. Implementing precision instrument calibration procedures results in cost savings through optimized calibration cycles, which can reduce the overall maintenance budget by up to 15% compared to reactive calibration methods. Adhering to field device calibration best practices and standards, such as ISO 17025 and NIST-traceable calibration, is vital for maintaining quality control and assurance in calibration services. Remote calibration for improved uptime and managing calibration data and documentation effectively are key trends in the market. Field device calibration technician training and preventative maintenance integration are crucial for ensuring a skilled workforce and minimizing unscheduled downtime. Advanced calibration techniques, such as predictive analytics for cycle optimization, further enhance operational efficiency and risk reduction. Compliance with regulatory requirements for field devices is a significant driver for the market's growth, with industries like pharmaceuticals, oil & gas, and power generation requiring stringent adherence to regulations. Specialized tooling for precise field device calibration ensures accurate results and minimizes the risk of calibration errors. In conclusion, the market offers substantial benefits for businesses, including improved accuracy, cost savings, regulatory compliance, and operational efficiency. Investing in effective calibration management systems and utilizing advanced calibration techniques can lead to significant improvements in supply chain efficiency and overall process performance.

    What are the Key Data Covered in this Field Devices Calibration Services Market Research and Growth Report?

    • What is the expected growth of the Field Devices Calibration Services Market between 2024 and 2028?

      • USD 689.4 million, at a CAGR of 4.77%

    • What segmentation does the market report cover?

      • The report is segmented by Type (Temperature and humidity calibration, Electrical calibration, Pressure calibration, and Mechanical calibration), End-user (Process industries and Discrete industries), Geography (North America, Europe, APAC, South America, and Middle East and Africa), End-User (Healthcare, Automotive, Aerospace and Defense, Oil and Gas, Pharmaceuticals and Biotechnology, Semiconductors, and Others), and Calibration Method (Manual and Automated)

    • Which regions are analyzed in the report?

      • North America, Europe, APAC, South America, and Middle East and Africa

    • What are the key growth drivers and market challenges?

      • Growing demand for calibration services to maximize production yield, Loss of industrial productivity during device calibration

    • Who are the major players in the Field Devices Calibration Services Market?

      • ABB Ltd., Applied Industrial Technologies Inc., Branom Instrument Co., Danaher Corp., Element Materials Technology Group Ltd., Ellab AS, Endress Hauser Group Services AG, ENVEA, Fortive Corp., General Electric Co., Honeywell International Inc., Keysight Technologies Inc., PFREUNDT GmbH, Rockwell Automation Inc., Rohde and Schwarz GmbH and Co. KG, Siemens AG, Thermo Fisher Scientific Inc., Transcat Inc., Trescal International SAS, and Yokogawa Electric Corp.

    We can help! Our analysts can customize this field devices calibration services market research report to meet your requirements.

    Get in touch

    1 Executive Summary

    • 1.1 Market overview
      • Executive Summary - Chart on Market Overview
      • Executive Summary - Data Table on Market Overview
      • Executive Summary - Chart on Global Market Characteristics
      • Executive Summary - Chart on Market by Geography
      • Executive Summary - Chart on Market Segmentation by Type
      • Executive Summary - Chart on Market Segmentation by End-user
      • Executive Summary - Chart on Incremental Growth
      • Executive Summary - Data Table on Incremental Growth
      • Executive Summary - Chart on Company Market Positioning

    2 Market Landscape

    • 2.1 Market ecosystem
      • Parent Market
      • Data Table on - Parent Market
    • 2.2 Market characteristics
      • Market characteristics analysis
    • 2.3 Value chain analysis
      • Value Chain Analysis

    3 Market Sizing

    • 3.1 Market definition
      • Offerings of companies included in the market definition
    • 3.2 Market segment analysis
      • Market segments
    • 3.3 Market size 2023
      • 3.4 Market outlook: Forecast for 2023-2028
        • Chart on Global - Market size and forecast 2023-2028 ($ million)
        • Data Table on Global - Market size and forecast 2023-2028 ($ million)
        • Chart on Global Market: Year-over-year growth 2023-2028 (%)
        • Data Table on Global Market: Year-over-year growth 2023-2028 (%)

      4 Historic Market Size

      • 4.1 Global Field Devices Calibration Services Market 2018 - 2022
        • Historic Market Size - Data Table on Global Field Devices Calibration Services Market 2018 - 2022 ($ million)
      • 4.2 Type segment analysis 2018 - 2022
        • Historic Market Size - Type Segment 2018 - 2022 ($ million)
      • 4.3 End-user segment analysis 2018 - 2022
        • Historic Market Size - End-user Segment 2018 - 2022 ($ million)
      • 4.4 Geography segment analysis 2018 - 2022
        • Historic Market Size - Geography Segment 2018 - 2022 ($ million)
      • 4.5 Country segment analysis 2018 - 2022
        • Historic Market Size - Country Segment 2018 - 2022 ($ million)

      5 Five Forces Analysis

      • 5.1 Five forces summary
        • Five forces analysis - Comparison between 2023 and 2028
      • 5.2 Bargaining power of buyers
        • Bargaining power of buyers - Impact of key factors 2023 and 2028
      • 5.3 Bargaining power of suppliers
        • Bargaining power of suppliers - Impact of key factors in 2023 and 2028
      • 5.4 Threat of new entrants
        • Threat of new entrants - Impact of key factors in 2023 and 2028
      • 5.5 Threat of substitutes
        • Threat of substitutes - Impact of key factors in 2023 and 2028
      • 5.6 Threat of rivalry
        • Threat of rivalry - Impact of key factors in 2023 and 2028
      • 5.7 Market condition
        • Chart on Market condition - Five forces 2023 and 2028

      6 Market Segmentation by Type

      • 6.1 Market segments
        • Chart on Type - Market share (2023-2028) (%)
        • Data Table on Type - Market share (2023-2028) (%)
      • 6.2 Comparison by Type
        • Chart on Comparison by Type
        • Data Table on Comparison by Type
      • 6.3 Temperature and humidity calibration - Market size and forecast (2023-2028)
        • Chart on Temperature and humidity calibration - Market size and forecast (2023-2028) ($ million)
        • Data Table on Temperature and humidity calibration - Market size and forecast (2023-2028) ($ million)
        • Chart on Temperature and humidity calibration - Year-over-year growth (2023-2028) (%)
        • Data Table on Temperature and humidity calibration - Year-over-year growth (2023-2028) (%)
      • 6.4 Electrical calibration - Market size and forecast (2023-2028)
        • Chart on Electrical calibration - Market size and forecast (2023-2028) ($ million)
        • Data Table on Electrical calibration - Market size and forecast (2023-2028) ($ million)
        • Chart on Electrical calibration - Year-over-year growth (2023-2028) (%)
        • Data Table on Electrical calibration - Year-over-year growth (2023-2028) (%)
      • 6.5 Pressure calibration - Market size and forecast (2023-2028)
        • Chart on Pressure calibration - Market size and forecast (2023-2028) ($ million)
        • Data Table on Pressure calibration - Market size and forecast (2023-2028) ($ million)
        • Chart on Pressure calibration - Year-over-year growth (2023-2028) (%)
        • Data Table on Pressure calibration - Year-over-year growth (2023-2028) (%)
      • 6.6 Mechanical calibration - Market size and forecast (2023-2028)
        • Chart on Mechanical calibration - Market size and forecast (2023-2028) ($ million)
        • Data Table on Mechanical calibration - Market size and forecast (2023-2028) ($ million)
        • Chart on Mechanical calibration - Year-over-year growth (2023-2028) (%)
        • Data Table on Mechanical calibration - Year-over-year growth (2023-2028) (%)
      • 6.7 Market opportunity by Type
        • Market opportunity by Type ($ million)
        • Data Table on Market opportunity by Type ($ million)

      7 Market Segmentation by End-user

      • 7.1 Market segments
        • Chart on End-user - Market share (2023-2028) (%)
        • Data Table on End-user - Market share (2023-2028) (%)
      • 7.2 Comparison by End-user
        • Chart on Comparison by End-user
        • Data Table on Comparison by End-user
      • 7.3 Process industries - Market size and forecast (2023-2028)
        • Chart on Process industries - Market size and forecast (2023-2028) ($ million)
        • Data Table on Process industries - Market size and forecast (2023-2028) ($ million)
        • Chart on Process industries - Year-over-year growth (2023-2028) (%)
        • Data Table on Process industries - Year-over-year growth (2023-2028) (%)
      • 7.4 Discrete industries - Market size and forecast (2023-2028)
        • Chart on Discrete industries - Market size and forecast (2023-2028) ($ million)
        • Data Table on Discrete industries - Market size and forecast (2023-2028) ($ million)
        • Chart on Discrete industries - Year-over-year growth (2023-2028) (%)
        • Data Table on Discrete industries - Year-over-year growth (2023-2028) (%)
      • 7.5 Market opportunity by End-user
        • Market opportunity by End-user ($ million)
        • Data Table on Market opportunity by End-user ($ million)

      8 Market Segmentation by End-User

      • 8.1 Market segments
        • Chart on End-User - Market share (2023-2028) (%)
        • Data Table on End-User - Market share (2023-2028) (%)
        • Market opportunity by End-User ($ million)
        • Data Table on Market opportunity by End-User ($ million)
      • 8.2 Comparison by End-User
        • Chart on Comparison by End-User
        • Data Table on Comparison by End-User
      • 8.3 Healthcare - Market size and forecast (2023-2028)
        • Chart on Healthcare - Market size and forecast (2023-2028) ($ million)
        • Data Table on Healthcare - Market size and forecast (2023-2028) ($ million)
        • Chart on Healthcare - Year-over-year growth (2023-2028) (%)
        • Data Table on Healthcare - Year-over-year growth (2023-2028) (%)
      • 8.4 Automotive - Market size and forecast (2023-2028)
        • Chart on Automotive - Market size and forecast (2023-2028) ($ million)
        • Data Table on Automotive - Market size and forecast (2023-2028) ($ million)
        • Chart on Automotive - Year-over-year growth (2023-2028) (%)
        • Data Table on Automotive - Year-over-year growth (2023-2028) (%)
      • 8.5 Aerospace and Defense - Market size and forecast (2023-2028)
        • Chart on Aerospace and Defense - Market size and forecast (2023-2028) ($ million)
        • Data Table on Aerospace and Defense - Market size and forecast (2023-2028) ($ million)
        • Chart on Aerospace and Defense - Year-over-year growth (2023-2028) (%)
        • Data Table on Aerospace and Defense - Year-over-year growth (2023-2028) (%)
      • 8.6 Oil and Gas - Market size and forecast (2023-2028)
        • Chart on Oil and Gas - Market size and forecast (2023-2028) ($ million)
        • Data Table on Oil and Gas - Market size and forecast (2023-2028) ($ million)
        • Chart on Oil and Gas - Year-over-year growth (2023-2028) (%)
        • Data Table on Oil and Gas - Year-over-year growth (2023-2028) (%)
      • 8.7 Pharmaceuticals and Biotechnology - Market size and forecast (2023-2028)
        • Chart on Pharmaceuticals and Biotechnology - Market size and forecast (2023-2028) ($ million)
        • Data Table on Pharmaceuticals and Biotechnology - Market size and forecast (2023-2028) ($ million)
        • Chart on Pharmaceuticals and Biotechnology - Year-over-year growth (2023-2028) (%)
        • Data Table on Pharmaceuticals and Biotechnology - Year-over-year growth (2023-2028) (%)
      • 8.8 Semiconductors - Market size and forecast (2023-2028)
        • Chart on Semiconductors - Market size and forecast (2023-2028) ($ million)
        • Data Table on Semiconductors - Market size and forecast (2023-2028) ($ million)
        • Chart on Semiconductors - Year-over-year growth (2023-2028) (%)
        • Data Table on Semiconductors - Year-over-year growth (2023-2028) (%)
      • 8.9 Others - Market size and forecast (2023-2028)
        • Chart on Others - Market size and forecast (2023-2028) ($ million)
        • Data Table on Others - Market size and forecast (2023-2028) ($ million)
        • Chart on Others - Year-over-year growth (2023-2028) (%)
        • Data Table on Others - Year-over-year growth (2023-2028) (%)

      9 Market Segmentation by Calibration Method

      • 9.1 Market segments
        • Chart on Calibration Method - Market share (2023-2028) (%)
        • Data Table on Calibration Method - Market share (2023-2028) (%)
      • 9.2 Comparison by Calibration Method
        • Chart on Comparison by Calibration Method
        • Data Table on Comparison by Calibration Method
      • 9.3 Manual - Market size and forecast (2023-2028)
        • Chart on Manual - Market size and forecast (2023-2028) ($ million)
        • Data Table on Manual - Market size and forecast (2023-2028) ($ million)
        • Chart on Manual - Year-over-year growth (2023-2028) (%)
        • Data Table on Manual - Year-over-year growth (2023-2028) (%)
      • 9.4 Automated - Market size and forecast (2023-2028)
        • Chart on Automated - Market size and forecast (2023-2028) ($ million)
        • Data Table on Automated - Market size and forecast (2023-2028) ($ million)
        • Chart on Automated - Year-over-year growth (2023-2028) (%)
        • Data Table on Automated - Year-over-year growth (2023-2028) (%)
      • 9.5 Market opportunity by Calibration Method
        • Market opportunity by Calibration Method ($ million)
        • Data Table on Market opportunity by Calibration Method ($ million)

      10 Customer Landscape

      • 10.1 Customer landscape overview
        • Analysis of price sensitivity, lifecycle, customer purchase basket, adoption rates, and purchase criteria

      11 Geographic Landscape

      • 11.1 Geographic segmentation
        • Chart on Market share by geography 2023-2028 (%)
        • Data Table on Market share by geography 2023-2028 (%)
      • 11.2 Geographic comparison
        • Chart on Geographic comparison
        • Data Table on Geographic comparison
      • 11.3 North America - Market size and forecast 2023-2028
        • Chart on North America - Market size and forecast 2023-2028 ($ million)
        • Data Table on North America - Market size and forecast 2023-2028 ($ million)
        • Chart on North America - Year-over-year growth 2023-2028 (%)
        • Data Table on North America - Year-over-year growth 2023-2028 (%)
      • 11.4 Europe - Market size and forecast 2023-2028
        • Chart on Europe - Market size and forecast 2023-2028 ($ million)
        • Data Table on Europe - Market size and forecast 2023-2028 ($ million)
        • Chart on Europe - Year-over-year growth 2023-2028 (%)
        • Data Table on Europe - Year-over-year growth 2023-2028 (%)
      • 11.5 APAC - Market size and forecast 2023-2028
        • Chart on APAC - Market size and forecast 2023-2028 ($ million)
        • Data Table on APAC - Market size and forecast 2023-2028 ($ million)
        • Chart on APAC - Year-over-year growth 2023-2028 (%)
        • Data Table on APAC - Year-over-year growth 2023-2028 (%)
      • 11.6 South America - Market size and forecast 2023-2028
        • Chart on South America - Market size and forecast 2023-2028 ($ million)
        • Data Table on South America - Market size and forecast 2023-2028 ($ million)
        • Chart on South America - Year-over-year growth 2023-2028 (%)
        • Data Table on South America - Year-over-year growth 2023-2028 (%)
      • 11.7 Middle East and Africa - Market size and forecast 2023-2028
        • Chart on Middle East and Africa - Market size and forecast 2023-2028 ($ million)
        • Data Table on Middle East and Africa - Market size and forecast 2023-2028 ($ million)
        • Chart on Middle East and Africa - Year-over-year growth 2023-2028 (%)
        • Data Table on Middle East and Africa - Year-over-year growth 2023-2028 (%)
      • 11.8 US - Market size and forecast 2023-2028
        • Chart on US - Market size and forecast 2023-2028 ($ million)
        • Data Table on US - Market size and forecast 2023-2028 ($ million)
        • Chart on US - Year-over-year growth 2023-2028 (%)
        • Data Table on US - Year-over-year growth 2023-2028 (%)
      • 11.9 China - Market size and forecast 2023-2028
        • Chart on China - Market size and forecast 2023-2028 ($ million)
        • Data Table on China - Market size and forecast 2023-2028 ($ million)
        • Chart on China - Year-over-year growth 2023-2028 (%)
        • Data Table on China - Year-over-year growth 2023-2028 (%)
      • 11.10 Germany - Market size and forecast 2023-2028
        • Chart on Germany - Market size and forecast 2023-2028 ($ million)
        • Data Table on Germany - Market size and forecast 2023-2028 ($ million)
        • Chart on Germany - Year-over-year growth 2023-2028 (%)
        • Data Table on Germany - Year-over-year growth 2023-2028 (%)
      • 11.11 France - Market size and forecast 2023-2028
        • Chart on France - Market size and forecast 2023-2028 ($ million)
        • Data Table on France - Market size and forecast 2023-2028 ($ million)
        • Chart on France - Year-over-year growth 2023-2028 (%)
        • Data Table on France - Year-over-year growth 2023-2028 (%)
      • 11.12 UK - Market size and forecast 2023-2028
        • Chart on UK - Market size and forecast 2023-2028 ($ million)
        • Data Table on UK - Market size and forecast 2023-2028 ($ million)
        • Chart on UK - Year-over-year growth 2023-2028 (%)
        • Data Table on UK - Year-over-year growth 2023-2028 (%)
      • 11.13 Market opportunity by geography
        • Market opportunity by geography ($ million)
        • Data Tables on Market opportunity by geography ($ million)
      • 11.14 Rest of World (ROW) - Market size and forecast (2023-2028)
        • Chart on Rest of World (ROW) - Market size and forecast (2023-2028) ($ million)
        • Data Table on Rest of World (ROW) - Market size and forecast (2023-2028) ($ million)
        • Chart on Rest of World (ROW) - Year-over-year growth (2023-2028) (%)
        • Data Table on Rest of World (ROW) - Year-over-year growth (2023-2028) (%)

      12 Drivers, Challenges, and Opportunity/Restraints

      • 12.1 Market drivers
        • 12.2 Market challenges
          • 12.3 Impact of drivers and challenges
            • Impact of drivers and challenges in 2023 and 2028
          • 12.4 Market opportunities/restraints

            13 Competitive Landscape

            • 13.1 Overview
              • 13.2 Competitive Landscape
                • Overview on criticality of inputs and factors of differentiation
              • 13.3 Landscape disruption
                • Overview on factors of disruption
              • 13.4 Industry risks
                • Impact of key risks on business

              14 Competitive Analysis

              • 14.1 Companies profiled
                • Companies covered
              • 14.2 Market positioning of companies
                • Matrix on companies position and classification
              • 14.3 ABB Ltd.
                • ABB Ltd. - Overview
                • ABB Ltd. - Business segments
                • ABB Ltd. - Key news
                • ABB Ltd. - Key offerings
                • ABB Ltd. - Segment focus
              • 14.4 Applied Industrial Technologies Inc.
                • Applied Industrial Technologies Inc. - Overview
                • Applied Industrial Technologies Inc. - Business segments
                • Applied Industrial Technologies Inc. - Key news
                • Applied Industrial Technologies Inc. - Key offerings
                • Applied Industrial Technologies Inc. - Segment focus
              • 14.5 Branom Instrument Co.
                • Branom Instrument Co. - Overview
                • Branom Instrument Co. - Product / Service
                • Branom Instrument Co. - Key offerings
              • 14.6 Danaher Corp.
                • Danaher Corp. - Overview
                • Danaher Corp. - Business segments
                • Danaher Corp. - Key news
                • Danaher Corp. - Key offerings
                • Danaher Corp. - Segment focus
              • 14.7 Element Materials Technology Group Ltd.
                • Element Materials Technology Group Ltd. - Overview
                • Element Materials Technology Group Ltd. - Product / Service
                • Element Materials Technology Group Ltd. - Key offerings
              • 14.8 Endress Hauser Group Services AG
                • Endress Hauser Group Services AG - Overview
                • Endress Hauser Group Services AG - Product / Service
                • Endress Hauser Group Services AG - Key news
                • Endress Hauser Group Services AG - Key offerings
              • 14.9 ENVEA
                • ENVEA - Overview
                • ENVEA - Product / Service
                • ENVEA - Key offerings
              • 14.10 Fortive Corp.
                • Fortive Corp. - Overview
                • Fortive Corp. - Business segments
                • Fortive Corp. - Key news
                • Fortive Corp. - Key offerings
                • Fortive Corp. - Segment focus
              • 14.11 General Electric Co.
                • General Electric Co. - Overview
                • General Electric Co. - Business segments
                • General Electric Co. - Key news
                • General Electric Co. - Key offerings
                • General Electric Co. - Segment focus
              • 14.12 Honeywell International Inc.
                • Honeywell International Inc. - Overview
                • Honeywell International Inc. - Business segments
                • Honeywell International Inc. - Key news
                • Honeywell International Inc. - Key offerings
                • Honeywell International Inc. - Segment focus
              • 14.13 Keysight Technologies Inc.
                • Keysight Technologies Inc. - Overview
                • Keysight Technologies Inc. - Business segments
                • Keysight Technologies Inc. - Key news
                • Keysight Technologies Inc. - Key offerings
                • Keysight Technologies Inc. - Segment focus
              • 14.14 PFREUNDT GmbH
                • PFREUNDT GmbH - Overview
                • PFREUNDT GmbH - Product / Service
                • PFREUNDT GmbH - Key offerings
              • 14.15 Rockwell Automation Inc.
                • Rockwell Automation Inc. - Overview
                • Rockwell Automation Inc. - Business segments
                • Rockwell Automation Inc. - Key news
                • Rockwell Automation Inc. - Key offerings
                • Rockwell Automation Inc. - Segment focus
              • 14.16 Rohde and Schwarz GmbH and Co. KG
                • Rohde and Schwarz GmbH and Co. KG - Overview
                • Rohde and Schwarz GmbH and Co. KG - Product / Service
                • Rohde and Schwarz GmbH and Co. KG - Key news
                • Rohde and Schwarz GmbH and Co. KG - Key offerings
              • 14.17 Siemens AG
                • Siemens AG - Overview
                • Siemens AG - Business segments
                • Siemens AG - Key news
                • Siemens AG - Key offerings
                • Siemens AG - Segment focus

              15 Appendix

              • 15.1 Scope of the report
                • 15.2 Inclusions and exclusions checklist
                  • Inclusions checklist
                  • Exclusions checklist
                • 15.3 Currency conversion rates for US$
                  • Currency conversion rates for US$
                • 15.4 Research methodology
                  • Research methodology
                • 15.5 Data procurement
                  • Information sources
                • 15.6 Data validation
                  • Data validation
                • 15.7 Validation techniques employed for market sizing
                  • Validation techniques employed for market sizing
                • 15.8 Data synthesis
                  • Data synthesis
                • 15.9 360 degree market analysis
                  • 360 degree market analysis
                • 15.10 List of abbreviations
                  • List of abbreviations

                Research Methodology

                Technavio presents a detailed picture of the market by way of study, synthesis, and summation of data from multiple sources. The analysts have presented the various facets of the market with a particular focus on identifying the key industry influencers. The data thus presented is comprehensive, reliable, and the result of extensive research, both primary and secondary.

                INFORMATION SOURCES

                Primary sources

                • Manufacturers and suppliers
                • Channel partners
                • Industry experts
                • Strategic decision makers

                Secondary sources

                • Industry journals and periodicals
                • Government data
                • Financial reports of key industry players
                • Historical data
                • Press releases

                DATA ANALYSIS

                Data Synthesis

                • Collation of data
                • Estimation of key figures
                • Analysis of derived insights

                Data Validation

                • Triangulation with data models
                • Reference against proprietary databases
                • Corroboration with industry experts

                REPORT WRITING

                Qualitative

                • Market drivers
                • Market challenges
                • Market trends
                • Five forces analysis

                Quantitative

                • Market size and forecast
                • Market segmentation
                • Geographical insights
                • Competitive landscape

                Interested in this report?

                Get your sample now to see our research methodology and insights!

                Download Now

                Frequently Asked Questions

                Field Devices Calibration Services market growth will increase by $ 689.4 mn during 2024-2028 .

                The Field Devices Calibration Services market is expected to grow at a CAGR of 4.77% during 2024-2028 .

                Field Devices Calibration Services market is segmented by Type( Temperature and humidity calibration, Electrical calibration, Pressure calibration, Mechanical calibration) End-user( Process industries, Discrete industries, Pressure calibration, Mechanical calibration)

                ABB Ltd., Applied Industrial Technologies Inc., Branom Instrument Co., Danaher Corp., Element Materials Technology Group Ltd., Ellab AS, Endress Hauser Group Services AG, ENVEA, Fortive Corp., General Electric Co., Honeywell International Inc., Keysight Technologies Inc., PFREUNDT GmbH, Rockwell Automation Inc., Rohde and Schwarz GmbH and Co. KG, Siemens AG, Thermo Fisher Scientific Inc., Transcat Inc., Trescal International SAS, Yokogawa Electric Corp. are a few of the key vendors in the Field Devices Calibration Services market.

                North America will register the highest growth rate of 38% among the other regions. Therefore, the Field Devices Calibration Services market in North America is expected to garner significant business opportunities for the vendors during the forecast period.

                US, Germany, China, France, UK

                • Growing demand for calibration services to maximize production yieldCalibration is a necessary process required for the safety of production and the product final quality. The continuous need for maintaining quality in terms of production in industries enforces the maintenance of a proper schedule for calibrating instruments. Industries need to adhere to many factors to maintain the benchmark quality set by accrediting bodies is the driving factor this market.
                • regulatory agencies is the driving factor this market.
                • quality programs is the driving factor this market.
                • and auditors. All these factors add up to a higher demand for calibration services on the factory floor. The implementation of these services will have a major impact on production in the industry.With technological advances in industries is the driving factor this market.
                • the science of measurement is becoming more demanding. The areas such as measurement uncertainties is the driving factor this market.
                • parametric data analysis is the driving factor this market.
                • and statistical process control are mainly attracting the calibration services market. In addition is the driving factor this market.
                • the calibration services also offer a major advantage in yielding the productivity of the industry and earning more profit for the organization. Calibration services performed at the correct time will have control over the industrial processes with minimum involvement of experts in management and engineering. Thus is the driving factor this market.
                • neglecting calibration can cause unscheduled production and machine downtime. It can also lead to product and process quality issues is the driving factor this market.
                • and product recall and rework may reduce the production yield. Thus is the driving factor this market.
                • effective and periodic calibration services are essential for enhancing industrial productivity is the driving factor this market.
                • thereby increasing the profit generated in operations and driving the growth of the market in focus during the forecast period. is the driving factor this market.

                The Field Devices Calibration Services market vendors should focus on grabbing business opportunities from the Temperature and humidity calibration segment as it accounted for the largest market share in the base year.