
Fixed Attenuators Market Size 2024-2028
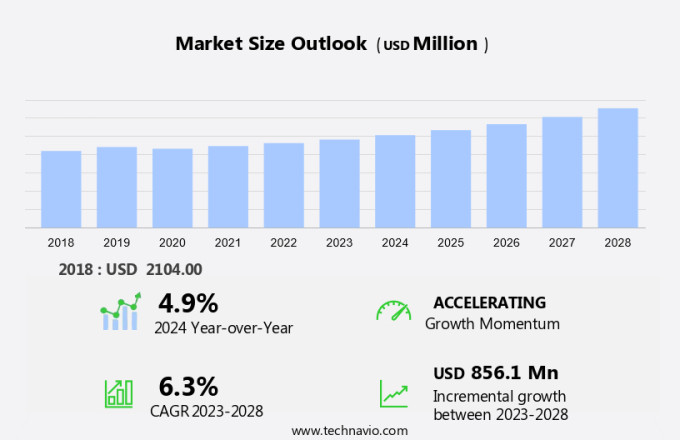
The fixed attenuators market size is forecast to increase by USD 856.1 million at a CAGR of 6.3% between 2023 and 2028.
- The market is experiencing significant growth due to the increasing demand for these components in high-frequency applications. Fixed attenuators are essential in various industries, including telecommunications, military, and aerospace, to manage and control signal levels. The market trends include the growing adoption of advanced technologies such as 5G technology and IoT, which require high-performance fixed attenuators. However, challenges such as potential overload, saturation, and damage to sensitive analog components remain key concerns. Manufacturers address these issues by offering a range of fixed attenuators with varying attenuation levels and frequency bands. For instance, RF-ATN-43MF-5W10 and RF-ATN-43MF-5W11 are popular options. Despite these challenges, the market is expected to continue its growth trajectory, driven by the increasing adoption of advanced communication technologies and the expanding use of wireless infrastructure.
What will be the Size of the Fixed Attenuators Market During the Forecast Period?
- The market encompasses the production and sale of attenuators, specifically fixed coaxial attenuators, for various applications In the military, communications, telecommunications, consumer electronics, and high-frequency electronic devices sectors. With the emergence of 5G technology, there is a growing demand for signal strength management and integrity in communication systems. Fixed attenuators play a crucial role in maintaining signal quality and preventing signal distortion. The defense budgets allocated towards modernizing military technology and space exploration continue to fuel market growth.
- Furthermore, the electronics sector's expansion in areas such as medical equipment, diagnostic equipment, and therapeutic equipment, also contributes to the market's growth. Both fixed and variable attenuators are essential components in managing and controlling signal levels in various applications.
How is this Fixed Attenuators Industry segmented and which is the largest segment?
The fixed attenuators industry research report provides comprehensive data (region-wise segment analysis), with forecasts and estimates in "USD million" for the period 2024-2028, as well as historical data from 2018-2022 for the following segments.
- Type
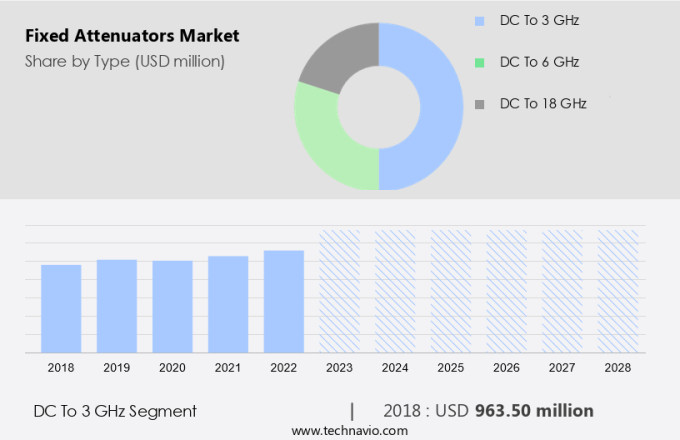
- DC to 3 GHz
- DC to 6 GHz
- DC to 18 GHz
- Application
- Telecommunication
- Test and measurement
- Geography
- APAC
- China
- India
- Japan
- South Korea
- North America
- Canada
- US
- Europe
- Germany
- UK
- France
- South America
- Middle East and Africa
- APAC
By Type Insights
- The DC to 3 GHz segment is estimated to witness significant growth during the forecast period.
The market, specifically In the DC to 3 GHz frequency range, is experiencing notable growth due to the increasing demand for precise and dependable RF systems. In February 2024, Infinite Electronics International, Inc. Launched RF fixed attenuators featuring 3.5 mm connectors, catering to the rigorous requirements of contemporary RF applications. These attenuators provide engineers with a broad attenuation range, extending from 0 dB to 30 dB, enabling fine-tuning of RF signal strength with exceptional precision. This extensive range ensures optimal performance across various applications, making it a valuable addition to RF systems.
Get a glance at the Fixed Attenuators Industry report of share of various segments Request Free Sample
The DC to 3 GHz segment was valued at USD 963.50 billion in 2018 and showed a gradual increase during the forecast period.
Regional Analysis
- APAC is estimated to contribute 40% to the growth of the global market during the forecast period.
Technavio's analysts have elaborately explained the regional trends and drivers that shape the market during the forecast period.

For more insights on the market share of various regions, Request Free Sample
The Asia-Pacific (APAC) region is experiencing significant growth In the market, driven by technological advancements and increasing demand across sectors such as military applications, communications, and telecommunications, as well as consumer electronics. Notable progress has been made in countries like China, Japan, South Korea, and India, with research teams from institutions like Tsinghua University and the Beijing Academy of Quantum Information Sciences leading the way. In April 2022, these teams developed advanced physical systems to enhance performance and reliability in communication networks, utilizing photonic time-bin states for monitoring and phase states for communication, resulting in systems that are strong against polarization and phase errors. This technological innovation is expected to further fuel the growth of the market in the APAC region.
Market Dynamics
Our fixed attenuators market researchers analyzed the data with 2023 as the base year, along with the key drivers, trends, and challenges. A holistic analysis of drivers will help companies refine their marketing strategies to gain a competitive advantage.
What are the key market drivers leading to the rise In the adoption of Fixed Attenuators Industry?
Growing demand for fixed attenuators in high-frequency applications is the key driver of the market.
- The global market for fixed attenuators is witnessing significant growth, fueled by the increasing demand for high-frequency electronic devices in various industries. In military applications, fixed attenuators play a crucial role in managing signal strength in communication systems, ensuring signal integrity in defense budget-funded projects. In the telecommunications sector, the adoption of 5G technology necessitates the use of high-performance fixed attenuators for signal control and management in communication networks. Consumer electronics, space exploration, medical equipment, and diagnostic equipment are other sectors that rely on fixed attenuators for signal management and level control solutions.
- Furthermore, fixed coaxial attenuators are particularly popular due to their ability to provide consistent attenuation levels, making them suitable for high-speed internet applications and industrial automation. Advanced electronics companies are developing waveguide fixed attenuators to cater to the stringent requirements of high-frequency applications. These attenuators come in various sizes, including WR-10, WR-12, WR-15, WR-19, WR-22, and WR-28, and offer attenuation levels ranging from 3 to 30 decibels. The availability of diverse options enables precise signal control across a wide range of applications, making fixed attenuators an essential component in high-frequency electronic systems.
What are the market trends shaping the Fixed Attenuators Industry?
The company offers a variety of fixed attenuators which include RF-ATN-43MF-5W10, RF-ATN-43MF-5W11, and others. is the upcoming market trend.
- The market is experiencing substantial growth, particularly In the field of high-frequency electronic devices. These components play a crucial role in communication systems, ensuring signal strength management and protecting against excessive power levels. Fixed Coaxial Attenuators are in high demand for applications in Military Communications, Telecommunications, Consumer Electronics, and Industrial Automation. Advancements in technology have led to the development of single-chip designs for Fixed Attenuators, which have replaced traditional resistor arrays. This innovation offers several benefits, including reduced board space, simplified installation, and enhanced system reliability. These attenuators cater to a wide range of frequencies, from DC to 20 GHz, making them suitable for both commercial and space applications.
- Moreover, the adoption of 5G Technology and High-Speed Internet has fueled the demand for advanced Signal Control Solutions. Fixed Attenuators are essential components in communication networks, ensuring Signal Integrity and managing Signal Levels effectively. The market for Fixed Attenuators is also expanding in sectors such as Medical Equipment, Diagnostic Equipment, and Therapeutic Equipment, where precise Signal Management is critical. Defense Budgets and Space Exploration are other significant areas where Fixed Attenuators play a vital role. These components ensure the reliable transmission of signals in harsh environments, making them indispensable for Defense Communications and Space Communication Systems.
- Overall, the market is witnessing significant growth due to its applications in various industries, including Telecommunications, Consumer Electronics, Industrial Automation, and Medical Equipment. The introduction of single-chip designs and the increasing demand for advanced Signal Control Solutions are driving the market's growth. Additionally, the market's expansion into Defense and Space applications further highlights its importance in critical communication systems.
What challenges does the Fixed Attenuators Industry face during its growth?
Issues of overload, saturation, and potential damage to sensitive analog components when using fixed attenuators are key challenges affecting the industry growth.
- The global market for fixed attenuators is witnessing considerable growth due to the increasing demand for signal strength management in various industries, including military applications, communications, telecommunications, consumer electronics, and industrial automation. High-frequency electronic devices, such as those used in 5G technology and advanced electronics, require precise signal control to ensure signal integrity and maintain optimal signal levels. Fixed coaxial attenuators play a crucial role in this regard, providing stable and consistent attenuation levels. Military applications, communication systems, and defense budgets continue to drive the demand for fixed attenuators In the US market. These components are essential for managing signal strength in military communication networks, radar systems, and other defense applications.
- In addition, the growing need for high-speed internet and space exploration projects further boosts the market's growth. Medical equipment, diagnostic equipment, and therapeutic equipment also utilize fixed attenuators to manage signal levels and maintain signal integrity. Fixed attenuators are essential in communication networks, including satellite communication networks, to ensure reliable signal transmission. However, the market faces challenges related to the risks of overload and potential damage to sensitive analog components. Signals can exhibit a wide dynamic range, often spanning 30 to 40 dB, and in some cases, exceeding 100 dB. This variability is common in applications such as radar, long-range wireless communication, and even short-range local area networks (LANs).
- Furthermore, to address these challenges, signal control solutions, such as variable attenuators, are gaining popularity In the market. In summary, The market is expected to grow significantly due to the increasing demand for signal strength management in various industries, including military applications, communications, telecommunications, consumer electronics, and industrial automation. Fixed attenuators are essential components in managing signal levels and maintaining signal integrity in high-frequency electronic devices, communication networks, and other applications. However, the market faces challenges related to the risks of overload and potential damage to sensitive analog components, necessitating the development of advanced signal control solutions.
Exclusive Customer Landscape
The fixed attenuators market forecasting report includes the adoption lifecycle of the market, covering from the innovator's stage to the laggard's stage. It focuses on adoption rates in different regions based on penetration. Furthermore, the fixed attenuators market report also includes key purchase criteria and drivers of price sensitivity to help companies evaluate and develop their market growth analysis strategies.

Customer Landscape
Key Companies & Market Insights
Companies are implementing various strategies, such as strategic alliances, fixed attenuators market forecast, partnerships, mergers and acquisitions, geographical expansion, and product/service launches, to enhance their presence In the industry. The industry research and growth report includes detailed analyses of the competitive landscape of the market and information about key companies, including:
- Amphenol Corp.
- Analog Devices Inc.
- Bird
- Eravant
- HUBER SUHNER AG
- HYPERLABS INC.
- Infinite Electronics International, Inc.
- JFW Industries Inc
- MECA Electronics Inc
- Narda MITEQ
- Qorvo Inc.
- RF Industries Ltd.
- RF Lambda
- Roho Connector Ltd
- Scientific Components Corp
- Smiths Interconnect Group Ltd
- Spectrum Control Ltd
- SPINNER GmbH
- TTM Technologies Inc.
- Valtir LLC
Qualitative and quantitative analysis of companies has been conducted to help clients understand the wider business environment as well as the strengths and weaknesses of key industry players. Data is qualitatively analyzed to categorize companies as pure play, category-focused, industry-focused, and diversified; it is quantitatively analyzed to categorize companies as dominant, leading, strong, tentative, and weak.
Research Analyst Overview
Fixed attenuators are essential components in various industries that require signal strength management and integrity. These devices play a crucial role in communication systems, high-frequency electronic devices, and advanced electronics. They are instrumental in maintaining optimal signal levels and ensuring reliable signal control. Communication systems, including telecommunications and military applications, heavily rely on fixed attenuators. In military applications, these components are essential for secure and effective communication between various military units and bases. They help maintain signal integrity and ensure that communication signals are not disrupted or weakened, which is critical for mission success. In the telecommunications sector, fixed attenuators are used to manage signal levels in communication networks. They help maintain optimal signal strength and prevent signal degradation, ensuring reliable and high-quality communication services for consumers and businesses. High-frequency electronic devices, such as radar systems and satellite communication equipment, also utilize fixed attenuators. These components help manage signal levels and maintain signal integrity in high-frequency applications, ensuring accurate and reliable data transmission.
Furthermore, the demand for fixed attenuators is also growing in other industries, including consumer electronics, medical equipment, and industrial automation. In consumer electronics, fixed attenuators are used in high-speed internet applications to manage signal levels and ensure reliable connectivity. In medical equipment, they are used in diagnostic and therapeutic equipment to maintain signal integrity and ensure accurate data transmission. In industrial automation, they are used to manage signal levels in communication networks and control systems. The market for fixed attenuators is driven by several factors, including the increasing demand for reliable communication systems, the growing adoption of advanced electronics, and the need for signal control solutions in various industries. The market is also expected to grow due to the increasing use of 5G technology and the expanding defense budgets for military applications. Space exploration is another area where fixed attenuators are gaining popularity. These components are used in satellite communication systems to manage signal levels and ensure reliable data transmission between Earth and spacecraft.
Thus, they are also used in radio astronomy applications to manage signal levels and reduce interference. In summary, fixed attenuators are essential components in various industries that require signal strength management and integrity. They are used in communication systems, high-frequency electronic devices, and advanced electronics to maintain optimal signal levels and ensure reliable signal control. The market for fixed attenuators is expected to grow due to the increasing demand for reliable communication systems, the growing adoption of advanced electronics, and the need for signal control solutions in various industries.
|
Fixed Attenuators Market Scope |
|
|
Report Coverage |
Details |
|
Page number |
203 |
|
Base year |
2023 |
|
Historic period |
2018-2022 |
|
Forecast period |
2024-2028 |
|
Growth momentum & CAGR |
Accelerate at a CAGR of 6.3% |
|
Market growth 2024-2028 |
USD 856.1 million |
|
Market structure |
Fragmented |
|
YoY growth 2023-2024(%) |
4.9 |
|
Key countries |
US, China, Japan, India, UK, South Korea, Canada, Germany, Australia, and France |
|
Competitive landscape |
Leading Companies, Market Positioning of Companies, Competitive Strategies, and Industry Risks |
What are the Key Data Covered in this Fixed Attenuators Market Research and Growth Report?
- CAGR of the Fixed Attenuators industry during the forecast period
- Detailed information on factors that will drive the Fixed Attenuators growth and forecasting between 2024 and 2028
- Precise estimation of the size of the market and its contribution of the industry in focus to the parent market
- Accurate predictions about upcoming growth and trends and changes in consumer behaviour
- Growth of the market across APAC, North America, Europe, South America, and Middle East and Africa
- Thorough analysis of the market's competitive landscape and detailed information about companies
- Comprehensive analysis of factors that will challenge the fixed attenuators market growth of industry companies
We can help! Our analysts can customize this fixed attenuators market research report to meet your requirements.