Flavored Yogurt Market Size 2024-2028
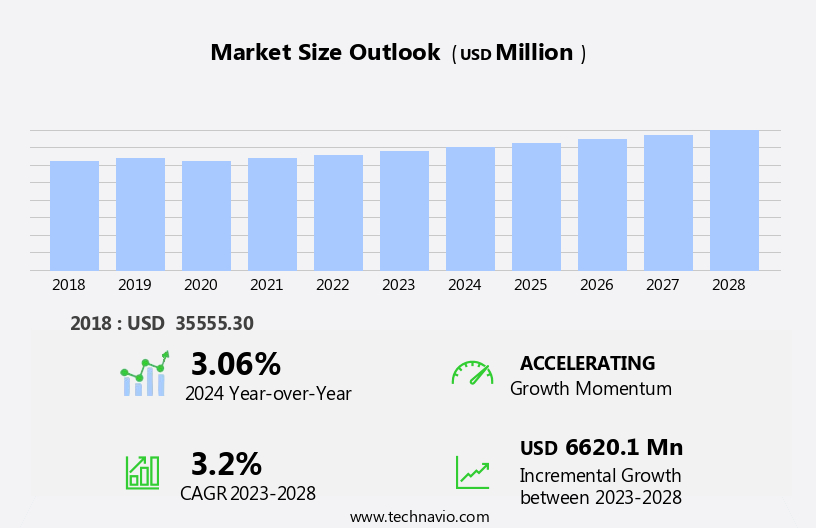
The flavored yogurt market size is forecast to increase by USD 6.62 billion, at a CAGR of 3.2% between 2023 and 2028.
- The market is experiencing significant shifts driven by two key trends. First, the increasing online penetration of flavored yogurt sales signifies a growing consumer preference for convenience and the ability to shop from anywhere at any time. This trend is expected to continue as e-commerce platforms expand and improve, offering competitive pricing and a wide range of options. Second, the plant-based product trend is gaining considerable traction in the market. As more consumers express concerns about animal welfare and health, the demand for dairy-free alternatives is surging. This shift presents both opportunities and challenges for market players.
- While there is potential for growth in the plant-based segment, companies must navigate the complexities of formulation, sourcing, and marketing to meet consumer expectations and stay competitive. Additionally, the market faces challenges related to increasing lactose intolerance among consumers. This condition, which affects an estimated 65% of the global population, can limit the reach of traditional dairy-based flavored yogurt products. To capitalize on this trend, companies must invest in research and development to create lactose-free or low-lactose offerings that cater to this growing consumer base. By addressing these trends and challenges, market players can position themselves for success in the evolving flavored yogurt landscape.
What will be the Size of the Flavored Yogurt Market during the forecast period?
Explore in-depth regional segment analysis with market size data - historical 2018-2022 and forecasts 2024-2028 - in the full report.
Request Free Sample
The market continues to evolve, driven by consumer preferences for innovative and health-conscious options. Ingredient interactions play a crucial role in achieving desired textures, with thickening agents such as fruit purees and stabilizer systems ensuring viscosity control and shelf life extension. Acidity regulation and fat content variation are key considerations for maintaining flavor stability and consumer appeal. Cold chain management is essential for preserving the sensory qualities of flavored yogurt, with pasteurization methods and filling technologies optimized to minimize temperature fluctuations. Probiotic cultures and bacterial strains are integral to the yogurt-making process, requiring careful handling and microbial safety measures. Texture analysis and rheological properties are critical in understanding the behavior of flavored yogurt under various storage conditions.
Process optimization and cost optimization are ongoing priorities, with thermal processing and packaging materials chosen to minimize production costs while maintaining quality control metrics. Sweeteners, lactose reduction methods, and sugar reduction strategies are continually evolving to meet consumer demands for reduced sugar content. Flavor masking and ingredient sourcing are essential for creating unique and authentic flavors. Protein fortification and dairy cultures contribute to the nutritional value and taste profile of flavored yogurt. Sensory evaluation plays a vital role in assessing the quality and consumer appeal of flavored yogurt, with continuous research and development focused on improving taste, texture, and aroma. The ongoing dynamism of the market ensures a constant need for innovation and adaptation to meet evolving consumer preferences and market demands.
How is this Flavored Yogurt Industry segmented?
The flavored yogurt industry research report provides comprehensive data (region-wise segment analysis), with forecasts and estimates in "USD million" for the period 2024-2028, as well as historical data from 2018-2022 for the following segments.
- Form Factor
- Spoonable
- Drinkable
- Distribution Channel
- Offline
- Online
- Flavor
- Fruit (Strawberry, Mango, Blueberry)
- Vanilla
- Chocolate
- Others
- Type
- Dairy-Based
- Plant-Based
- Geography
- North America
- US
- Canada
- Mexico
- Europe
- France
- Germany
- UK
- Middle East and Africa
- UAE
- APAC
- China
- India
- Indonesia
- Japan
- Malaysia
- South Korea
- Thailand
- South America
- Brazil
- Rest of World (ROW)
- North America
By Form Factor Insights
The spoonable segment is estimated to witness significant growth during the forecast period.
In the dynamic the market of 2023, spoonable yogurt holds a significant share. This preference is driven by consumers seeking health benefits and convenience. Spoonable yogurt's versatility sets it apart from other types, such as drinkable or squeezable, enabling consumers to enjoy it traditionally or use it in cooking and baking. Probiotics, a key component of spoonable yogurt, are beneficial bacteria that maintain gut health. Ingredient interactions play a crucial role in achieving the desired texture and viscosity. Thickening agents, like pectin or gelatin, are used to control viscosity and enhance the overall eating experience. Fruit purees add natural sweetness and flavor, while acidity regulation ensures a balanced taste.
Storage conditions and shelf life extension are essential considerations. Cold chain management and proper pasteurization methods ensure product safety and prolong shelf life. Stabilizer systems maintain texture stability and prevent separation. Process optimization and thermal processing ensure consistent product quality. Packaging materials are chosen based on their ability to preserve texture and flavor. Microbial safety is ensured through bacterial strains selection and quality control metrics. Protein fortification enhances nutritional value. Flavor masking techniques are used to maintain the desired taste profile. Ingredient sourcing and dairy cultures are carefully selected to ensure product authenticity. Sugar reduction methods, such as using natural sweeteners or stevia, cater to health-conscious consumers.
Rheological properties are analyzed to optimize production processes and improve product consistency. Cost optimization is achieved through efficient manufacturing processes and ingredient sourcing strategies. Flavor compounds are carefully selected to enhance the overall taste experience. Lactose reduction techniques cater to lactose intolerant consumers. Distribution logistics and sensory evaluation are crucial for market success. Probiotic cultures are carefully handled to maintain their viability during transportation and storage. Sensory evaluation ensures the product meets consumer preferences and expectations. Sweeteners types, such as sugar, honey, or artificial sweeteners, are chosen based on consumer preferences and cost considerations.
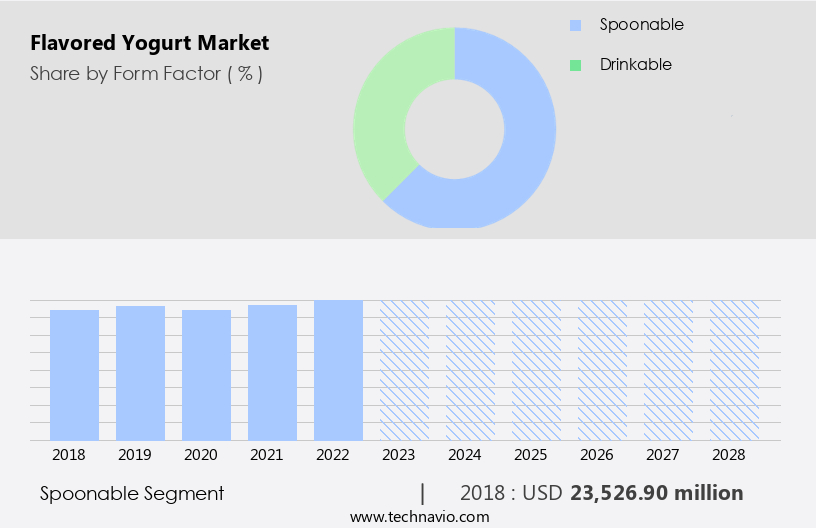
The Spoonable segment was valued at USD 23.53 billion in 2018 and showed a gradual increase during the forecast period.
Regional Analysis
APAC is estimated to contribute 34% to the growth of the global market during the forecast period.Technavio's analysts have elaborately explained the regional trends and drivers that shape the market during the forecast period.
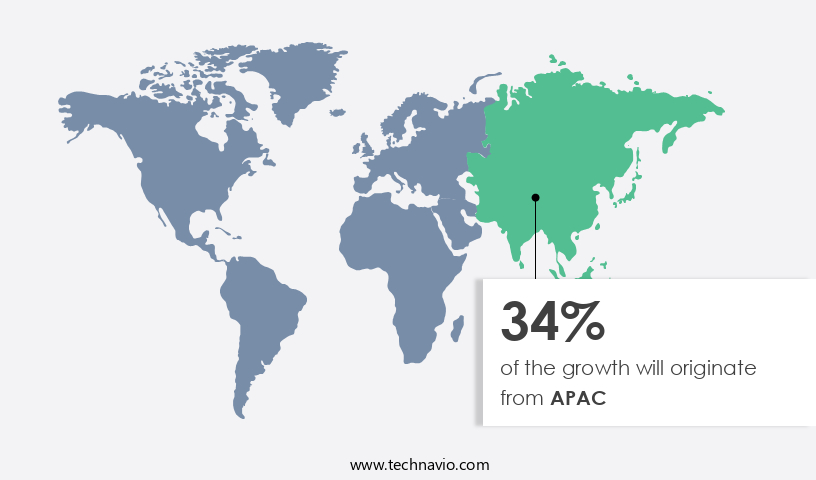
The market is witnessing significant growth, with APAC leading the charge. Consumers in this region are increasingly prioritizing health and wellness, driving demand for flavored yogurt due to its nutritional benefits. Fruit purees, thickening agents, and acidity regulation are essential components in producing these products, ensuring the desired texture and taste. In APAC, the market is propelled by the rising demand for fortified food and beverages, the increasing number of organized retail outlets, and innovative product launches. companies are collaborating to improve offerings and expand their customer base. Ingredient interactions play a crucial role in maintaining the desired rheological properties, texture, and flavor stability.
Thickening agents, such as pectin and gelatin, are used to control viscosity. Probiotic cultures, like Lactobacillus and Bifidobacterium, are added for their health benefits and to extend shelf life. Pasteurization methods, such as high-temperature short-time (HTST) and ultra-high temperature (UHT), are employed for microbial safety and product preservation. Sugar reduction methods, including natural sweeteners like stevia and erythritol, are gaining popularity to cater to health-conscious consumers. Cold chain management is essential to maintain product quality and texture, while stabilizer systems ensure flavor masking and protection against separation. Process optimization and thermal processing are crucial for cost optimization and enhancing product consistency.
Packaging materials, such as PET, PP, and glass, are chosen based on their ability to maintain product quality, shelf life, and consumer appeal. Quality control metrics, including protein fortification and microbial safety, are essential for ensuring product safety and meeting consumer expectations. Sensory evaluation and sweeteners types, including sugar, honey, and artificial sweeteners, contribute to the overall taste and consumer experience. Distribution logistics and transportation are critical factors in delivering flavored yogurt to consumers efficiently and cost-effectively. The market is expected to continue evolving, with ongoing research and development in areas such as lactose reduction, dairy cultures, and probiotic strains.
Market Dynamics
Our researchers analyzed the data with 2023 as the base year, along with the key drivers, trends, and challenges. A holistic analysis of drivers will help companies refine their marketing strategies to gain a competitive advantage.
B2B yogurt supply solutions utilize probiotic fermentation technologies for health benefits. Flavored yogurt opportunities 2024 include low-sugar yogurt for retail and plant-based yogurt options, addressing dietary trends. Yogurt supply chain tools enhance distribution, while flavored yogurt competitive insights feature brands like Chobani. Sustainable yogurt production aligns with eco-friendly dairy trends. Yogurt regulatory standards 2024-2028 guide yogurt demand in North America 2024. Premium flavored yogurt products and yogurt market forecasts boost growth. Yogurt for health food stores and custom yogurt flavors target niches. Flavored yogurt barriers and strategies tackle shelf life, with yogurt sourcing innovations and yogurt cost optimization improving profitability. Yogurt market intelligence and functional food advancements fuel expansion.
What are the key market drivers leading to the rise in the adoption of Flavored Yogurt Industry?
- The significant expansion of online sales channels is the primary catalyst for market growth, as an increasing number of consumers turn to the convenience and accessibility of purchasing products online.
- The market is experiencing significant growth due in part to the increasing consumer preference for convenient purchasing options. With the rise of online shopping, flavored yogurt sales through digital channels have surged. Consumers value the ease of access and added benefits such as same-day delivery and promotions that online stores provide, which are not typically available in physical retail outlets. Manufacturers are responding to this trend by expanding their online presence, selling their products through their own websites, e-commerce platforms, and third-party sites.
- Ingredient interactions, thickening agents, fruit purees, acidity regulation, fat content variation, viscosity control, and sugar reduction methods are key factors influencing the development of flavored yogurt products. Producers are continually innovating to cater to evolving consumer demands, ensuring their offerings remain competitive in this dynamic market.
What are the market trends shaping the Flavored Yogurt Industry?
- The plant-based product market is experiencing significant growth, emerging as the latest trend in consumer preferences. This increasing trend signifies a shift towards sustainable and ethical food choices.
- Plant-based yogurt is gaining popularity among health-conscious consumers as a viable alternative to dairy-based products. This shift is driven by the growing awareness of the environmental impact of animal agriculture and the increasing number of individuals with lactose intolerance, dairy allergies, or following vegan or vegetarian diets. Plant-based yogurt, made from ingredients such as soy, almonds, or coconut, offers a lower environmental footprint and is often lower in saturated fat, calories, and cholesterol. It can also be a good source of fiber and protein. To cater to the diverse consumer preferences, plant-based yogurt comes in a wide range of flavors and textures.
- Shelf life extension and texture modification are crucial aspects of producing plant-based yogurt. Cold chain management and pasteurization methods are employed to ensure the stability of flavors and probiotic cultures. Stabilizer systems are used to maintain the desired texture, while filling technologies ensure uniformity and consistency. Texture analysis is conducted to ensure the final product meets the desired sensory properties. Plant-based yogurt manufacturers prioritize cold chain management and pasteurization methods to maintain the quality and safety of their products. By using advanced technologies and techniques, they can extend the shelf life and improve the texture and flavor stability of their offerings.
- This focus on innovation and quality is essential in a market where consumers demand high-quality, convenient, and healthy food options.
What challenges does the Flavored Yogurt Industry face during its growth?
- The lactose intolerance prevalence among consumers poses a significant challenge to the industry's growth trajectory.
- The market dynamics are influenced by various factors, including the increasing prevalence of lactose intolerance and dairy allergies. Lactose intolerance is a condition that affects the ability to digest lactose, a sugar found in milk and dairy products. Symptoms include abdominal bloating, cramps, diarrhea, and pain. Awareness campaigns and initiatives by companies have brought attention to this issue, leading consumers to seek alternatives to traditional dairy products. Process optimization and thermal processing are crucial in the production of flavored yogurt to ensure desirable rheological properties. The use of high-quality packaging materials is essential to maintain product freshness and extend shelf life.
- Bacterial strains and dairy cultures play a significant role in the fermentation process, which impacts the taste and texture of flavored yogurt. Flavor masking is a critical aspect of formulation development to cater to consumers with lactose intolerance or dairy allergies. Ingredient sourcing and quality control metrics are essential to ensure the purity and safety of ingredients used in the production of flavored yogurt. The market for flavored yogurt is expected to grow as consumers seek healthier and more convenient food options, with a focus on natural and organic ingredients.
Exclusive Customer Landscape
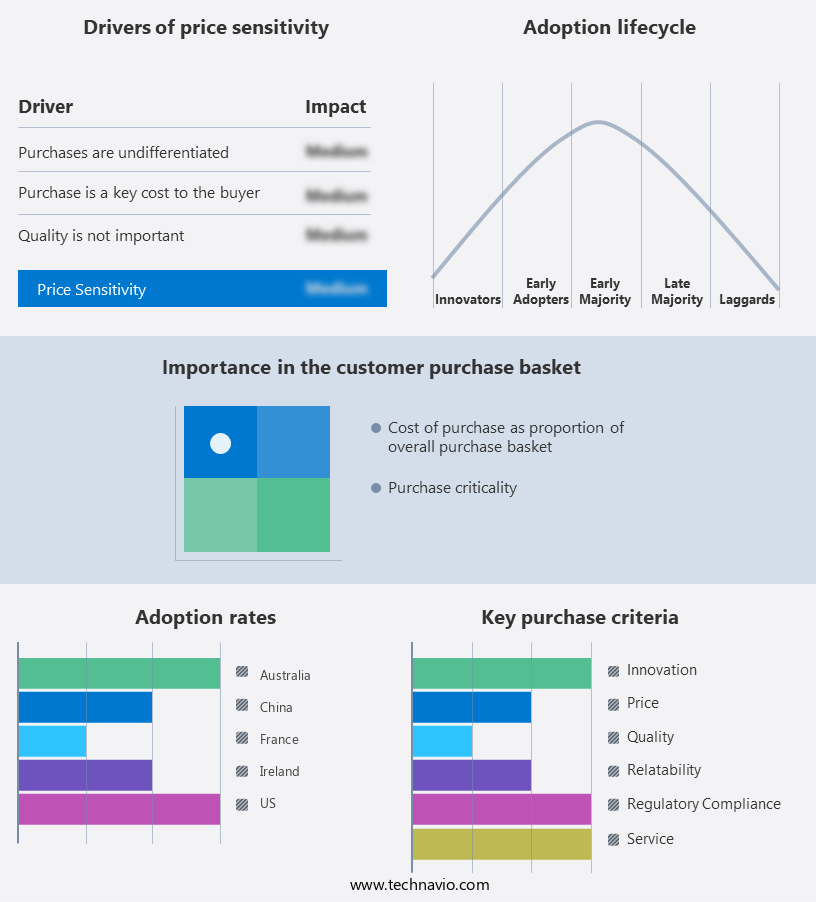
The flavored yogurt market forecasting report includes the adoption lifecycle of the market, covering from the innovator's stage to the laggard's stage. It focuses on adoption rates in different regions based on penetration. Furthermore, the flavored yogurt market report also includes key purchase criteria and drivers of price sensitivity to help companies evaluate and develop their market growth analysis strategies.
Customer Landscape
Key Companies & Market Insights
Companies are implementing various strategies, such as strategic alliances, flavored yogurt market forecast, partnerships, mergers and acquisitions, geographical expansion, and product/service launches, to enhance their presence in the industry.
Arla Foods amba - This research highlights the health benefits of a company's coconut-flavored yogurt, which contributes to blood pressure reduction through its unique formulation. The yogurt's natural ingredients promote cardiovascular health, making it an attractive option for consumers seeking to maintain optimal heart health.
The industry research and growth report includes detailed analyses of the competitive landscape of the market and information about key companies, including:
- Arla Foods amba
- Cabot Creamery
- Chobani Global Holdings LLC
- Chr Hansen Holding AS
- Danone SA
- Emmi Group
- Fage International SA
- Fonterra Cooperative Group Ltd.
- General Mills Inc.
- Gujarat Cooperative Milk Marketing Federation Ltd.
- LACTALIS Group
- Lausanne Dairies
- Menchies Group Inc.
- Mother Dairy Fruit and Vegetable Pvt. Ltd.
- Muller UK and Ireland Group LLP
- Nestle SA
- Noosa yoghurt
- Sameer Agriculture and Livestock Ltd.
- Stonyfield Farm Inc.
- The Coca Cola Co.
Qualitative and quantitative analysis of companies has been conducted to help clients understand the wider business environment as well as the strengths and weaknesses of key industry players. Data is qualitatively analyzed to categorize companies as pure play, category-focused, industry-focused, and diversified; it is quantitatively analyzed to categorize companies as dominant, leading, strong, tentative, and weak.
Recent Development and News in Flavored Yogurt Market
- In January 2024, Danone, a leading player in the market, launched a new product line, "Danone Light & Fit Keto," catering to the growing demand for low-carb and keto-friendly food options. According to Danone's press release, the new product line would be available in various flavors, including vanilla, strawberry, and blueberry.
- In March 2024, Chobani, another significant player, announced a strategic partnership with Starbucks to produce and distribute yogurt parfaits for Starbucks stores. As per Chobani's press release, this collaboration would help Chobani expand its reach and strengthen its position in the foodservice sector.
- In May 2024, General Mills, a major player in the market, completed the acquisition of Yoplait's European business from PepsiCo. According to General Mills' SEC filing, the acquisition was valued at â¬1.3 billion and would help General Mills strengthen its presence in Europe, making it the leading yogurt manufacturer in the region.
- In April 2025, Siggi's, a niche player in the market, received regulatory approval from the US Food and Drug Administration (FDA) for its new plant-based yogurt, Siggi's Dairy-Free. As per Siggi's press release, this approval marked a significant milestone for the company, allowing it to tap into the growing plant-based food market and cater to consumers with dietary restrictions.
Research Analyst Overview
- The market experiences dynamic activity, with a focus on meeting the evolving preferences of the target consumer. Production capacity expansion is a key trend, driven by the demand for diverse new flavor profiles. Fruit preparation techniques are refined to enhance sensory attributes and reduce waste. Food safety standards and probiotic benefits remain top priorities, necessitating rigorous microbial control and shelf-life testing. Ingredient labeling transparency and nutritional value are essential for consumer trust. Energy consumption and process efficiency are under scrutiny, with automation technologies and ingredient cost optimization strategies gaining traction.
- Regulatory compliance and ingredient traceability are crucial for maintaining quality parameters. Sustainability practices and packaging design innovations contribute to the industry's ongoing evolution. Flavor delivery systems continue to advance, ensuring consistent taste and texture profiling.
Dive into Technavio's robust research methodology, blending expert interviews, extensive data synthesis, and validated models for unparalleled Flavored Yogurt Market insights. See full methodology.
|
Market Scope |
|
|
Report Coverage |
Details |
|
Page number |
158 |
|
Base year |
2023 |
|
Historic period |
2018-2022 |
|
Forecast period |
2024-2028 |
|
Growth momentum & CAGR |
Accelerate at a CAGR of 3.2% |
|
Market growth 2024-2028 |
USD 6620.1 million |
|
Market structure |
Fragmented |
|
YoY growth 2023-2024(%) |
3.06 |
|
Key countries |
US, Malaysia, Indonesia, Germany, UK, South Korea, France, Canada, Brazil, Thailand, UAE, Mexico, China, Japan, and India |
|
Competitive landscape |
Leading Companies, Market Positioning of Companies, Competitive Strategies, and Industry Risks |
What are the Key Data Covered in this Flavored Yogurt Market Research and Growth Report?
- CAGR of the Flavored Yogurt industry during the forecast period
- Detailed information on factors that will drive the growth and forecasting between 2024 and 2028
- Precise estimation of the size of the market and its contribution of the industry in focus to the parent market
- Accurate predictions about upcoming growth and trends and changes in consumer behaviour
- Growth of the market across APAC, Europe, North America, South America, and Middle East and Africa
- Thorough analysis of the market's competitive landscape and detailed information about companies
- Comprehensive analysis of factors that will challenge the flavored yogurt market growth of industry companies
We can help! Our analysts can customize this flavored yogurt market research report to meet your requirements.
 RIA -
RIA - 
