
Food Intolerance Products Market Size 2024-2028
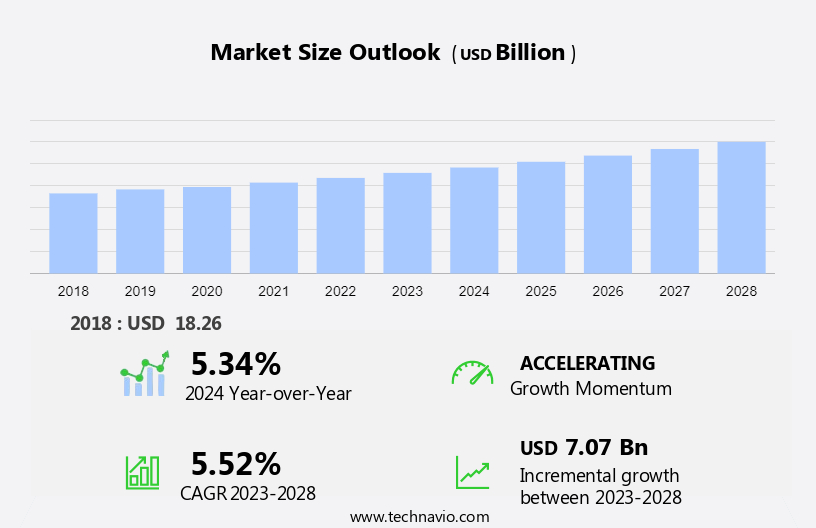
The food intolerance products market size is forecast to increase by USD 7.07 billion at a CAGR of 5.52% between 2023 and 2028. The market is witnessing significant growth due to the rising prevalence of chronic conditions such as migraines, sore throats, and irritable bowel syndrome. The increasing urbanization and changing consumer lifestyles are contributing to the market's expansion. Food manufacturers are responding to this trend by introducing new product offerings and promotional activities. Technological advancements in food processing are enabling the production of high-quality food intolerance products, despite their higher price points. The geriatric population's growing numbers, with their increased susceptibility to food intolerances, further fuel market growth. Effective packaging solutions are also crucial in ensuring the longevity and safety of these sensitive products.
The food intolerance products market is expanding rapidly, driven by the growing gluten-free product trend and increasing prevalence of celiac disease diagnoses. As awareness of food allergies in adults rises, consumers are actively seeking gluten-free (GF) foods that cater to their dietary needs. This demand has led to the development of a variety of gluten-free products, prominently featured on food labels to ensure transparency. Color additives are also being scrutinized, as consumers prioritize natural ingredients. According to German Trade & Invest, the market is responding to these shifts by offering innovative food and beverage products that accommodate individuals with conditions like Crohn's disease and indigestion. With a focus on health and wellness, the gluten-free diet is becoming a mainstream choice for many.
Market Segmentation
The market research report provides comprehensive data (region-wise segment analysis), with forecasts and estimates in "USD billion" for the period 2024-2028, as well as historical data from 2018-2022 for the following segments.
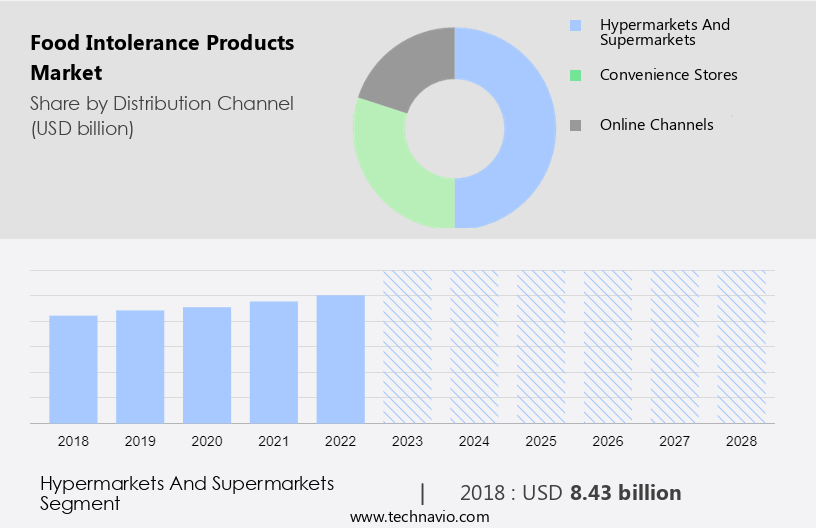
- Distribution Channel
- Hypermarkets and supermarkets
- Convenience stores
- Online channels
- Product
- Lactose-free food
- Gluten-free food
- Diabetic food
- Others
- Geography
- North America
- US
- Europe
- Germany
- Italy
- Spain
- APAC
- China
- South America
- Middle East and Africa
- North America
By Distribution Channel Insights
The hypermarkets and supermarkets segment is estimated to witness significant growth during the forecast period. The market caters to various dietary requirements, such as lactose intolerance, celiac disease, and gluten allergies, among others. Supermarkets and hypermarkets hold a substantial position in this market, providing an extensive array of options for consumers. These retailers are dedicated to meeting the increasing demand for vegan diet and allergen-free products, including gluten-free and dairy-free alternatives. By stocking a diverse selection of food intolerance products, supermarkets and hypermarkets ensure their accessibility and affordability to consumers. For instance, prominent retailers like Walmart and Kroger have designated sections for these specialized items, making it convenient for shoppers to locate suitable options. This strategic approach not only simplifies the shopping experience but also fosters the normalization of food intolerant products within mainstream retail spaces.
Get a glance at the market share of various segments Request Free Sample
The hypermarkets and supermarkets segment accounted for USD 8.43 billion in 2018 and showed a gradual increase during the forecast period.
Regional Insights
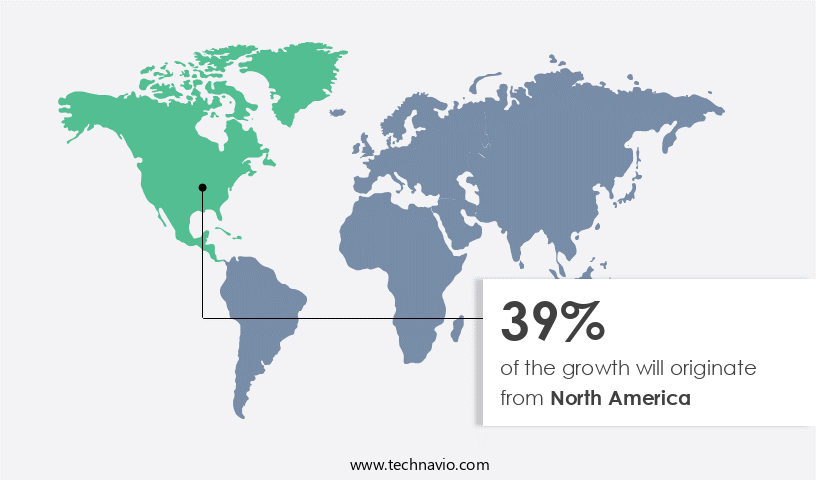
North America is estimated to contribute 39% to the growth of the global market during the forecast period. Technavio's analysts have elaborately explained the regional trends and drivers that shape the market during the forecast period.
For more insights on the market share of various regions Request Free Sample
In 2023, North America held the largest share of The market. This region is projected to experience significant growth during the forecast period due to several factors. The increasing prevalence and incidences of celiac disease are among the primary reasons for this growth. The US, Mexico, and Canada are major contributors to this trend within the region. Celiac disease, which can lead to medical issues like diabetes, Down syndrome, and infertility, has prompted various institutions to raise awareness about this condition. The market in North America is segmented into confectionery products, meat and seafood, sauces, condiments, and dressings.
Gluten-free and lactose-free food products dominate the market due to the high prevalence of food intolerances in the region. Labeling type analysis reveals that certified gluten-free and lactose-free labels are preferred by consumers. As a result, food manufacturers are increasingly focusing on producing food intolerance products with these labels to cater to the growing demand. In conclusion, the North American market is experiencing significant growth due to the increasing incidence of celiac disease and the rising demand for certified gluten-free and lactose-free food products. The market is segmented into various categories, with confectionery products, meat and seafood, sauces, condiments, and dressings being the major segments. The availability of these products in restaurants and cafes is also contributing to the market's growth.
Our researchers analyzed the data with 2023 as the base year, along with the key drivers, trends, and challenges. A holistic analysis of drivers will help companies refine their marketing strategies to gain a competitive advantage.
Market Driver
The increasing geriatric population and chronic diseases is the key driver of the market. The prevalence of chronic diseases, including cancer and type 2 diabetes, continues to rise in the US, with unhealthy dietary habits and sedentary lifestyles being significant contributing factors. According to the World Health Organization (WHO), cancer was responsible for nearly 10 million deaths worldwide in 2020, making it a leading cause of death. Chronic diseases are expected to remain a significant health concern, particularly for the geriatric population. Food intolerance products offer a solution for individuals with chronic diseases or inflammatory conditions, such as celiac disease, non-celiac gluten sensitivity, or lactose intolerance. These conditions can exacerbate symptoms, including bloating, abdominal pain, and diarrhea.
Moreover, autoimmune disorders, including inflammatory diseases, are also on the rise, making the demand for food intolerance products increasingly important. Food intolerances can trigger allergic reactions, leading to inflammation and other health issues. By avoiding the offending allergens, individuals can reduce inflammation and improve their overall health and well-being. The market is expected to grow significantly due to the increasing prevalence of chronic diseases and the need for healthy dietary options. The lactose-free food segment is expected to dominate the market due to the high prevalence of lactose intolerance. Overall, food intolerance products offer a valuable solution for individuals seeking to manage their chronic conditions and maintain a healthy lifestyle.
Market Trends
Technological advancements in food processing is the upcoming trend in the market. The market has been significantly influenced by advancements in food processing technology. These innovations have led to the creation of ready meals and other products tailored to individuals with food intolerances, addressing nutritional deficits and aiding in gut recovery. Sales channels for these products have expanded, with online sales channels gaining popularity.
Further, technological advancements, such as the development of novel extraction methods for plant-based ingredients, have allowed manufacturers to efficiently produce alternatives like oat milk, almond flour, and pea protein, catering to the increasing demand for dairy and gluten substitutes. Food trends, particularly those focused on health and wellness, have further fueled market growth. Manufacturers continue to invest in research and development to meet the evolving needs of consumers with food intolerances.
Market Challenge
The high price of gluten-free food products is a key challenge affecting the market growth. The market in the United States is in its growth phase, albeit smaller than the market for food products containing gluten. The production process of gluten-free food items is intricate, leading to higher manufacturing costs. Primary ingredients such as rice and corn, used instead of wheat in gluten-free food, are pricier than wheat. Other expenses incurred during the manufacturing of gluten-free food include certifications, exclusive transportation to prevent cross-contamination, specialized supply chains, and logistics. Consequently, the cost of producing gluten-free food is greater than that of food containing gluten, which is reflected in the higher selling prices. Food manufacturers in the US are increasingly focusing on catering to the growing consumer base with food intolerances, particularly those suffering from conditions like migraines, sore throats, and irritable bowel syndrome. Moreover, urbanization and changing consumer preferences have fueled the demand for food intolerance products.
Exclusive Customer Landscape
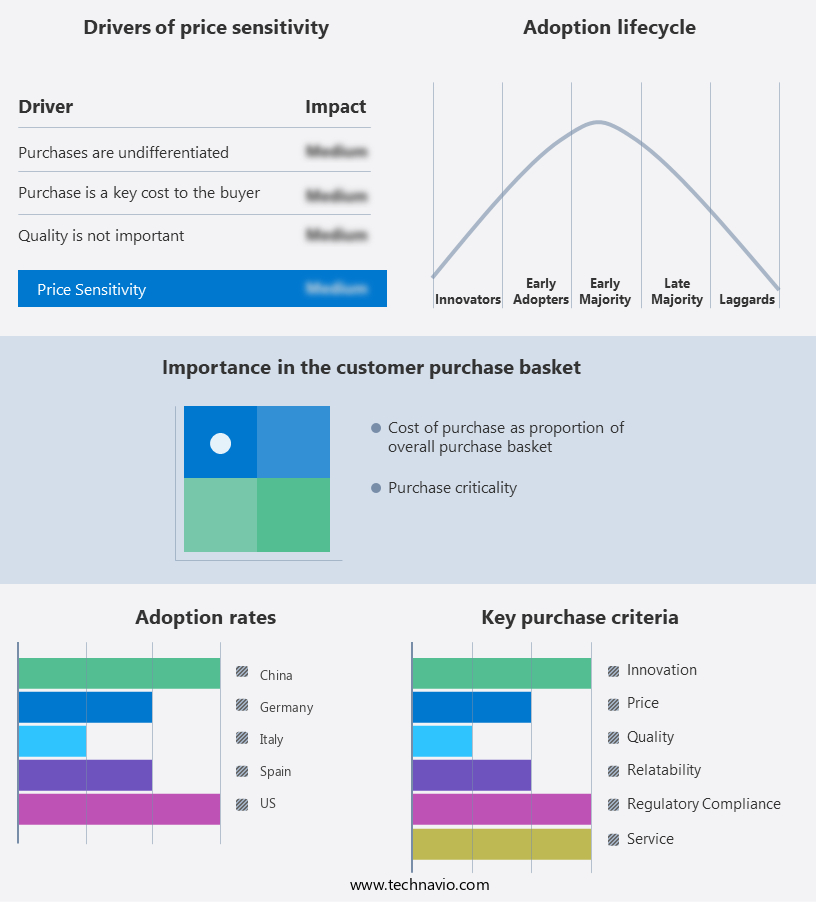
The market forecasting report includes the adoption lifecycle of the market, covering from the innovator's stage to the laggard's stage. It focuses on adoption rates in different regions based on penetration. Furthermore, the report also includes key purchase criteria and drivers of price sensitivity to help companies evaluate and develop their market growth analysis strategies.
Customer Landscape
Key Companies & Market Insights
Companies are implementing various strategies, such as strategic alliances, partnerships, mergers and acquisitions, geographical expansion, and product/service launches, to enhance their presence in the market.
Campbell Soup Co: The company offers food intolerance products such as Gluten Free Cream of Chicken Soup and Gluten Free Cream of Mushroom Soup.
The market research and growth report includes detailed analyses of the competitive landscape of the market and information about key companies, including:
- Arla Foods amba
- Arva Flour Mills
- Beyond Meat Inc.
- Bobs Red Mill Natural Foods Inc.
- Chobani Global Holdings LLC
- Conagra Brands Inc.
- Danone SA
- Dr. Schar AG Spa
- General Mills Inc.
- Glanbia plc
- Gruma SAB de CV
- Impossible Foods Inc.
- Kellogg Co.
- Lantmannen ekonomisk forening
- McCain Foods Ltd.
- Mondelez International Inc.
- Nestle SA
- Oatside
- Organic Valley
- Otsuka Holdings Co. Ltd.
- Paulig Ltd.
- Rhythm Superfoods LLC
- Simple Mills
- The Kraft Heinz Co.
- Valio Oy
Qualitative and quantitative analysis of companies has been conducted to help clients understand the wider business environment as well as the strengths and weaknesses of key market players. Data is qualitatively analyzed to categorize companies as pure play, category-focused, industry-focused, and diversified; it is quantitatively analyzed to categorize companies as dominant, leading, strong, tentative, and weak.
Research Analyst Overview
The market is witnessing significant growth due to the rising prevalence of conditions such as lactose intolerance and celiac disease. According to recent studies, an estimated 65% of the global population may have lactose intolerance, while celiac disease affects approximately 1% of the population. Gluten-free (GF) and lactose-free products have gained immense popularity in the clean-label category, with GF foods being the most sought-after. Transparency in labeling is crucial for consumers with food allergies or intolerances. Gluten-free food and lactose-free food segments are witnessing high demand due to the increasing number of diagnoses for celiac disease, gluten intolerance, and non-celiac gluten sensitivity. These conditions can lead to various symptoms such as bloating, migraines, sore throats, and irritable bowel syndrome. Food manufacturers are focusing on producing GF and lactose-free products to cater to this growing demand.
Additionally, the trend towards GF diets is not limited to those with celiac disease but also includes individuals following a vegan diet or those seeking to reduce calorie intake. The market for GF and lactome-free products includes various categories such as confectionery, meat and seafood, sauces, condiments, dressings, and ready meals. Government laws and promotional activities are driving the growth of the market. Packaging solutions and urbanization are also contributing factors. However, cross-contamination and the presence of allergens in these products remain concerns. The market is expected to witness further growth due to the increasing awareness of inflammatory diseases and autoimmune disorders. The market analysis includes a meta-analysis of various studies and sales channels, including online sales channels. Production costs and specialty ingredients are other critical factors influencing the market.
|
Market Scope |
|
|
Report Coverage |
Details |
|
Page number |
182 |
|
Base year |
2023 |
|
Historic period |
2018-2022 |
|
Forecast period |
2024-2028 |
|
Growth momentum & CAGR |
Accelerate at a CAGR of 5.52% |
|
Market Growth 2024-2028 |
USD 7.07 billion |
|
Market structure |
Fragmented |
|
YoY growth 2023-2024(%) |
5.34 |
|
Regional analysis |
North America, Europe, APAC, South America, and Middle East and Africa |
|
Performing market contribution |
North America at 39% |
|
Key countries |
US, China, Germany, Italy, and Spain |
|
Competitive landscape |
Leading Companies, Market Positioning of Companies, Competitive Strategies, and Industry Risks |
|
Key companies profiled |
Arla Foods amba, Arva Flour Mills, Beyond Meat Inc., Bobs Red Mill Natural Foods Inc., Campbell Soup Co., Chobani Global Holdings LLC, Conagra Brands Inc., Danone SA, Dr. Schar AG Spa, General Mills Inc., Glanbia plc, Gruma SAB de CV, Impossible Foods Inc., Kellogg Co., Lantmannen ekonomisk forening, McCain Foods Ltd., Mondelez International Inc., Nestle SA, Oatside, Organic Valley, Otsuka Holdings Co. Ltd., Paulig Ltd., Rhythm Superfoods LLC, Simple Mills, The Kraft Heinz Co., and Valio Oy |
|
Market dynamics |
Parent market analysis, market growth inducers and obstacles, market forecast, fast-growing and slow-growing segment analysis, COVID-19 impact and recovery analysis and future consumer dynamics, market condition analysis for the forecast period |
|
Customization purview |
If our market report has not included the data that you are looking for, you can reach out to our analysts and get segments customized. |
What are the Key Data Covered in this Market Research and Growth Report?
- CAGR of the market during the forecast period
- Detailed information on factors that will drive the market growth and forecasting between 2024 and 2028
- Precise estimation of the size of the market and its contribution of the market in focus to the parent market
- Accurate predictions about upcoming market growth and trends and changes in consumer behaviour
- Growth of the market across North America, Europe, APAC, South America, and Middle East and Africa
- Thorough analysis of the market's competitive landscape and detailed information about companies
- Comprehensive analysis of factors that will challenge the growth of market companies
We can help! Our analysts can customize this market research report to meet your requirements. Get in touch
 RIA -
RIA - 
