Food Service Equipment Market Analysis, Size, and Forecast 2026-2030: APAC (China, India, and Japan), North America (US, Canada, and Mexico), Europe (Germany, UK, and France), South America (Brazil, Argentina, and Colombia), Middle East and Africa (Saudi Arabia, UAE, and South Africa), and Rest of World (ROW)

Food Service Equipment Market Analysis, Size, and Forecast 2026-2030:
APAC (China, India, and Japan), North America (US, Canada, and Mexico), Europe (Germany, UK, and France), South America (Brazil, Argentina, and Colombia), Middle East and Africa (Saudi Arabia, UAE, and South Africa), and Rest of World (ROW)

Published: Mar 2026 306 Pages SKU: IRTNTR75857

Market Overview at a Glance

$14.05 B
Market Opportunity
6.1%
CAGR 2025 - 2030
43.1%
APAC Growth
$27.56 B
Offline segment 2024

Food Service Equipment Market Size 2026-2030

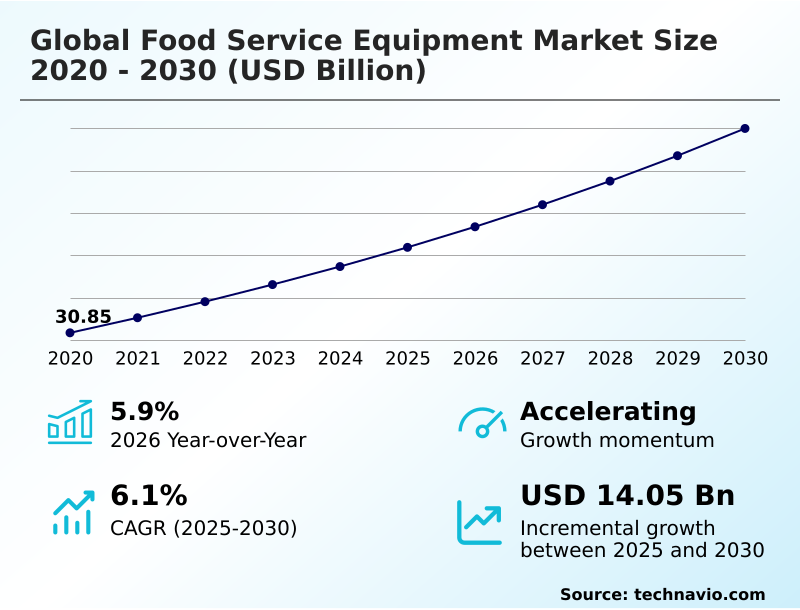
The food service equipment market size is valued to increase by USD 14.05 billion, at a CAGR of 6.1% from 2025 to 2030. Technological integration and proliferation of kitchen automation will drive the food service equipment market.

Major Market Trends & Insights

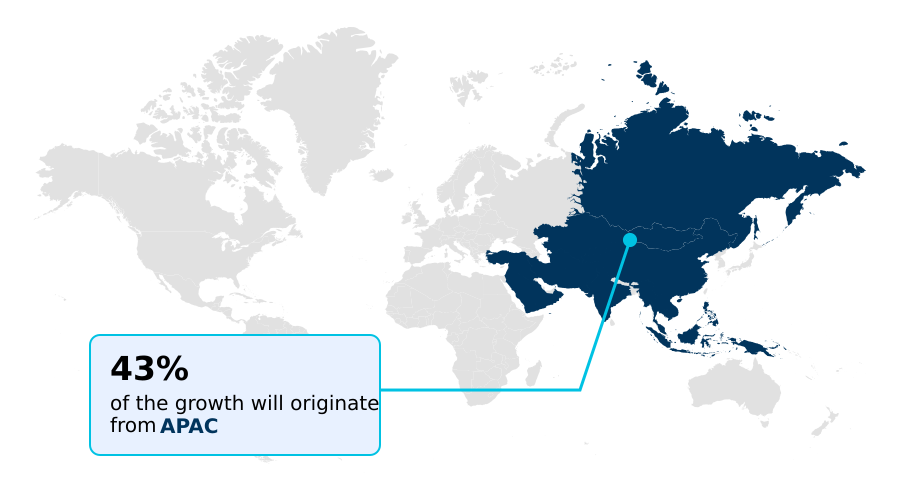
  • APAC dominated the market and accounted for a 43.1% growth during the forecast period.
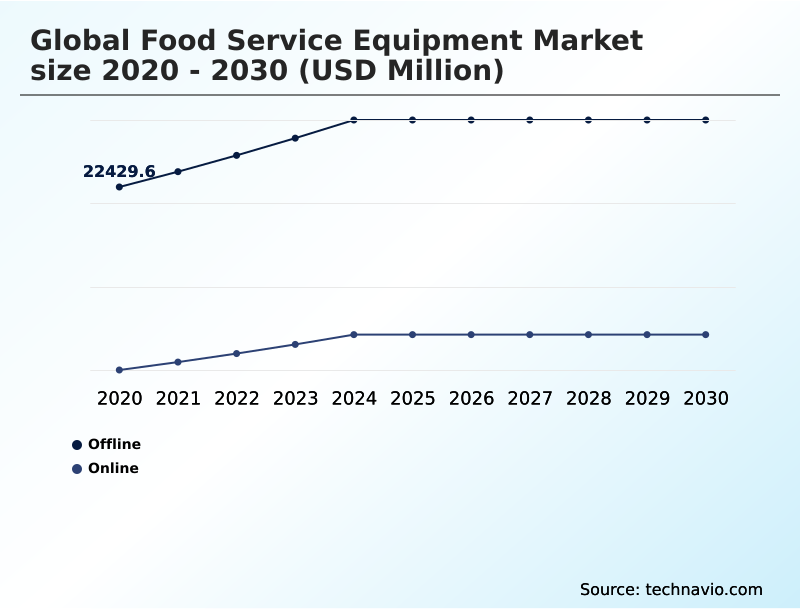
  • By Distribution Channel - Offline segment was valued at USD 27.56 billion in 2024
  • By Product - Cooking and preparation equipment segment accounted for the largest market revenue share in 2024

Market Size & Forecast

  • Market Opportunities: USD 24.15 billion
  • Market Future Opportunities: USD 14.05 billion
  • CAGR from 2025 to 2030 : 6.1%

Market Summary

  • The Food Service Equipment Market is undergoing a significant transformation, shaped by the convergence of operational efficiency demands and technological innovation. Key drivers include the pressing need for kitchen automation to address labor shortages and the adoption of sustainable kitchen infrastructure to meet stringent environmental regulations and reduce long-term utility costs.
  • The rise of off-premise dining solutions has spurred demand for specialized ghost kitchen equipment and modular cooking suites that optimize space in urban environments.
  • For instance, a large-scale catering company can leverage an integrated kitchen operating system to synchronize its blast chillers and combi-ovens, ensuring food safety standards are met across a distributed network of satellite kitchens while improving energy load balancing. This data-driven kitchen management enhances culinary production and reduces waste.
  • However, the industry faces challenges from supply chain fragility, where shortages of key components like semiconductor modules can halt production, and the high capital outlay required for advanced culinary hardware. The technical skill gaps among staff to operate and maintain these complex systems also present a significant hurdle to widespread adoption.
  • Successfully navigating these dynamics requires strategic investment in both technology and training to unlock the full potential of the modern commercial kitchen.

What will be the Size of the Food Service Equipment Market during the forecast period?

Get Key Insights on Market Forecast (PDF) Request Free Sample

How is the Food Service Equipment Market Segmented?

The food service equipment industry research report provides comprehensive data (region-wise segment analysis), with forecasts and estimates in "USD million" for the period 2026-2030, as well as historical data from 2020-2024 for the following segments.

  • Distribution channel
    • Offline
    • Online
  • Product
    • Cooking and preparation equipment
    • Refrigeration equipment
    • Ware washing equipment
    • Storage and handling equipment
    • Others
  • End-user
    • Full-service restaurants and hotels
    • Quick-service restaurants
    • Institutional
    • Others
  • Geography
    • APAC
      • China
      • India
      • Japan
    • North America
      • US
      • Canada
      • Mexico
    • Europe
      • Germany
      • UK
      • France
    • South America
      • Brazil
      • Argentina
      • Colombia
    • Middle East and Africa
      • Saudi Arabia
      • UAE
      • South Africa
    • Rest of World (ROW)

By Distribution Channel Insights

The offline segment is estimated to witness significant growth during the forecast period.

The offline distribution channel remains fundamental to the Global Food Service Equipment Market 2026-2030, particularly for operators making investments involving high capital outlay.

This channel provides essential hands-on evaluation of culinary hardware, allowing buyers to assess the build quality of high-grade stainless steel equipment and witness demonstrations of thermal processing in combi-ovens and conveyor ovens.

Distributors offer critical consultation for complex installations, such as ware washing systems or steam-jacketed kettles for high-volume food preparation, which improves procurement accuracy and reduces costly post-purchase modifications by over 25%.

The physical presence of showrooms facilitates trust and supports the logistical complexities of delivering heavy machinery.

This segment's value is reinforced by indispensable after-sales support and maintenance, which are vital for ensuring the longevity of advanced equipment and upholding hygiene and safety standards.

Request Free Sample

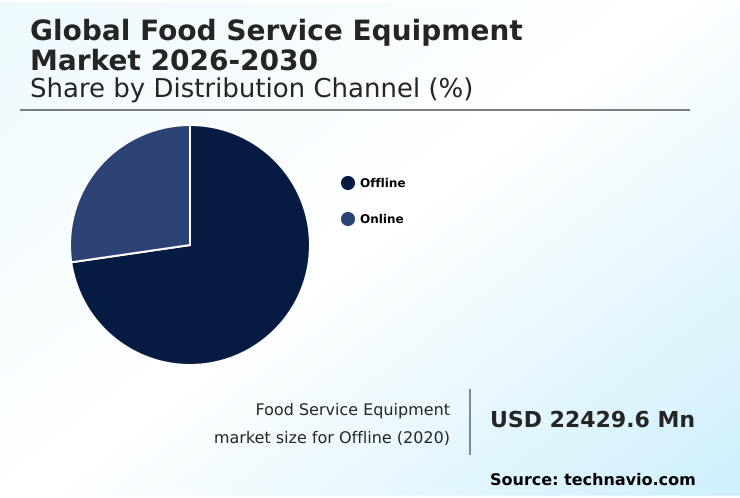
The Offline segment was valued at USD 27.56 billion in 2024 and showed a gradual increase during the forecast period.

Request Free Sample

Regional Analysis

APAC is estimated to contribute 43.1% to the growth of the global market during the forecast period.Technavio’s analysts have elaborately explained the regional trends and drivers that shape the market during the forecast period.

See How Food Service Equipment Market Demand is Rising in APAC Request Free Sample

The market's geographic landscape is diverse, with North America and Europe leading in the adoption of advanced automation to counter high labor costs. In these regions, the deployment of robotic cooking systems and automated dishwashing units is common.

Data-driven kitchen management platforms, which utilize predictive maintenance algorithms, have improved operational uptime by 15%.

APAC is the fastest-growing region, contributing over 43% of the incremental growth, fueled by urbanization and the expansion of delivery-centric business models in countries like China and India.

The demand here is for high-speed ovens and induction ranges that support high-volume production.

South America and the Middle East and Africa are modernizing their hospitality infrastructure, creating opportunities for equipment featuring advanced thermal engineering and refrigeration cycles that use natural refrigerants.

Across all regions, remote diagnostics are becoming essential for servicing equipment in both dense urban centers and remote resort locations.

Market Dynamics

Our researchers analyzed the data with 2025 as the base year, along with the key drivers, trends, and challenges. A holistic analysis of drivers will help companies refine their marketing strategies to gain a competitive advantage.

  • The evolution of the Global Food Service Equipment Market 2026-2030 is marked by a focus on targeted technological solutions. The benefits of open API in kitchen ecosystems are becoming clear, allowing for seamless integration across platforms. This is critical for the digital platforms for kitchen energy management that are now essential for optimizing operational costs.
  • For instance, the use of smart combi-ovens with infrared sensors can reduce cooking inconsistencies by over 30% compared to manually operated units. The role of automation in mitigating labor shortages is driving investment in robotic systems for high-volume restaurants and automated warewashing with heat recovery.
  • The comparison of HFCs vs natural refrigerants is a key consideration, pushing firms towards natural refrigerant based cooling systems to meet sustainability goals and regulatory mandates. The rise of delivery models has made optimizing food service equipment for delivery models a priority, with modular equipment for ghost kitchens and ventless cooking technology for urban spaces becoming standard.
  • However, challenges in retrofitting smart kitchen tech persist, exacerbated by the impact of high capital outlay on SMEs. The industry is also grappling with supply chain risks for semiconductor modules and is addressing the training requirements for advanced kitchen systems.
  • Sustainability drivers in commercial kitchen design are now at the forefront, influencing everything from the adoption of energy-efficient induction cooking suites to the implementation of the circular economy in food service equipment manufacturing, while 5G network slicing for industrial kitchens enables the necessary connectivity for these advanced systems.

What are the key market drivers leading to the rise in the adoption of Food Service Equipment Industry?

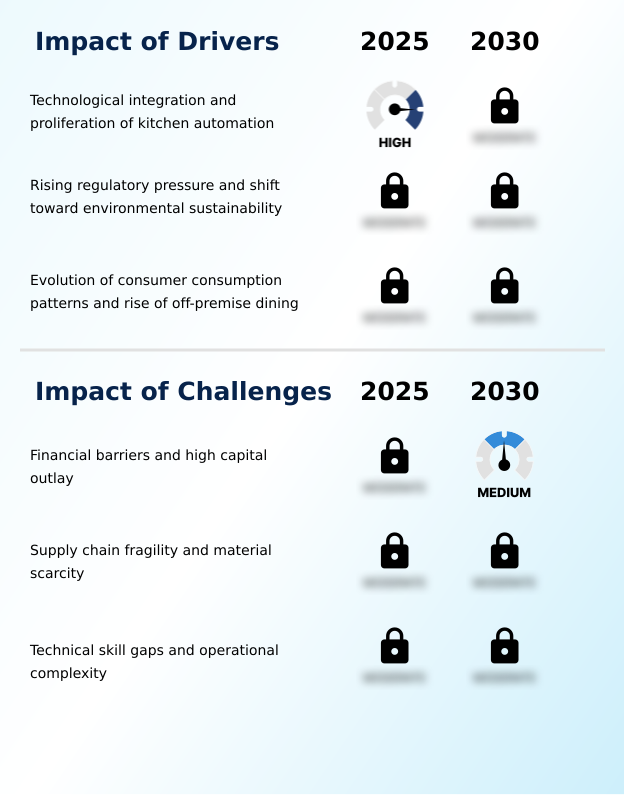
  • Technological integration and the proliferation of kitchen automation are key drivers of the market.

  • A key market driver is the need for enhanced kitchen operational efficiency, especially for high-volume food preparation.
  • The shift toward off-premise dining has accelerated demand for specialized ghost kitchen equipment, including modular cooking suites and ventless cooking technology, which optimize kitchen workflow optimization in compact spaces.
  • Resource efficiency is another significant driver, pushing for the replacement of systems using high-global-warming-potential hydrofluorocarbons. Advanced appliances such as combi-ovens and blast chillers are central to modern production, improving output consistency by over 25%.
  • Enhanced ware washing systems contribute to both hygiene and resource conservation. The use of digital diagnostic tools for smart asset management enables operators to monitor performance remotely, leading to a 15% reduction in annual maintenance costs for connected equipment.

What are the market trends shaping the Food Service Equipment Industry?

  • The advancement of integrated smart kitchen ecosystems is an upcoming market trend. This involves converging professional-grade hardware with sophisticated software platforms.

  • A primary trend is the rapid advancement of the smart kitchen ecosystem, enabled by the internet of things for commercial kitchen automation. This trend supports delivery-centric business models by improving efficiency. The adoption of robotic cooking systems and automated dishwashing units reduces reliance on manual labor, with some operators reporting a 20% increase in throughput.
  • Predictive maintenance algorithms are a cornerstone of data-driven kitchen management, decreasing equipment failure rates. Sustainable kitchen infrastructure is also gaining traction, marked by the use of natural refrigerants and the application of circular economy principles in manufacturing.
  • The integration of remote diagnostics into equipment for off-premise dining solutions ensures that maintenance can be performed preemptively, with connected systems showing a 30% faster issue resolution time compared to non-connected counterparts.

What challenges does the Food Service Equipment Industry face during its growth?

  • Financial barriers and high capital outlay are key challenges affecting industry growth.

  • A significant challenge is the high upfront cost of advanced culinary technology, which can deter investment in energy-efficient equipment. The operational complexity of modern systems for industrial hospitality applications also creates hurdles. For instance, integrating automated beverage dispensing systems with centralized management platforms requires robust low-latency communication.
  • The transition to carbon-neutral cooking equipment, while beneficial for energy load balancing, requires substantial capital. Even with proven benefits, such as water-recycling dishwashers reducing water use by up to 40%, the initial investment remains a barrier.
  • The need for professional sanitation systems is non-negotiable, yet retrofitting conveyor ovens or steam-jacketed kettles with heat recovery modules and energy-efficient compressors adds to the financial strain. Properly functioning food holding systems are critical, but their integration into a smart kitchen network presents technical challenges.

Exclusive Technavio Analysis on Customer Landscape

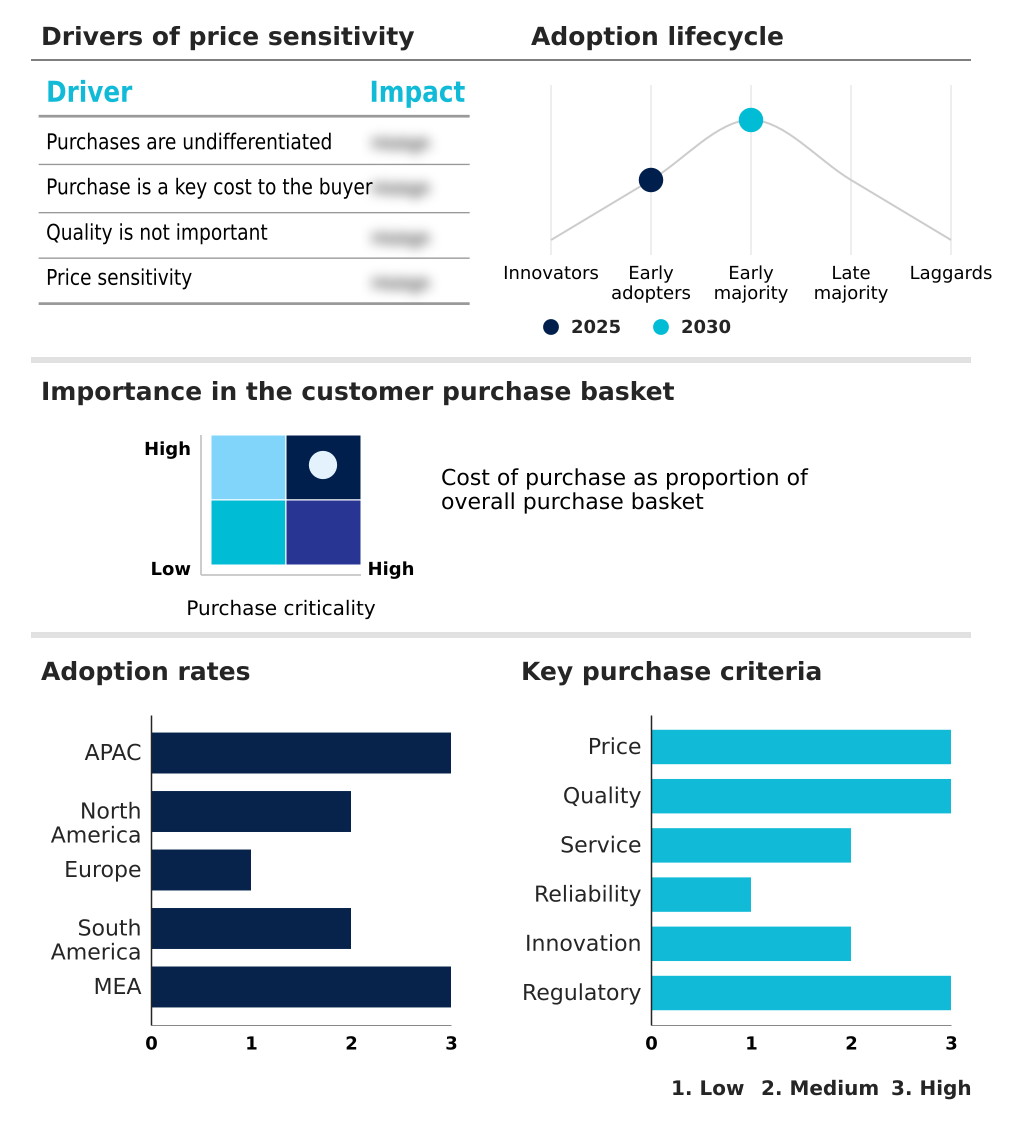
The food service equipment market forecasting report includes the adoption lifecycle of the market, covering from the innovator’s stage to the laggard’s stage. It focuses on adoption rates in different regions based on penetration. Furthermore, the food service equipment market report also includes key purchase criteria and drivers of price sensitivity to help companies evaluate and develop their market growth analysis strategies.

Customer Landscape of Food Service Equipment Industry

Competitive Landscape

Companies are implementing various strategies, such as strategic alliances, food service equipment market forecast, partnerships, mergers and acquisitions, geographical expansion, and product/service launches, to enhance their presence in the industry.

Ali Group Srl - An extensive portfolio of professional food service equipment, including cooking, refrigeration, and warewashing systems, is provided for the global hospitality and commercial kitchen markets.

The industry research and growth report includes detailed analyses of the competitive landscape of the market and information about key companies, including:

  • Ali Group Srl
  • Alto Shaam Inc.
  • Cambro Manufacturing Co.
  • Duke Manufacturing
  • Electrolux Professional AB
  • Fagor Industrial S. Coop
  • Hatco Corp.
  • HOSHIZAKI Corp.
  • Illinois Tool Works Inc.
  • Maschinenfabrik GmbH Co. KG
  • MEIKO Maschinenbau GmbH and Co.
  • Panasonic Holdings Corp.
  • RATIONAL Group
  • ROBOT COUPE SNC.
  • Sammic SL
  • The Middleby Corp.
  • The Vollrath Co. LLC
  • True Manufacturing Co. Inc.
  • UNOX S.p.A.
  • Winterhalter Gastronom GmbH

Qualitative and quantitative analysis of companies has been conducted to help clients understand the wider business environment as well as the strengths and weaknesses of key industry players. Data is qualitatively analyzed to categorize companies as pure play, category-focused, industry-focused, and diversified; it is quantitatively analyzed to categorize companies as dominant, leading, strong, tentative, and weak.

Recent Development and News in Food service equipment market

  • In May 2025, a leading Japanese technology conglomerate introduced a universal software interface designed to synchronize different brands of kitchen appliances within a single management dashboard.
  • In September 2025, a prominent European environmental commission finalized a comprehensive set of revised energy labeling requirements for all commercial-grade ware washing and cooling systems sold within the region.
  • In October 2025, a prominent real estate development firm in the Asia-Pacific region completed a specialized industrial park exclusively designed for cloud kitchen operators, featuring standardized utility hookups for modular cooking suites.
  • In August 2025, a major logistical bottleneck at a primary international shipping hub in East Asia caused a prolonged delay in the delivery of essential semiconductor modules used in digital oven controllers.

Dive into Technavio’s robust research methodology, blending expert interviews, extensive data synthesis, and validated models for unparalleled Food Service Equipment Market insights. See full methodology.

Market Scope
Page number 306
Base year 2025
Historic period 2020-2024
Forecast period 2026-2030
Growth momentum & CAGR Accelerate at a CAGR of 6.1%
Market growth 2026-2030 USD 14050.8 million
Market structure Fragmented
YoY growth 2025-2026(%) 5.9%
Key countries China, India, Japan, South Korea, Australia, Indonesia, US, Canada, Mexico, Germany, UK, France, Italy, Spain, The Netherlands, Brazil, Argentina, Colombia, Saudi Arabia, UAE, South Africa, Israel and Turkey
Competitive landscape Leading Companies, Market Positioning of Companies, Competitive Strategies, and Industry Risks

Request Free Sample

Research Analyst Overview

  • The food service equipment market is defined by the integration of the internet of things to create a cohesive smart kitchen ecosystem. This evolution impacts boardroom decisions on capital expenditure, as investments shift toward robotic cooking systems and automated dishwashing units to combat labor shortages.
  • Advanced thermal processing in combi-ovens and high-speed ovens, managed by digital oven controllers with infrared and spectral sensors, ensures consistency. Sustainability mandates drive the phase-out of high-global-warming-potential hydrofluorocarbons in favor of natural refrigerants, with refrigeration units now featuring energy-efficient and variable-speed compressors. Ware washing systems, including water-recycling dishwashers, incorporate heat recovery modules.
  • The proliferation of ghost kitchen equipment and modular cooking suites relies on ventless cooking technology. Key components like programmable logic controllers, high-grade stainless steel with antimicrobial coatings, and crucial semiconductor modules are central to modern designs.
  • The industry’s digital backbone is built on open application programming interfaces and enabled by technologies like the 5G-enabled network slice, which supports remote diagnostics and predictive maintenance algorithms, reducing equipment downtime by a significant margin.
  • From steam-jacketed kettles to beverage dispensing systems and advanced food holding systems to blast chillers and conveyor ovens, technology is reshaping every aspect of kitchen operations.

What are the Key Data Covered in this Food Service Equipment Market Research and Growth Report?

  • What is the expected growth of the Food Service Equipment Market between 2026 and 2030?

    • USD 14.05 billion, at a CAGR of 6.1%

  • What segmentation does the market report cover?

    • The report is segmented by Distribution Channel (Offline, and Online), Product (Cooking and preparation equipment, Refrigeration equipment, Ware washing equipment, Storage and handling equipment, and Others), End-user (Full-service restaurants and hotels, Quick-service restaurants, Institutional, and Others) and Geography (APAC, North America, Europe, South America, Middle East and Africa)

  • Which regions are analyzed in the report?

    • APAC, North America, Europe, South America and Middle East and Africa

  • What are the key growth drivers and market challenges?

    • Technological integration and proliferation of kitchen automation, Financial barriers and high capital outlay

  • Who are the major players in the Food Service Equipment Market?

    • Ali Group Srl, Alto Shaam Inc., Cambro Manufacturing Co., Duke Manufacturing, Electrolux Professional AB, Fagor Industrial S. Coop, Hatco Corp., HOSHIZAKI Corp., Illinois Tool Works Inc., Maschinenfabrik GmbH Co. KG, MEIKO Maschinenbau GmbH and Co., Panasonic Holdings Corp., RATIONAL Group, ROBOT COUPE SNC., Sammic SL, The Middleby Corp., The Vollrath Co. LLC, True Manufacturing Co. Inc., UNOX S.p.A. and Winterhalter Gastronom GmbH

Market Research Insights

  • The market is defined by a push towards greater kitchen operational efficiency and commercial kitchen automation. This drive is reshaping culinary production through advanced thermal engineering, refrigeration cycles, and mechanical processing. Firms adopting data-driven kitchen management achieve superior kitchen workflow optimization and smart asset management, with integrated kitchen operating systems improving resource efficiency by 15%.
  • This advanced culinary technology is crucial for delivery-centric business models and off-premise dining solutions. However, challenges like high capital outlay, technical skill gaps, and supply chain fragility persist. The adoption of sustainable kitchen infrastructure, incorporating circular economy principles in manufacturing and carbon-neutral cooking equipment, addresses these issues.
  • Operators are leveraging digital diagnostic tools and professional sanitation systems to uphold stringent food safety and hygiene standards. These systems support the cold chain infrastructure and enable high-volume food preparation, with low-latency communication being essential for industrial hospitality applications, improving energy load balancing by up to 20% compared to legacy systems.

We can help! Our analysts can customize this food service equipment market research report to meet your requirements.

Get in touch

1. Executive Summary

1.1 Market overview

Executive Summary - Chart on Market Overview
Executive Summary - Data Table on Market Overview
Executive Summary - Chart on Global Market Characteristics
Executive Summary - Chart on Market by Geography
Executive Summary - Chart on Market Segmentation by Distribution Channel
Executive Summary - Chart on Market Segmentation by Product
Executive Summary - Chart on Market Segmentation by End-user
Executive Summary - Chart on Incremental Growth
Executive Summary - Data Table on Incremental Growth
Executive Summary - Chart on Company Market Positioning

2. Technavio Analysis

2.1 Analysis of price sensitivity, lifecycle, customer purchase basket, adoption rates, and purchase criteria

2.2 Criticality of inputs and Factors of differentiation

Chart on Overview on criticality of inputs and factors of differentiation

2.3 Factors of disruption

Chart on Overview on factors of disruption

2.4 Impact of drivers and challenges

Chart on Impact of drivers and challenges in 2025 and 2030

3. Market Landscape

3.1 Market ecosystem

Chart on Parent Market
Data Table on - Parent Market

3.2 Market characteristics

Chart on Market characteristics analysis

3.3 Value chain analysis

Chart on Value chain analysis

4. Market Sizing

4.1 Market definition

Data Table on Offerings of companies included in the market definition

4.2 Market segment analysis

Market segments

4.3 Market size 2025

4.4 Market outlook: Forecast for 2025-2030

Chart on Global - Market size and forecast 2025-2030 ($ million)
Data Table on Global - Market size and forecast 2025-2030 ($ million)
Chart on Global Market: Year-over-year growth 2025-2030 (%)
Data Table on Global Market: Year-over-year growth 2025-2030 (%)

5. Historic Market Size

5.1 Global Food Service Equipment Market 2020 - 2024

Historic Market Size - Data Table on Global Food Service Equipment Market 2020 - 2024 ($ million)

5.2 Distribution Channel segment analysis 2020 - 2024

Historic Market Size - Distribution Channel Segment 2020 - 2024 ($ million)

5.3 Product segment analysis 2020 - 2024

Historic Market Size - Product Segment 2020 - 2024 ($ million)

5.4 End-user segment analysis 2020 - 2024

Historic Market Size - End-user Segment 2020 - 2024 ($ million)

5.5 Geography segment analysis 2020 - 2024

Historic Market Size - Geography Segment 2020 - 2024 ($ million)

5.6 Country segment analysis 2020 - 2024

Historic Market Size - Country Segment 2020 - 2024 ($ million)

6. Qualitative Analysis

6.1 The AI impact on Global Food Service Equipment Market

7. Five Forces Analysis

7.1 Five forces summary

Five forces analysis - Comparison between 2025 and 2030

7.2 Bargaining power of buyers

Bargaining power of buyers - Impact of key factors 2025 and 2030

7.3 Bargaining power of suppliers

Bargaining power of suppliers - Impact of key factors in 2025 and 2030

7.4 Threat of new entrants

Threat of new entrants - Impact of key factors in 2025 and 2030

7.5 Threat of substitutes

Threat of substitutes - Impact of key factors in 2025 and 2030

7.6 Threat of rivalry

Threat of rivalry - Impact of key factors in 2025 and 2030

7.7 Market condition

Chart on Market condition - Five forces 2025 and 2030

8. Market Segmentation by Distribution Channel

8.1 Market segments

Chart on Distribution Channel - Market share 2025-2030 (%)
Data Table on Distribution Channel - Market share 2025-2030 (%)

8.2 Comparison by Distribution Channel

Chart on Comparison by Distribution Channel
Data Table on Comparison by Distribution Channel

8.3 Offline - Market size and forecast 2025-2030

Chart on Offline - Market size and forecast 2025-2030 ($ million)
Data Table on Offline - Market size and forecast 2025-2030 ($ million)
Chart on Offline - Year-over-year growth 2025-2030 (%)
Data Table on Offline - Year-over-year growth 2025-2030 (%)

8.4 Online - Market size and forecast 2025-2030

Chart on Online - Market size and forecast 2025-2030 ($ million)
Data Table on Online - Market size and forecast 2025-2030 ($ million)
Chart on Online - Year-over-year growth 2025-2030 (%)
Data Table on Online - Year-over-year growth 2025-2030 (%)

8.5 Market opportunity by Distribution Channel

Market opportunity by Distribution Channel ($ million)
Data Table on Market opportunity by Distribution Channel ($ million)

9. Market Segmentation by Product

9.1 Market segments

Chart on Product - Market share 2025-2030 (%)
Data Table on Product - Market share 2025-2030 (%)

9.2 Comparison by Product

Chart on Comparison by Product
Data Table on Comparison by Product

9.3 Cooking and preparation equipment - Market size and forecast 2025-2030

Chart on Cooking and preparation equipment - Market size and forecast 2025-2030 ($ million)
Data Table on Cooking and preparation equipment - Market size and forecast 2025-2030 ($ million)
Chart on Cooking and preparation equipment - Year-over-year growth 2025-2030 (%)
Data Table on Cooking and preparation equipment - Year-over-year growth 2025-2030 (%)

9.4 Refrigeration equipment - Market size and forecast 2025-2030

Chart on Refrigeration equipment - Market size and forecast 2025-2030 ($ million)
Data Table on Refrigeration equipment - Market size and forecast 2025-2030 ($ million)
Chart on Refrigeration equipment - Year-over-year growth 2025-2030 (%)
Data Table on Refrigeration equipment - Year-over-year growth 2025-2030 (%)

9.5 Ware washing equipment - Market size and forecast 2025-2030

Chart on Ware washing equipment - Market size and forecast 2025-2030 ($ million)
Data Table on Ware washing equipment - Market size and forecast 2025-2030 ($ million)
Chart on Ware washing equipment - Year-over-year growth 2025-2030 (%)
Data Table on Ware washing equipment - Year-over-year growth 2025-2030 (%)

9.6 Storage and handling equipment - Market size and forecast 2025-2030

Chart on Storage and handling equipment - Market size and forecast 2025-2030 ($ million)
Data Table on Storage and handling equipment - Market size and forecast 2025-2030 ($ million)
Chart on Storage and handling equipment - Year-over-year growth 2025-2030 (%)
Data Table on Storage and handling equipment - Year-over-year growth 2025-2030 (%)

9.7 Others - Market size and forecast 2025-2030

Chart on Others - Market size and forecast 2025-2030 ($ million)
Data Table on Others - Market size and forecast 2025-2030 ($ million)
Chart on Others - Year-over-year growth 2025-2030 (%)
Data Table on Others - Year-over-year growth 2025-2030 (%)

9.8 Market opportunity by Product

Market opportunity by Product ($ million)
Data Table on Market opportunity by Product ($ million)

10. Market Segmentation by End-user

10.1 Market segments

Chart on End-user - Market share 2025-2030 (%)
Data Table on End-user - Market share 2025-2030 (%)

10.2 Comparison by End-user

Chart on Comparison by End-user
Data Table on Comparison by End-user

10.3 Full-service restaurants and hotels - Market size and forecast 2025-2030

Chart on Full-service restaurants and hotels - Market size and forecast 2025-2030 ($ million)
Data Table on Full-service restaurants and hotels - Market size and forecast 2025-2030 ($ million)
Chart on Full-service restaurants and hotels - Year-over-year growth 2025-2030 (%)
Data Table on Full-service restaurants and hotels - Year-over-year growth 2025-2030 (%)

10.4 Quick-service restaurants - Market size and forecast 2025-2030

Chart on Quick-service restaurants - Market size and forecast 2025-2030 ($ million)
Data Table on Quick-service restaurants - Market size and forecast 2025-2030 ($ million)
Chart on Quick-service restaurants - Year-over-year growth 2025-2030 (%)
Data Table on Quick-service restaurants - Year-over-year growth 2025-2030 (%)

10.5 Institutional - Market size and forecast 2025-2030

Chart on Institutional - Market size and forecast 2025-2030 ($ million)
Data Table on Institutional - Market size and forecast 2025-2030 ($ million)
Chart on Institutional - Year-over-year growth 2025-2030 (%)
Data Table on Institutional - Year-over-year growth 2025-2030 (%)

10.6 Others - Market size and forecast 2025-2030

Chart on Others - Market size and forecast 2025-2030 ($ million)
Data Table on Others - Market size and forecast 2025-2030 ($ million)
Chart on Others - Year-over-year growth 2025-2030 (%)
Data Table on Others - Year-over-year growth 2025-2030 (%)

10.7 Market opportunity by End-user

Market opportunity by End-user ($ million)
Data Table on Market opportunity by End-user ($ million)

11. Customer Landscape

11.1 Customer landscape overview

Analysis of price sensitivity, lifecycle, customer purchase basket, adoption rates, and purchase criteria

12. Geographic Landscape

12.1 Geographic segmentation

Chart on Market share by geography 2025-2030 (%)
Data Table on Market share by geography 2025-2030 (%)

12.2 Geographic comparison

Chart on Geographic comparison
Data Table on Geographic comparison

12.3 APAC - Market size and forecast 2025-2030

Chart on APAC - Market size and forecast 2025-2030 ($ million)
Data Table on APAC - Market size and forecast 2025-2030 ($ million)
Chart on APAC - Year-over-year growth 2025-2030 (%)
Data Table on APAC - Year-over-year growth 2025-2030 (%)
Chart on Regional Comparison - APAC
Data Table on Regional Comparison - APAC

12.3.1 China - Market size and forecast 2025-2030

Chart on China - Market size and forecast 2025-2030 ($ million)
Data Table on China - Market size and forecast 2025-2030 ($ million)
Chart on China - Year-over-year growth 2025-2030 (%)
Data Table on China - Year-over-year growth 2025-2030 (%)

12.3.2 India - Market size and forecast 2025-2030

Chart on India - Market size and forecast 2025-2030 ($ million)
Data Table on India - Market size and forecast 2025-2030 ($ million)
Chart on India - Year-over-year growth 2025-2030 (%)
Data Table on India - Year-over-year growth 2025-2030 (%)

12.3.3 Japan - Market size and forecast 2025-2030

Chart on Japan - Market size and forecast 2025-2030 ($ million)
Data Table on Japan - Market size and forecast 2025-2030 ($ million)
Chart on Japan - Year-over-year growth 2025-2030 (%)
Data Table on Japan - Year-over-year growth 2025-2030 (%)

12.3.4 South Korea - Market size and forecast 2025-2030

Chart on South Korea - Market size and forecast 2025-2030 ($ million)
Data Table on South Korea - Market size and forecast 2025-2030 ($ million)
Chart on South Korea - Year-over-year growth 2025-2030 (%)
Data Table on South Korea - Year-over-year growth 2025-2030 (%)

12.3.5 Australia - Market size and forecast 2025-2030

Chart on Australia - Market size and forecast 2025-2030 ($ million)
Data Table on Australia - Market size and forecast 2025-2030 ($ million)
Chart on Australia - Year-over-year growth 2025-2030 (%)
Data Table on Australia - Year-over-year growth 2025-2030 (%)

12.3.6 Indonesia - Market size and forecast 2025-2030

Chart on Indonesia - Market size and forecast 2025-2030 ($ million)
Data Table on Indonesia - Market size and forecast 2025-2030 ($ million)
Chart on Indonesia - Year-over-year growth 2025-2030 (%)
Data Table on Indonesia - Year-over-year growth 2025-2030 (%)

12.4 North America - Market size and forecast 2025-2030

Chart on North America - Market size and forecast 2025-2030 ($ million)
Data Table on North America - Market size and forecast 2025-2030 ($ million)
Chart on North America - Year-over-year growth 2025-2030 (%)
Data Table on North America - Year-over-year growth 2025-2030 (%)
Chart on Regional Comparison - North America
Data Table on Regional Comparison - North America

12.4.1 US - Market size and forecast 2025-2030

Chart on US - Market size and forecast 2025-2030 ($ million)
Data Table on US - Market size and forecast 2025-2030 ($ million)
Chart on US - Year-over-year growth 2025-2030 (%)
Data Table on US - Year-over-year growth 2025-2030 (%)

12.4.2 Canada - Market size and forecast 2025-2030

Chart on Canada - Market size and forecast 2025-2030 ($ million)
Data Table on Canada - Market size and forecast 2025-2030 ($ million)
Chart on Canada - Year-over-year growth 2025-2030 (%)
Data Table on Canada - Year-over-year growth 2025-2030 (%)

12.4.3 Mexico - Market size and forecast 2025-2030

Chart on Mexico - Market size and forecast 2025-2030 ($ million)
Data Table on Mexico - Market size and forecast 2025-2030 ($ million)
Chart on Mexico - Year-over-year growth 2025-2030 (%)
Data Table on Mexico - Year-over-year growth 2025-2030 (%)

12.5 Europe - Market size and forecast 2025-2030

Chart on Europe - Market size and forecast 2025-2030 ($ million)
Data Table on Europe - Market size and forecast 2025-2030 ($ million)
Chart on Europe - Year-over-year growth 2025-2030 (%)
Data Table on Europe - Year-over-year growth 2025-2030 (%)
Chart on Regional Comparison - Europe
Data Table on Regional Comparison - Europe

12.5.1 Germany - Market size and forecast 2025-2030

Chart on Germany - Market size and forecast 2025-2030 ($ million)
Data Table on Germany - Market size and forecast 2025-2030 ($ million)
Chart on Germany - Year-over-year growth 2025-2030 (%)
Data Table on Germany - Year-over-year growth 2025-2030 (%)

12.5.2 UK - Market size and forecast 2025-2030

Chart on UK - Market size and forecast 2025-2030 ($ million)
Data Table on UK - Market size and forecast 2025-2030 ($ million)
Chart on UK - Year-over-year growth 2025-2030 (%)
Data Table on UK - Year-over-year growth 2025-2030 (%)

12.5.3 France - Market size and forecast 2025-2030

Chart on France - Market size and forecast 2025-2030 ($ million)
Data Table on France - Market size and forecast 2025-2030 ($ million)
Chart on France - Year-over-year growth 2025-2030 (%)
Data Table on France - Year-over-year growth 2025-2030 (%)

12.5.4 Italy - Market size and forecast 2025-2030

Chart on Italy - Market size and forecast 2025-2030 ($ million)
Data Table on Italy - Market size and forecast 2025-2030 ($ million)
Chart on Italy - Year-over-year growth 2025-2030 (%)
Data Table on Italy - Year-over-year growth 2025-2030 (%)

12.5.5 Spain - Market size and forecast 2025-2030

Chart on Spain - Market size and forecast 2025-2030 ($ million)
Data Table on Spain - Market size and forecast 2025-2030 ($ million)
Chart on Spain - Year-over-year growth 2025-2030 (%)
Data Table on Spain - Year-over-year growth 2025-2030 (%)

12.5.6 The Netherlands - Market size and forecast 2025-2030

Chart on The Netherlands - Market size and forecast 2025-2030 ($ million)
Data Table on The Netherlands - Market size and forecast 2025-2030 ($ million)
Chart on The Netherlands - Year-over-year growth 2025-2030 (%)
Data Table on The Netherlands - Year-over-year growth 2025-2030 (%)

12.6 South America - Market size and forecast 2025-2030

Chart on South America - Market size and forecast 2025-2030 ($ million)
Data Table on South America - Market size and forecast 2025-2030 ($ million)
Chart on South America - Year-over-year growth 2025-2030 (%)
Data Table on South America - Year-over-year growth 2025-2030 (%)
Chart on Regional Comparison - South America
Data Table on Regional Comparison - South America

12.6.1 Brazil - Market size and forecast 2025-2030

Chart on Brazil - Market size and forecast 2025-2030 ($ million)
Data Table on Brazil - Market size and forecast 2025-2030 ($ million)
Chart on Brazil - Year-over-year growth 2025-2030 (%)
Data Table on Brazil - Year-over-year growth 2025-2030 (%)

12.6.2 Argentina - Market size and forecast 2025-2030

Chart on Argentina - Market size and forecast 2025-2030 ($ million)
Data Table on Argentina - Market size and forecast 2025-2030 ($ million)
Chart on Argentina - Year-over-year growth 2025-2030 (%)
Data Table on Argentina - Year-over-year growth 2025-2030 (%)

12.6.3 Colombia - Market size and forecast 2025-2030

Chart on Colombia - Market size and forecast 2025-2030 ($ million)
Data Table on Colombia - Market size and forecast 2025-2030 ($ million)
Chart on Colombia - Year-over-year growth 2025-2030 (%)
Data Table on Colombia - Year-over-year growth 2025-2030 (%)

12.7 Middle East and Africa - Market size and forecast 2025-2030

Chart on Middle East and Africa - Market size and forecast 2025-2030 ($ million)
Data Table on Middle East and Africa - Market size and forecast 2025-2030 ($ million)
Chart on Middle East and Africa - Year-over-year growth 2025-2030 (%)
Data Table on Middle East and Africa - Year-over-year growth 2025-2030 (%)
Chart on Regional Comparison - Middle East and Africa
Data Table on Regional Comparison - Middle East and Africa

12.7.1 Saudi Arabia - Market size and forecast 2025-2030

Chart on Saudi Arabia - Market size and forecast 2025-2030 ($ million)
Data Table on Saudi Arabia - Market size and forecast 2025-2030 ($ million)
Chart on Saudi Arabia - Year-over-year growth 2025-2030 (%)
Data Table on Saudi Arabia - Year-over-year growth 2025-2030 (%)

12.7.2 UAE - Market size and forecast 2025-2030

Chart on UAE - Market size and forecast 2025-2030 ($ million)
Data Table on UAE - Market size and forecast 2025-2030 ($ million)
Chart on UAE - Year-over-year growth 2025-2030 (%)
Data Table on UAE - Year-over-year growth 2025-2030 (%)

12.7.3 South Africa - Market size and forecast 2025-2030

Chart on South Africa - Market size and forecast 2025-2030 ($ million)
Data Table on South Africa - Market size and forecast 2025-2030 ($ million)
Chart on South Africa - Year-over-year growth 2025-2030 (%)
Data Table on South Africa - Year-over-year growth 2025-2030 (%)

12.7.4 Israel - Market size and forecast 2025-2030

Chart on Israel - Market size and forecast 2025-2030 ($ million)
Data Table on Israel - Market size and forecast 2025-2030 ($ million)
Chart on Israel - Year-over-year growth 2025-2030 (%)
Data Table on Israel - Year-over-year growth 2025-2030 (%)

12.7.5 Turkey - Market size and forecast 2025-2030

Chart on Turkey - Market size and forecast 2025-2030 ($ million)
Data Table on Turkey - Market size and forecast 2025-2030 ($ million)
Chart on Turkey - Year-over-year growth 2025-2030 (%)
Data Table on Turkey - Year-over-year growth 2025-2030 (%)

12.8 Market opportunity by geography

Market opportunity by geography ($ million)
Data Tables on Market opportunity by geography ($ million)

13. Drivers, Challenges, and Opportunity

13.1 Market drivers

Technological integration and proliferation of kitchen automation
Rising regulatory pressure and shift toward environmental sustainability
Evolution of consumer consumption patterns and rise of off-premise dining

13.2 Market challenges

Financial barriers and high capital outlay
Supply chain fragility and material scarcity
Technical skill gaps and operational complexity

13.3 Impact of drivers and challenges

Impact of drivers and challenges in 2025 and 2030

13.4 Market opportunities

Advancement of integrated smart kitchen ecosystems
Emphasis on sustainable design and circular economy
Proliferation of modular and compact equipment for ghost kitchens

14. Competitive Landscape

14.1 Overview

14.2

Overview on criticality of inputs and factors of differentiation

14.3 Landscape disruption

Overview on factors of disruption

14.4 Industry risks

Impact of key risks on business

15. Competitive Analysis

15.1 Companies profiled

Companies covered

15.2 Company ranking index

15.3 Market positioning of companies

Matrix on companies position and classification

15.4 Ali Group Srl

Ali Group Srl - Overview
Ali Group Srl - Product / Service
Ali Group Srl - Key offerings
SWOT

15.5 Alto Shaam Inc.

Alto Shaam Inc. - Overview
Alto Shaam Inc. - Product / Service
Alto Shaam Inc. - Key offerings
SWOT

15.6 Electrolux Professional AB

Electrolux Professional AB - Overview
Electrolux Professional AB - Business segments
Electrolux Professional AB - Key news
Electrolux Professional AB - Key offerings
Electrolux Professional AB - Segment focus
SWOT

15.7 Fagor Industrial S. Coop

Fagor Industrial S. Coop - Overview
Fagor Industrial S. Coop - Product / Service
Fagor Industrial S. Coop - Key offerings
SWOT

15.8 Hatco Corp.

Hatco Corp. - Overview
Hatco Corp. - Product / Service
Hatco Corp. - Key offerings
SWOT

15.9 HOSHIZAKI Corp.

HOSHIZAKI Corp. - Overview
HOSHIZAKI Corp. - Business segments
HOSHIZAKI Corp. - Key offerings
HOSHIZAKI Corp. - Segment focus
SWOT

15.10 Illinois Tool Works Inc.

Illinois Tool Works Inc. - Overview
Illinois Tool Works Inc. - Business segments
Illinois Tool Works Inc. - Key offerings
Illinois Tool Works Inc. - Segment focus
SWOT

15.11 Maschinenfabrik GmbH Co. KG

Maschinenfabrik GmbH Co. KG - Overview
Maschinenfabrik GmbH Co. KG - Product / Service
Maschinenfabrik GmbH Co. KG - Key offerings
SWOT

15.12 MEIKO Maschinenbau GmbH and Co.

MEIKO Maschinenbau GmbH and Co. - Overview
MEIKO Maschinenbau GmbH and Co. - Product / Service
MEIKO Maschinenbau GmbH and Co. - Key offerings
SWOT

15.13 RATIONAL Group

RATIONAL Group - Overview
RATIONAL Group - Business segments
RATIONAL Group - Key offerings
RATIONAL Group - Segment focus
SWOT

15.14 Sammic SL

Sammic SL - Overview
Sammic SL - Product / Service
Sammic SL - Key offerings
SWOT

15.15 The Middleby Corp.

The Middleby Corp. - Overview
The Middleby Corp. - Business segments
The Middleby Corp. - Key offerings
The Middleby Corp. - Segment focus
SWOT

15.16 The Vollrath Co. LLC

The Vollrath Co. LLC - Overview
The Vollrath Co. LLC - Product / Service
The Vollrath Co. LLC - Key offerings
SWOT

15.17 True Manufacturing Co. Inc.

True Manufacturing Co. Inc. - Overview
True Manufacturing Co. Inc. - Product / Service
True Manufacturing Co. Inc. - Key offerings
SWOT

15.18 Winterhalter Gastronom GmbH

Winterhalter Gastronom GmbH - Overview
Winterhalter Gastronom GmbH - Product / Service
Winterhalter Gastronom GmbH - Key offerings
SWOT

16. Appendix

16.1 Scope of the report

Market definition
Objectives
Notes and caveats

16.2 Inclusions and exclusions checklist

Inclusions checklist
Exclusions checklist

16.3 Currency conversion rates for US$

16.4 Research methodology

16.5 Data procurement

Information sources

16.6 Data validation

16.7 Validation techniques employed for market sizing

16.8 Data synthesis

16.9 360 degree market analysis

16.10 List of abbreviations

Research Methodology

Technavio presents a detailed picture of the market by way of study, synthesis, and summation of data from multiple sources. The analysts have presented the various facets of the market with a particular focus on identifying the key industry influencers. The data thus presented is comprehensive, reliable, and the result of extensive research, both primary and secondary.

INFORMATION SOURCES

Primary sources

  • Manufacturers and suppliers
  • Channel partners
  • Industry experts
  • Strategic decision makers

Secondary sources

  • Industry journals and periodicals
  • Government data
  • Financial reports of key industry players
  • Historical data
  • Press releases

DATA ANALYSIS

Data Synthesis

  • Collation of data
  • Estimation of key figures
  • Analysis of derived insights

Data Validation

  • Triangulation with data models
  • Reference against proprietary databases
  • Corroboration with industry experts

REPORT WRITING

Qualitative

  • Market drivers
  • Market challenges
  • Market trends
  • Five forces analysis

Quantitative

  • Market size and forecast
  • Market segmentation
  • Geographical insights
  • Competitive landscape

Interested in this report?

Get your sample now to see our research methodology and insights!

Download Now

Frequently Asked Questions

Food Service Equipment market growth will increase by USD 14050.8 million during 2026-2030.

The Food Service Equipment market is expected to grow at a CAGR of 6.1% during 2026-2030.

Food Service Equipment market is segmented by Distribution channel (Offline, Online) Product (Cooking and preparation equipment, Refrigeration equipment, Ware washing equipment, Storage and handling equipment, Others) End-user (Full-service restaurants and hotels, Quick-service restaurants, Institutional, Others)

Ali Group Srl, Alto Shaam Inc., Cambro Manufacturing Co., Duke Manufacturing, Electrolux Professional AB, Fagor Industrial S. Coop, Hatco Corp., HOSHIZAKI Corp., Illinois Tool Works Inc., Maschinenfabrik GmbH Co. KG, MEIKO Maschinenbau GmbH and Co., Panasonic Holdings Corp., RATIONAL Group, ROBOT COUPE SNC., Sammic SL, The Middleby Corp., The Vollrath Co. LLC, True Manufacturing Co. Inc., UNOX S.p.A., Winterhalter Gastronom GmbH are a few of the key vendors in the Food Service Equipment market.

APAC will register the highest growth rate of 43.1% among the other regions. Therefore, the Food Service Equipment market in APAC is expected to garner significant business opportunities for the vendors during the forecast period.

China, India, Japan, South Korea, Australia, Indonesia, US, Canada, Mexico, Germany, UK, France, Italy, Spain, The Netherlands, Brazil, Argentina, Colombia, Saudi Arabia, UAE, South Africa, Israel, Turkey

  • Technological integration and proliferation of kitchen automation is the driving factor this market.

The Food Service Equipment market vendors should focus on grabbing business opportunities from the Distribution channel segment as it accounted for the largest market share in the base year.