Commercial Kitchen Equipment Market Size 2025-2029
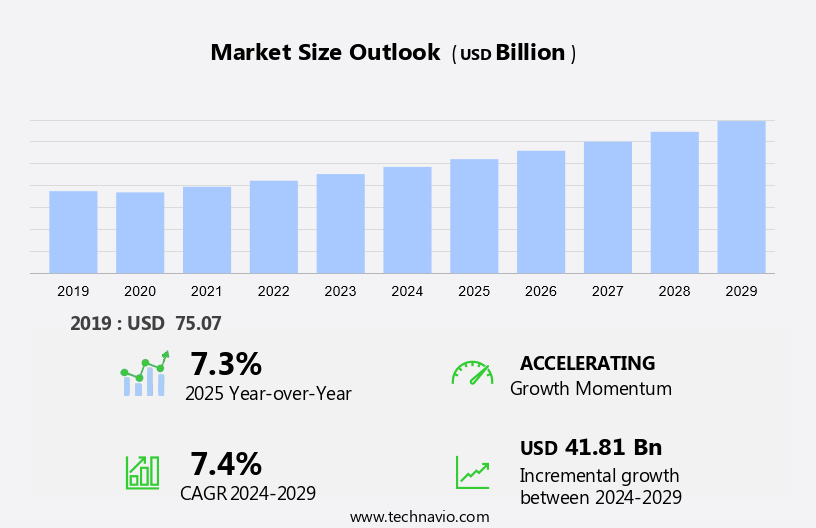
The commercial kitchen equipment market size is forecast to increase by USD 41.81 billion at a CAGR of 7.4% between 2024 and 2029.
- The market is experiencing significant growth due to the expanding food service industry in various economies. This expansion is driving the demand for advanced kitchen equipment that prioritizes energy management, hygienic environments, and precise temperature control. Refrigeration units and cook-chill systems are increasingly popular solutions in restaurants, hotels, catering services, quick service restaurants, and other food service establishments. Companies in this market face challenges related to product recalls, emphasizing the importance of maintaining high product quality and safety standards. Commercial cooking equipment, including broilers and other types, must meet these requirements while also offering innovative features to remain competitive. This market analysis report delves into these trends and challenges, providing valuable insights for stakeholders.
What will be the Size of the Market During the Forecast Period?
-
The market is a significant sector within the food service industry, supplying essential tools and appliances to restaurants, hotels, catering services, cafes, and other food establishments. This market caters to various segments, including high-capacity appliances, energy-efficient appliances, dishwashers, ovens, refrigeration equipment, beverage dispensers, and specialized appliances. The food service industry, comprised of travel and tourism, hospitality, and quick service restaurants, is a significant contributor to the global economy. Commercial kitchens are the backbone of this industry, enabling the preparation and service of meals to customers. The demand for commercial kitchen equipment is driven by several factors, including consumer habits and the need for high-volume cooking and energy efficiency. High-capacity appliances are essential for large-scale food establishments, such as hotels and restaurants, to meet the demands of their customers. Energy-efficient appliances have gained popularity due to their cost savings and environmental benefits. Dishwashers, ovens, and refrigeration equipment are critical components of any commercial kitchen, ensuring food safety and maintaining optimal food temperatures. Beverage dispensers have become increasingly important in the food service industry, with the rise of self-service and customized beverage options
-
.Cloud kitchens, ghost kitchens, and delivery-only restaurants have emerged as new business models, requiring specialized appliances to optimize their operations. Fast food chains and quick service restaurants rely on commercial cooking equipment, such as broilers, fryers, cookers, ranges, kettles, steamers, and more, to prepare meals quickly and efficiently. Catering services and cafes catering to large events and offices require high-volume cooking capabilities, making commercial kitchen appliances an essential investment. Packaged food and instant meals have become increasingly popular consumer choices, leading to an increased demand for commercial kitchen equipment in the production and preparation of these products. The food service industry's growth is expected to continue, driven by consumer preferences, technological advancements, and changing business models.
How is this market segmented and which is the largest segment?
The market research report provides comprehensive data (region-wise segment analysis), with forecasts and estimates in "USD million" for the period 2025-2029, as well as historical data from 2019-2023 for the following segments.
- Product
- Oven
- Refrigerator
- Dishwasher and dryer
- Grilling equipment
- Others
- End-user
- Food service
- Hotels and resorts
- Institutional kitchens
- Food and beverage retail
- Others
- Geography
- North America
- Canada
- US
- Europe
- Germany
- UK
- France
- Italy
- APAC
- China
- India
- Japan
- Middle East and Africa
- South America
- Brazil
- North America
By Product Insights
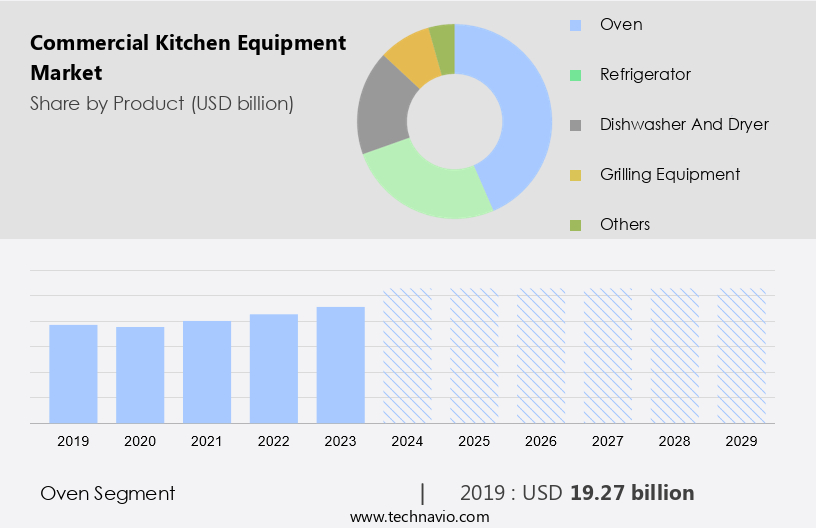
- The oven segment is estimated to witness significant growth during the forecast period.
The market, specifically the segment dedicated to ovens, is experiencing significant growth in the United States. Commercial ovens are essential in high-volume food service establishments such as restaurants, cafes, bakeries, and more. Engineered for continuous use, these ovens can efficiently and quickly prepare large quantities of food. The market provides a range of commercial ovens, including convection ovens, deck ovens, and conveyor ovens, each designed to cater to unique culinary requirements and operational demands. Convection ovens are highly sought-after due to their even and quick cooking abilities. They operate using a fan to circulate hot air around the food, ensuring uniform cooking results and decreasing cooking times.
Additionally, fast food chains and other quick-service restaurants frequently utilize advanced cooking technology, such as convection ovens, to expedite food preparation and enhance overall efficiency. Commercial kitchen appliances, including fryers, cookers, ranges, kettles, steamers, and ovens, are continuously evolving with the integration of artificial intelligence and advanced cooking technology. This technological advancement enables improved temperature control, energy efficiency, and streamlined food preparation processes. As the demand for fast food and convenience continues to rise, the market is expected to grow steadfastly in the United States.
Get a glance at the market report of share of various segments Request Free Sample
The Oven segment was valued at USD 19.27 billion in 2019 and showed a gradual increase during the forecast period.
Regional Analysis
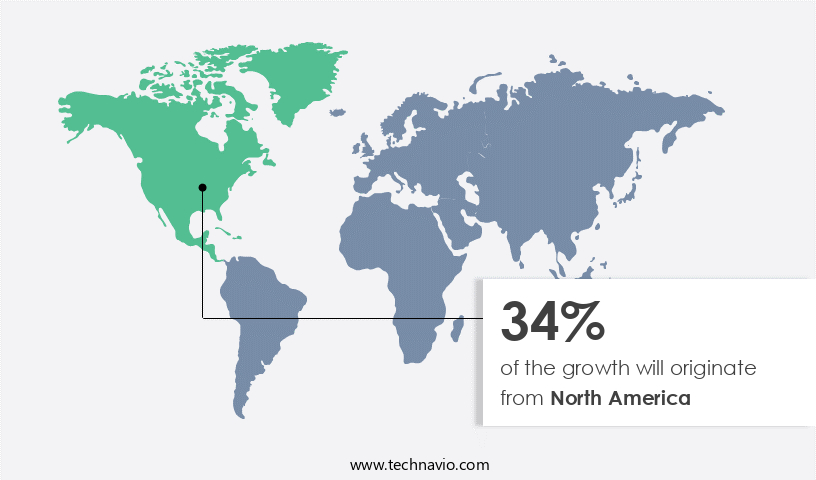
- North America is estimated to contribute 34% to the growth of the global market during the forecast period.
Technavio's analysts have elaborately explained the regional trends and drivers that shape the market during the forecast period.
For more insights on the market share of various regions Request Free Sample
The market in North America is witnessing notable expansion due to the thriving food service industry and the hospitality sector. This growth can be attributed to the rising consumer preference for dining out, the expansion of foodservice establishments, and the ongoing trend towards quick-service and convenience dining.
Additionally, commercial kitchens in the food service and hospitality industries require high-capacity appliances, energy-efficient appliances, dishwashers, ovens, refrigeration equipment, and beverage dispensers to cater to the increasing demand. Additionally, the emergence of cloud kitchens is further fueling the growth of the market. These kitchens, which operate solely for delivery and takeout, require specialized equipment to maintain the quality and temperature of food during transportation. Energy efficiency is a significant consideration for commercial kitchens, as they consume a significant amount of energy. Energy-efficient appliances are becoming increasingly popular as a means of reducing operating costs and minimizing environmental impact. The market for energy-efficient commercial kitchen equipment is expected to grow at a steady pace during the forecast period.
Market Dynamics
Our researchers analyzed the data with 2024 as the base year, along with the key drivers, trends, and challenges. A holistic analysis of drivers will help companies refine their marketing strategies to gain a competitive advantage.
What are the key market drivers leading to the rise in adoption of Commercial Kitchen Equipment Market?
Expansion of foodservice industry in emerging economies is the key driver of the market.
-
The market is witnessing notable growth due to the increasing popularity of foodservice establishments, such as full-service restaurants, quick-service outlets, caterers, and cafeterias. These businesses account for a significant portion of food-away-from-home spending, offering meals and snacks for immediate consumption. The foodservice industry's expansion is particularly noticeable in emerging economies, with countries like China and India experiencing substantial growth.
-
The rise of ghost kitchens and delivery-only restaurants is driving demand for specialized appliances in commercial kitchens. The integration of Internet of Things (IoT) technology, machine learning, and artificial intelligence (AI) in commercial kitchen equipment is also gaining traction, enabling health-focused menus and vegan cooking. These advancements are expected to further boost the market's growth in the coming years. The market is poised for significant expansion, driven by these trends and the overall growth of the food service industry. Thus, such factors are driving the growth of the market during the forecast period.
What are the market trends shaping the Commercial Kitchen Equipment Market?
The introduction of new products is the upcoming trend in the market.
- The market is experiencing a notable shift towards the adoption of advanced technology to boost efficiency, food quality, and speed in food preparation and service. This trend is fueled by the food service sector's increasing demand for sophisticated equipment to manage large-scale operations and maintain consistent food quality. On February 27, 2024, RATIONAL introduced the iHexagon, an innovative product that integrates steam, hot air, and microwave technologies. This combination enables food to be cooked to the desired quality in minimal time.
- The iHexagon comes equipped with the iClimateBoost cooking assistant, which adjusts heat levels to ensure uniform results across all six racks. Energy management, temperature control, and maintaining a hygienic environment are crucial considerations in commercial kitchens. Refrigeration units, cook-chill systems, and commercial cooking equipment, such as broilers, are essential components in the food service industry.
What challenges does Commercial Kitchen Equipment Market face during the growth?
Concerns for vendors over product recalls is a key challenge affecting the market growth.
- Commercial kitchen equipment companies encounter significant challenges with product recalls, which can result in serious consequences. Recalls pose risks to consumers' safety and can lead to substantial financial losses, damage to brand reputation, and potential legal liabilities for manufacturers. The recall was due to potential electrical shock and electrocution hazards, as the control panels on these ranges could detach, posing significant safety risks. The affected models were manufactured between October and November 2023. The importance of food safety and energy efficiency continues to gain prominence in the market.
- Gluten-free and low-fat cooking solutions, air fryers, induction cooktops, energy-saving ovens, and low-energy refrigerators are increasingly popular. Smart kitchen technology, including programmable ovens and induction cooking, is also gaining traction. Furthermore, reducing CO2 emissions is a growing concern, and energy-efficient equipment is becoming a priority.
Exclusive Customer Landscape
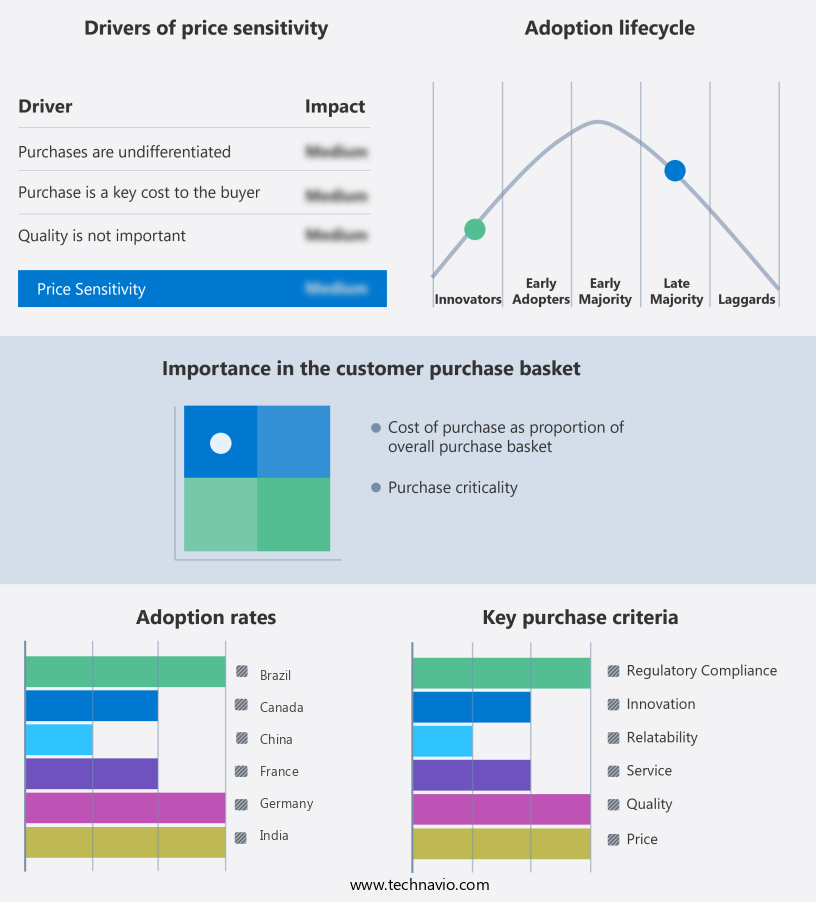
The market forecasting report includes the adoption lifecycle of the market, covering from the innovator's stage to the laggard's stage. It focuses on adoption rates in different regions based on penetration. Furthermore, the market report also includes key purchase criteria and drivers of price sensitivity to help companies evaluate and develop their market growth analysis strategies.
Customer Landscape
Key Companies & Market Insights
Companies are implementing various strategies, such as strategic alliances, market forecast, partnerships, mergers and acquisitions, geographical expansion, and product/service launches, to enhance their presence in the market.
The market research and growth report includes detailed analyses of the competitive landscape of the market and information about key companies, including:
- Ali Group Srl
- Alto Shaam Inc.
- ATOSA USA
- Bertazzoni Spa
- Comstock Castle Stove Co. Inc.
- Duke Manufacturing
- Electrolux Professional AB
- Fagor Industrial S. Coop
- Garland group
- Henny Penny Corp.
- HOSHIZAKI Corp.
- Illinois Tool Works Inc.
- Liebherr International AG
- Manitowoc Ice
- RATIONAL Group
- The Middleby Corp.
- True Manufacturing Co. Inc.
- WELBILT INC.
Qualitative and quantitative analysis of companies has been conducted to help clients understand the wider business environment as well as the strengths and weaknesses of key market players. Data is qualitatively analyzed to categorize companies as pure play, category-focused, industry-focused, and diversified; it is quantitatively analyzed to categorize companies as dominant, leading, strong, tentative, and weak.
Research Analyst Overview
The market caters to the food service industry, including travel and tourism, hospitality, and quick service restaurants. The market is witnessing significant growth due to the increasing demand for high-capacity and energy-efficient appliances. Refrigeration equipment, ovens, dishwashers, beverage dispensers, and specialized appliances are the major types of commercial kitchen equipment in high demand. The market is also witnessing the emergence of cloud and ghost kitchens, delivery-only restaurants, and specialized appliances for health-focused menus such as vegan, gluten-free, and low-fat cooking. Advanced cooking technology, including smart ovens, programmable ovens, and energy management systems, is gaining popularity due to their energy-saving capabilities and temperature control features. The Internet of Things (IoT) and artificial intelligence (AI) are transforming commercial kitchens with smart kitchen technology.
Further, smart ovens, refrigerators, and automated appliances are becoming increasingly common, offering wi-fi connectivity, mobile applications, and temperature control features. The market is also witnessing the adoption of advanced cooking technology, including air fryers, induction cooktops, energy-saving ovens, and low-energy refrigerators. The market is expected to grow further due to consumer habits shifting towards ready-to-eat food, packaged food, and instant meals. Training programs for kitchen staff and the availability of online food ordering, home delivery services, drive-through services, and online payments are also driving the market's growth. The market is witnessing significant competition, with catering services, cafes, and multicuisine restaurants being major consumers of commercial kitchen equipment. Broilers, fryers, cookers, ranges, kettles, steamers, and fast food equipment are some of the essential appliances used in commercial kitchens.
|
Market Scope |
|
|
Report Coverage |
Details |
|
Page number |
222 |
|
Base year |
2024 |
|
Historic period |
2019-2023 |
|
Forecast period |
2025-2029 |
|
Growth momentum & CAGR |
Accelerate at a CAGR of 7.4% |
|
Market growth 2025-2029 |
USD 41.81 billion |
|
Market structure |
Fragmented |
|
YoY growth 2024-2025(%) |
7.3 |
|
Key countries |
US, Germany, China, UK, Canada, France, India, Japan, Italy, and Brazil |
|
Competitive landscape |
Leading Companies, Market Positioning of Companies, Competitive Strategies, and Industry Risks |
What are the Key Data Covered in this Market Research and Growth Report?
- CAGR of the market during the forecast period
- Detailed information on factors that will drive the market growth and forecasting between 2025 and 2029
- Precise estimation of the size of the market and its contribution of the market in focus to the parent market
- Accurate predictions about upcoming market growth and trends and changes in consumer behaviour
- Growth of the market across North America, Europe, APAC, Middle East and Africa, and South America
- Thorough analysis of the market's competitive landscape and detailed information about companies
- Comprehensive analysis of factors that will challenge the growth of market companies
We can help! Our analysts can customize this market research report to meet your requirements. Get in touch
 RIA -
RIA - 
