Food Stabilizers Market Analysis Europe, North America, APAC, South America, Middle East and Africa - US, Germany, UK, China, France - Size and Forecast 2024-2028

Food Stabilizers Market Analysis Europe, North America, APAC, South America, Middle East and Africa - US, Germany, UK, China, France - Size and Forecast 2024-2028

Published: Aug 2024 190 Pages SKU: IRTNTR75795

Market Overview at a Glance

$725.8 Mn
Market Opportunity
4.36%
CAGR
4.11
YoY growth 2023-2024(%)

Food Stabilizers Market Size 2024-2028 

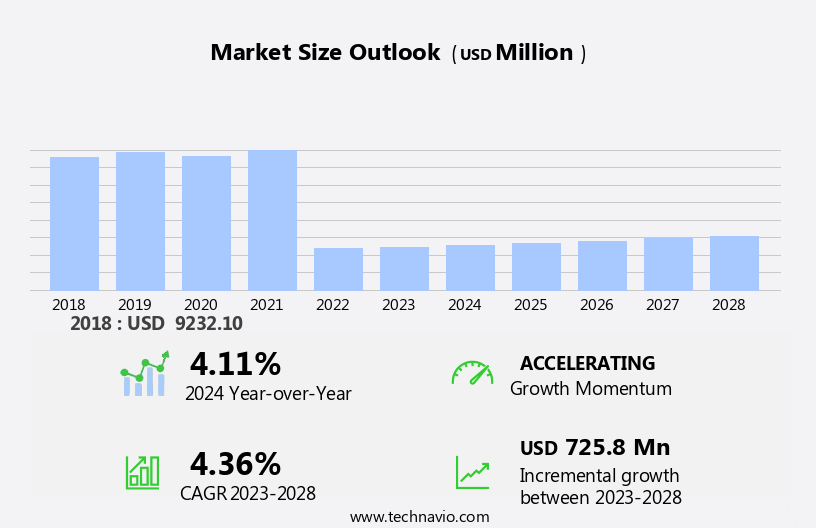
The food stabilizers market size is forecast to increase by USD 725.8 million at a CAGR of 4.36% between 2023 and 2028. The market is experiencing significant growth due to the increasing demand for convenience foods and the expanding utilization of food stabilizers in gluten-free products. Jellies, fillings, puddings, marmalades, ice cream, sauces, and soups are some of the major food categories that extensively use food stabilizers to enhance their texture and shelf life. Additionally, the rising trend towards low-calorie and dietetic foods is driving the demand for food stabilizers that help maintain the desired consistency and stability without adding excessive calories. However, ethical concerns surrounding the use of animal-derived food stabilizers are posing challenges to market growth. To cater to evolving consumer preferences, manufacturers are focusing on developing clean label products using plant-based stabilizers such as Hamilton.

Food Stabilizers Market Size

 Request Free Sample

The food stabilizers market is a significant sector in the food industry, focusing on the production and sales of food stabilizers used in various packaged food products. Food stabilizers play a crucial role in preserving foods, preventing ice crystal formation, and ensuring proper settling during manufacturing and storage. In the context of packaged food products, food stabilizers are essential additives that maintain the desired texture, appearance, and consistency. These additives are widely used in various food categories, including beverages, cakes, jellies, fillings, puddings, marmalades, ice cream, sauces, and soups. Fruit settling is a common issue in food processing, particularly in beverages and jams. Food stabilizers, such as hamulsion, alginate, agar, guar gum, cellulose, and cellulose derivatives, are employed to prevent fruit settling and maintain homogeneity in the final product. Ice crystal formation is another challenge in the food industry, particularly in frozen and chilled food products.

Additionally, food stabilizers, such as alginate, agar, and cellulose derivatives, are used to inhibit ice crystal growth and maintain the desired texture and quality. The food stabilizer market is driven by the increasing demand for extended shelf life, improved texture, and enhanced consumer experience in packaged food products. The market is segmented into bakery/confectionery, meat/poultry, sauces and dressings, and other food categories. Bakery/confectionery products, such as cakes and pastries, rely on food stabilizers to maintain their structure and texture. Alginate, agar, and guar gum are commonly used as food stabilizers in this segment. Meat and poultry products require food stabilizers to maintain their texture and prevent syneresis, a condition where water separates from the food product. Cellulose and cellulose derivatives are widely used as food stabilizers in this segment. Sauces and dressings, including beverages, require food stabilizers to prevent separation and maintain their consistency. Alginate, agar, and guar gum are commonly used as food stabilizers in this segment.

Market Segmentation

The market research report provides comprehensive data (region-wise segment analysis), with forecasts and estimates in "USD million" for the period 2024-2028, as well as historical data from 2018-2022 for the following segments.
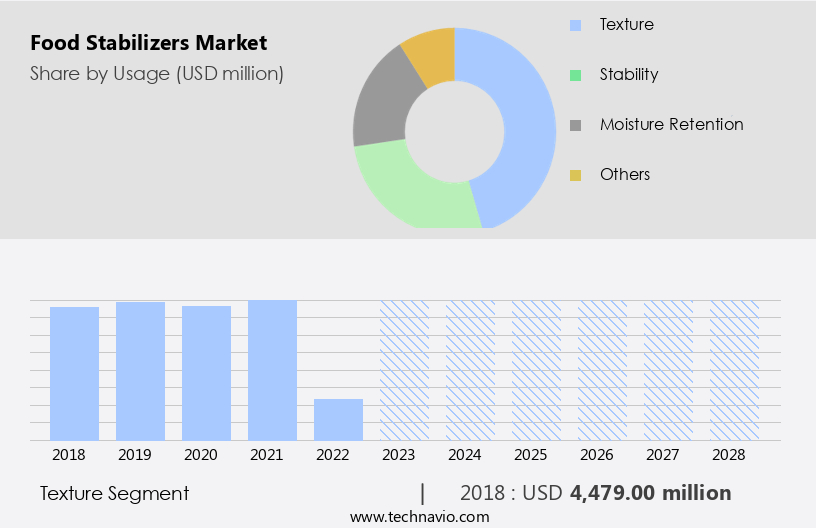
  • Usage
    • Texture
    • Stability
    • Moisture retention
    • Others
  • Application
    • Dairy and dairy products
    • Bakery
    • Confectionery
    • Beverages
    • Sauces and dressings and others
  • Geography
    • Europe
      • Germany
      • UK
      • France
    • North America
      • US
    • APAC
      • China
    • South America
    • Middle East and Africa

By Usage Insights

The texture segment is estimated to witness significant growth during the forecast period. Food stabilizers play a pivotal role in maintaining the desired texture and consistency in various food products, enhancing their overall quality and shelf life. In the global market for food stabilizers, the texture segment holds a substantial position, accounting for a significant market share. Hydrocolloids, proteins, and starches are the primary stabilizers used in this segment, contributing to the creation and preservation of texture in dairy products, sauces, dressings, baked goods, and confectionery items. Hydrocolloids, in particular, are widely utilized due to their ability to form gels, thicken liquids, and stabilize emulsions. These stabilizers provide the desired texture and mouthfeel to food products, ensuring consumer satisfaction.

Pectin, a plant-derived hydrocolloid, is a popular choice for stabilizing acidified milk products, such as yogurt and cheese spreads. Leading food stabilizer manufacturers, including Tate & Lyle and Palsgaard, offer a diverse range of food stabilizer ingredients to cater to the varying texture requirements of different food products. The use of food stabilizers not only enhances the texture and mouthfeel of food products but also extends their shelf life, ensuring consumer satisfaction and trust in the brand.

Food Stabilizers Market Size

Get a glance at the market share of various segments Request Free Sample

The texture segment accounted for USD 4.48 billion in 2018 and showed a gradual increase during the forecast period.

Regional Insights

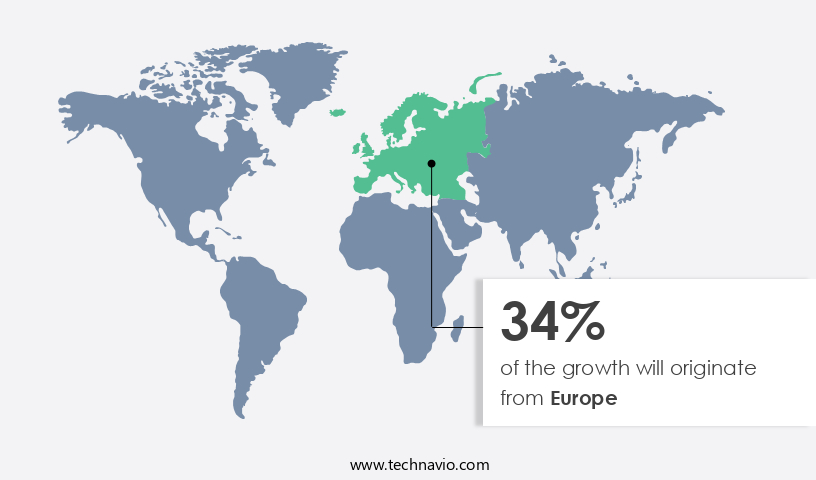
Europe is estimated to contribute 34% to the growth of the global market during the forecast period. Technavio's analysts have elaborately explained the regional trends and drivers that shape the market during the forecast period.

Food Stabilizers Market Share by Geography

For more insights on the market share of various regions Request Free Sample

In the European market, there is a significant increase in the consumption of ready-to-eat (RTE) food products and ready-to-drink (RTD) beverages in countries like Germany, the UK, and France. The popularity of baked goods, confectionery, instant foods, convenient meals, and dairy products is on the rise in this region. This trend is driven in part by the extensive use of food stabilizers, such as hydrocolloids, in these food and beverage items. The National Confectioners Association reports that gummy candies, a popular confectionery item, are a significant contributor to this market. Food stabilizers are essential in maintaining the desired aroma, color, texture, and flavor in these products.

Moreover, the HoReCa (Hotel, Restaurant, and Café) category is a significant consumer of food hydrocolloids due to the high demand for stable and consistent food products in the foodservice industry. For instance, the European foodservice market is expected to grow at a steady pace, with an increasing number of fast-food chains and restaurants opening in the region. According to Flavor and Fragrance, a leading market research firm, McDonald's plans to open 50 new restaurants across the UK during the forecast period, further increasing the demand for food hydrocolloids.

Our researchers analyzed the data with 2023 as the base year, along with the key drivers, trends, and challenges. A holistic analysis of drivers will help companies refine their marketing strategies to gain a competitive advantage.

Market Driver

Rising demand for food stabilizers in convenience foods is the key driver of the market. The consumption of packaged food has experienced significant growth in both developed and emerging economies, leading to an increased demand for food stabilizers. Food stabilizers play a crucial role in preserving the texture, appearance, and shelf life of various food products. In particular, they help prevent ice crystal formation during freezing and fruit settling in beverages. With economic progress and rising disposable income levels, the food market demand for packaged food and processed items has been on the rise. Convenience foods, which are easy to consume, portion-controlled, and have extended shelf life, have gained popularity due to their time-saving and convenient packaging.

Technological advancements in the food industry have expanded the range of convenience foods, offering more options such as microwave-friendly packaging, prepared mixes, and various portion sizes. The global food stabilizer market is expected to continue its growth trajectory, driven by the increasing demand for packaged food and the need to preserve food quality and extend shelf life.

Market Trends

The growing utilization of food stabilizers in gluten-free products is the upcoming trend in the market. The market encompasses a range of applications including jellies, fillings, puddings, marmalades, ice cream, sauces, and soups. These food products require stabilizers to maintain their texture, consistency, and shelf life. Low-calorie and dietetic foods are also included in this market, as stabilizers help to preserve the nutritional value and mouthfeel of these items. Some common food stabilizers are pectin, carrageenan, and xanthan gum. In the US, the demand for gluten-free food products has grown significantly due to the increasing prevalence of Celiac disease. According to the US Department of Health and Human Services (HHS), approximately 2 million Americans have Celiac disease, and about 1% of the global population is affected.

This has resulted in the development and popularity of gluten-free alternatives to traditional food products, such as gluten-free jellies, fillings, puddings, and sauces. These food items often utilize alternative stabilizers, such as cornstarch or guar gum, to replace wheat-based stabilizers. Clean label products, which contain minimal processing and easily recognizable ingredients, are also gaining traction in the market.

Market Challenge

Ethical issues with animal-derived food stabilizers is a key challenge affecting the market growth. Food stabilizers, essential components in processed food products, include traditional hydrocolloids derived from animal sources. These raw materials, such as gelatin from cattle and pig bones, casein from milk, and chitosan from crustacean shells, have been subject to ethical debates due to concerns over animal welfare, environmental impact, and cultural and religious sensitivities. Gelatin, a significant animal-derived food hydrocolloid, is used in various applications, including dressings, sauces, and confectionery items. However, its production involves the utilization of animal byproducts, which can raise ethical questions. Food prices, energy prices, and raw material costs are critical factors influencing the food additives and ingredients industry, including the market for food stabilizers.

Low-income consumers' purchasing power also plays a role in market dynamics. Customized food products, such as beverages and cakes, require stabilizers to maintain their texture and consistency. As consumers demand more natural and sustainable food alternatives, the demand for plant-based food stabilizers is increasing. In conclusion, the use of animal-derived food stabilizers remains a topic of ethical debate due to concerns over animal welfare, environmental impact, and cultural and religious values. The food additives and ingredients industry, including the market for food stabilizers, is influenced by factors such as raw material costs, energy prices, food prices, and consumer preferences.

Exclusive Customer Landscape

The market forecasting report includes the adoption lifecycle of the market, covering from the innovator's stage to the laggard's stage. It focuses on adoption rates in different regions based on penetration. Furthermore, the report also includes key purchase criteria and drivers of price sensitivity to help companies evaluate and develop their market growth analysis strategies.

Food Stabilizers Market Share by Geography

 Customer Landscape

Key Companies & Market Insights

Companies are implementing various strategies, such as strategic alliances, partnerships, mergers and acquisitions, geographical expansion, and product/service launches, to enhance their presence in the market.

Archer Daniels Midland Co: The company offers food-grade emulsifiers and stabilizers such as polyol and lecithin.

The market research and growth report includes detailed analyses of the competitive landscape of the market and information about key companies, including:

  • Arthur Branwell and Co. Ltd.
  • Ashland Inc.
  • Avlast Hydrocolloids
  • Cargill Inc.
  • Condio GmbH
  • Crest Foods Co. Inc.
  • DuPont de Nemours Inc.
  • Fiberstar Inc.
  • Givaudan SA
  • Hydrosol GmbH and Co. KG
  • Ingredion Inc.
  • J M Huber Corp.
  • Kerry Group Plc
  • NEXIRA
  • Palsgaard AS
  • RPM International Inc.
  • Superior sp. z o.o.
  • Tate and Lyle PLC
  • YOGIRAJ RESIN AND POLYCHEM PVT. LTD.

Qualitative and quantitative analysis of companies has been conducted to help clients understand the wider business environment as well as the strengths and weaknesses of key market players. Data is qualitatively analyzed to categorize companies as pure play, category-focused, industry-focused, and diversified; it is quantitatively analyzed to categorize companies as dominant, leading, strong, tentative, and weak.

Research Analyst Overview

Food stabilizers are essential additives used in the production of various packaged food items to maintain their quality and extend their shelf life. The food stabilizer market has seen significant growth due to the increasing demand for preserving foods, especially in economically developing regions where scarce resources make it challenging to ensure food stability. Ice crystal formation and fruit settling are common issues addressed by food stabilizers in products like beverages, cakes, jellies, fillings, puddings, marmalades, ice cream, sauces, and soups. Food stabilizer sales have been influenced by factors such as raw material costs, energy prices, and food prices. Manufacturers have responded by producing customized food products using ingredients like pectin, phosphates, and gums and hydrocolloids derived from plant sources.

Further, the market demand for food stabilizers is driven by the production of processed food products, which include dairy and desserts, bakery/confectionery, meat/poultry, sauces and dressings, quick-service restaurants, savory snacks, gummy candy, and low-calorie or dietetic foods. Consumer preferences for clean label products and acidified milk products have also influenced the food stabilizer market. Texturants, emulsifiers, and stabilizers like hamulsion, alginate, agar, guar gum, cellulose, and cellulose derivatives are widely used to enhance food product quality, including aroma, color, texture, and shelf life. The World Health Organization has set guidelines for the safe use of food additives and food stabilizers, ensuring their continued use in the food industry.

Market Scope

Report Coverage

Details

Page number

190

Base year

2023

Historic period

2018-2022

Forecast period

2024-2028

Growth momentum & CAGR

Accelerate at a CAGR of 4.36%

Market growth 2024-2028

USD 725.8 million

Market structure

Fragmented

YoY growth 2023-2024(%)

4.11

Regional analysis

Europe, North America, APAC, South America, and Middle East and Africa

Performing market contribution

Europe at 34%

Key countries

US, Germany, UK, China, and France

Competitive landscape

Leading Companies, Market Positioning of Companies, Competitive Strategies, and Industry Risks

Key companies profiled

Archer Daniels Midland Co., Arthur Branwell and Co. Ltd., Ashland Inc., Avlast Hydrocolloids, Cargill Inc., Condio GmbH, Crest Foods Co. Inc., DuPont de Nemours Inc., Fiberstar Inc., Givaudan SA, Hydrosol GmbH and Co. KG, Ingredion Inc., J M Huber Corp., Kerry Group Plc, NEXIRA, Palsgaard AS, RPM International Inc., Superior sp. z o.o., Tate and Lyle PLC, and YOGIRAJ RESIN AND POLYCHEM PVT. LTD.

Market dynamics

Parent market analysis, market growth inducers and obstacles, market forecast, fast-growing and slow-growing segment analysis, COVID-19 impact and recovery analysis and future consumer dynamics, market condition analysis for the forecast period

Customization purview

If our market report has not included the data that you are looking for, you can reach out to our analysts and get segments customized.

Request Free Sample

What are the Key Data Covered in this Market Research and Growth Report?

  • CAGR of the market during the forecast period
  • Detailed information on factors that will drive the market growth and forecasting between 2024 and 2028
  • Precise estimation of the size of the market  and its contribution of the market in focus to the parent market
  • Accurate predictions about upcoming market growth and trends and changes in consumer behaviour
  • Growth of the market across Europe, North America, APAC, South America, and Middle East and Africa
  • Thorough analysis of the market's competitive landscape and detailed information about companies
  • Comprehensive analysis of factors that will challenge the growth of market companies

We can help! Our analysts can customize this market research report to meet your requirements. Get in touch

1 Executive Summary

  • 1.1 Market overview
    • Executive Summary - Chart on Market Overview
    • Executive Summary - Data Table on Market Overview
    • Executive Summary - Chart on Global Market Characteristics
    • Executive Summary - Chart on Market by Geography
    • Executive Summary - Chart on Market Segmentation by Usage
    • Executive Summary - Chart on Market Segmentation by Application
    • Executive Summary - Chart on Incremental Growth
    • Executive Summary - Data Table on Incremental Growth
    • Executive Summary - Chart on Company Market Positioning

2 Market Landscape

  • 2.1 Market ecosystem
    • Parent Market
    • Data Table on - Parent Market
  • 2.2 Market characteristics
    • Market characteristics analysis
  • 2.3 Value chain analysis
    • Value Chain Analysis

3 Market Sizing

  • 3.1 Market definition
    • Offerings of companies included in the market definition
  • 3.2 Market segment analysis
    • Market segments
  • 3.3 Market size 2023
    • 3.4 Market outlook: Forecast for 2023-2028
      • Chart on Global - Market size and forecast 2023-2028 ($ million)
      • Data Table on Global - Market size and forecast 2023-2028 ($ million)
      • Chart on Global Market: Year-over-year growth 2023-2028 (%)
      • Data Table on Global Market: Year-over-year growth 2023-2028 (%)

    4 Historic Market Size

    • 4.1 Global Food Stabilizers Market 2018 - 2022
      • Historic Market Size - Data Table on Global Food Stabilizers Market 2018 - 2022 ($ million)
    • 4.2 Usage segment analysis 2018 - 2022
      • Historic Market Size - Usage Segment 2018 - 2022 ($ million)
    • 4.3 Application segment analysis 2018 - 2022
      • Historic Market Size - Application Segment 2018 - 2022 ($ million)
    • 4.4 Geography segment analysis 2018 - 2022
      • Historic Market Size - Geography Segment 2018 - 2022 ($ million)
    • 4.5 Country segment analysis 2018 - 2022
      • Historic Market Size - Country Segment 2018 - 2022 ($ million)

    5 Five Forces Analysis

    • 5.1 Five forces summary
      • Five forces analysis - Comparison between 2023 and 2028
    • 5.2 Bargaining power of buyers
      • Bargaining power of buyers - Impact of key factors 2023 and 2028
    • 5.3 Bargaining power of suppliers
      • Bargaining power of suppliers - Impact of key factors in 2023 and 2028
    • 5.4 Threat of new entrants
      • Threat of new entrants - Impact of key factors in 2023 and 2028
    • 5.5 Threat of substitutes
      • Threat of substitutes - Impact of key factors in 2023 and 2028
    • 5.6 Threat of rivalry
      • Threat of rivalry - Impact of key factors in 2023 and 2028
    • 5.7 Market condition
      • Chart on Market condition - Five forces 2023 and 2028

    6 Market Segmentation by Usage

    • 6.1 Market segments
      • Chart on Usage - Market share 2023-2028 (%)
      • Data Table on Usage - Market share 2023-2028 (%)
    • 6.2 Comparison by Usage
      • Chart on Comparison by Usage
      • Data Table on Comparison by Usage
    • 6.3 Texture - Market size and forecast 2023-2028
      • Chart on Texture - Market size and forecast 2023-2028 ($ million)
      • Data Table on Texture - Market size and forecast 2023-2028 ($ million)
      • Chart on Texture - Year-over-year growth 2023-2028 (%)
      • Data Table on Texture - Year-over-year growth 2023-2028 (%)
    • 6.4 Stability - Market size and forecast 2023-2028
      • Chart on Stability - Market size and forecast 2023-2028 ($ million)
      • Data Table on Stability - Market size and forecast 2023-2028 ($ million)
      • Chart on Stability - Year-over-year growth 2023-2028 (%)
      • Data Table on Stability - Year-over-year growth 2023-2028 (%)
    • 6.5 Moisture retention - Market size and forecast 2023-2028
      • Chart on Moisture retention - Market size and forecast 2023-2028 ($ million)
      • Data Table on Moisture retention - Market size and forecast 2023-2028 ($ million)
      • Chart on Moisture retention - Year-over-year growth 2023-2028 (%)
      • Data Table on Moisture retention - Year-over-year growth 2023-2028 (%)
    • 6.6 Others - Market size and forecast 2023-2028
      • Chart on Others - Market size and forecast 2023-2028 ($ million)
      • Data Table on Others - Market size and forecast 2023-2028 ($ million)
      • Chart on Others - Year-over-year growth 2023-2028 (%)
      • Data Table on Others - Year-over-year growth 2023-2028 (%)
    • 6.7 Market opportunity by Usage
      • Market opportunity by Usage ($ million)
      • Data Table on Market opportunity by Usage ($ million)

    7 Market Segmentation by Application

    • 7.1 Market segments
      • Chart on Application - Market share 2023-2028 (%)
      • Data Table on Application - Market share 2023-2028 (%)
    • 7.2 Comparison by Application
      • Chart on Comparison by Application
      • Data Table on Comparison by Application
    • 7.3 Dairy and dairy products - Market size and forecast 2023-2028
      • Chart on Dairy and dairy products - Market size and forecast 2023-2028 ($ million)
      • Data Table on Dairy and dairy products - Market size and forecast 2023-2028 ($ million)
      • Chart on Dairy and dairy products - Year-over-year growth 2023-2028 (%)
      • Data Table on Dairy and dairy products - Year-over-year growth 2023-2028 (%)
    • 7.4 Bakery - Market size and forecast 2023-2028
      • Chart on Bakery - Market size and forecast 2023-2028 ($ million)
      • Data Table on Bakery - Market size and forecast 2023-2028 ($ million)
      • Chart on Bakery - Year-over-year growth 2023-2028 (%)
      • Data Table on Bakery - Year-over-year growth 2023-2028 (%)
    • 7.5 Confectionery - Market size and forecast 2023-2028
      • Chart on Confectionery - Market size and forecast 2023-2028 ($ million)
      • Data Table on Confectionery - Market size and forecast 2023-2028 ($ million)
      • Chart on Confectionery - Year-over-year growth 2023-2028 (%)
      • Data Table on Confectionery - Year-over-year growth 2023-2028 (%)
    • 7.6 Beverages - Market size and forecast 2023-2028
      • Chart on Beverages - Market size and forecast 2023-2028 ($ million)
      • Data Table on Beverages - Market size and forecast 2023-2028 ($ million)
      • Chart on Beverages - Year-over-year growth 2023-2028 (%)
      • Data Table on Beverages - Year-over-year growth 2023-2028 (%)
    • 7.7 Others - Market size and forecast 2023-2028
      • Chart on Others - Market size and forecast 2023-2028 ($ million)
      • Data Table on Others - Market size and forecast 2023-2028 ($ million)
      • Chart on Others - Year-over-year growth 2023-2028 (%)
      • Data Table on Others - Year-over-year growth 2023-2028 (%)
    • 7.8 Market opportunity by Application
      • Market opportunity by Application ($ million)
      • Data Table on Market opportunity by Application ($ million)

    8 Customer Landscape

    • 8.1 Customer landscape overview
      • Analysis of price sensitivity, lifecycle, customer purchase basket, adoption rates, and purchase criteria

    9 Geographic Landscape

    • 9.1 Geographic segmentation
      • Chart on Market share by geography 2023-2028 (%)
      • Data Table on Market share by geography 2023-2028 (%)
    • 9.2 Geographic comparison
      • Chart on Geographic comparison
      • Data Table on Geographic comparison
    • 9.3 Europe - Market size and forecast 2023-2028
      • Chart on Europe - Market size and forecast 2023-2028 ($ million)
      • Data Table on Europe - Market size and forecast 2023-2028 ($ million)
      • Chart on Europe - Year-over-year growth 2023-2028 (%)
      • Data Table on Europe - Year-over-year growth 2023-2028 (%)
    • 9.4 North America - Market size and forecast 2023-2028
      • Chart on North America - Market size and forecast 2023-2028 ($ million)
      • Data Table on North America - Market size and forecast 2023-2028 ($ million)
      • Chart on North America - Year-over-year growth 2023-2028 (%)
      • Data Table on North America - Year-over-year growth 2023-2028 (%)
    • 9.5 APAC - Market size and forecast 2023-2028
      • Chart on APAC - Market size and forecast 2023-2028 ($ million)
      • Data Table on APAC - Market size and forecast 2023-2028 ($ million)
      • Chart on APAC - Year-over-year growth 2023-2028 (%)
      • Data Table on APAC - Year-over-year growth 2023-2028 (%)
    • 9.6 South America - Market size and forecast 2023-2028
      • Chart on South America - Market size and forecast 2023-2028 ($ million)
      • Data Table on South America - Market size and forecast 2023-2028 ($ million)
      • Chart on South America - Year-over-year growth 2023-2028 (%)
      • Data Table on South America - Year-over-year growth 2023-2028 (%)
    • 9.7 Middle East and Africa - Market size and forecast 2023-2028
      • Chart on Middle East and Africa - Market size and forecast 2023-2028 ($ million)
      • Data Table on Middle East and Africa - Market size and forecast 2023-2028 ($ million)
      • Chart on Middle East and Africa - Year-over-year growth 2023-2028 (%)
      • Data Table on Middle East and Africa - Year-over-year growth 2023-2028 (%)
    • 9.8 US - Market size and forecast 2023-2028
      • Chart on US - Market size and forecast 2023-2028 ($ million)
      • Data Table on US - Market size and forecast 2023-2028 ($ million)
      • Chart on US - Year-over-year growth 2023-2028 (%)
      • Data Table on US - Year-over-year growth 2023-2028 (%)
    • 9.9 Germany - Market size and forecast 2023-2028
      • Chart on Germany - Market size and forecast 2023-2028 ($ million)
      • Data Table on Germany - Market size and forecast 2023-2028 ($ million)
      • Chart on Germany - Year-over-year growth 2023-2028 (%)
      • Data Table on Germany - Year-over-year growth 2023-2028 (%)
    • 9.10 UK - Market size and forecast 2023-2028
      • Chart on UK - Market size and forecast 2023-2028 ($ million)
      • Data Table on UK - Market size and forecast 2023-2028 ($ million)
      • Chart on UK - Year-over-year growth 2023-2028 (%)
      • Data Table on UK - Year-over-year growth 2023-2028 (%)
    • 9.11 China - Market size and forecast 2023-2028
      • Chart on China - Market size and forecast 2023-2028 ($ million)
      • Data Table on China - Market size and forecast 2023-2028 ($ million)
      • Chart on China - Year-over-year growth 2023-2028 (%)
      • Data Table on China - Year-over-year growth 2023-2028 (%)
    • 9.12 France - Market size and forecast 2023-2028
      • Chart on France - Market size and forecast 2023-2028 ($ million)
      • Data Table on France - Market size and forecast 2023-2028 ($ million)
      • Chart on France - Year-over-year growth 2023-2028 (%)
      • Data Table on France - Year-over-year growth 2023-2028 (%)
    • 9.13 Market opportunity by geography
      • Market opportunity by geography ($ million)
      • Data Tables on Market opportunity by geography ($ million)

    10 Drivers, Challenges, and Opportunity/Restraints

    • 10.1 Market drivers
      • 10.2 Market challenges
        • 10.3 Impact of drivers and challenges
          • Impact of drivers and challenges in 2023 and 2028
        • 10.4 Market opportunities/restraints

          11 Competitive Landscape

          • 11.1 Overview
            • 11.2 Competitive Landscape
              • Overview on criticality of inputs and factors of differentiation
            • 11.3 Landscape disruption
              • Overview on factors of disruption
            • 11.4 Industry risks
              • Impact of key risks on business

            12 Competitive Analysis

            • 12.1 Companies profiled
              • Companies covered
            • 12.2 Market positioning of companies
              • Matrix on companies position and classification
            • 12.3 Archer Daniels Midland Co.
              • Archer Daniels Midland Co. - Overview
              • Archer Daniels Midland Co. - Business segments
              • Archer Daniels Midland Co. - Key news
              • Archer Daniels Midland Co. - Key offerings
              • Archer Daniels Midland Co. - Segment focus
            • 12.4 Arthur Branwell and Co. Ltd.
              • Arthur Branwell and Co. Ltd. - Overview
              • Arthur Branwell and Co. Ltd. - Product / Service
              • Arthur Branwell and Co. Ltd. - Key offerings
            • 12.5 Ashland Inc.
              • Ashland Inc. - Overview
              • Ashland Inc. - Business segments
              • Ashland Inc. - Key news
              • Ashland Inc. - Key offerings
              • Ashland Inc. - Segment focus
            • 12.6 Cargill Inc.
              • Cargill Inc. - Overview
              • Cargill Inc. - Product / Service
              • Cargill Inc. - Key news
              • Cargill Inc. - Key offerings
            • 12.7 Condio GmbH
              • Condio GmbH - Overview
              • Condio GmbH - Product / Service
              • Condio GmbH - Key offerings
            • 12.8 Crest Foods Co. Inc.
              • Crest Foods Co. Inc. - Overview
              • Crest Foods Co. Inc. - Product / Service
              • Crest Foods Co. Inc. - Key offerings
            • 12.9 DuPont de Nemours Inc.
              • DuPont de Nemours Inc. - Overview
              • DuPont de Nemours Inc. - Business segments
              • DuPont de Nemours Inc. - Key news
              • DuPont de Nemours Inc. - Key offerings
              • DuPont de Nemours Inc. - Segment focus
            • 12.10 Fiberstar Inc.
              • Fiberstar Inc. - Overview
              • Fiberstar Inc. - Product / Service
              • Fiberstar Inc. - Key offerings
            • 12.11 Hydrosol GmbH and Co. KG
              • Hydrosol GmbH and Co. KG - Overview
              • Hydrosol GmbH and Co. KG - Product / Service
              • Hydrosol GmbH and Co. KG - Key offerings
            • 12.12 Ingredion Inc.
              • Ingredion Inc. - Overview
              • Ingredion Inc. - Business segments
              • Ingredion Inc. - Key news
              • Ingredion Inc. - Key offerings
              • Ingredion Inc. - Segment focus
            • 12.13 J M Huber Corp.
              • J M Huber Corp. - Overview
              • J M Huber Corp. - Product / Service
              • J M Huber Corp. - Key news
              • J M Huber Corp. - Key offerings
            • 12.14 Kerry Group Plc
              • Kerry Group Plc - Overview
              • Kerry Group Plc - Business segments
              • Kerry Group Plc - Key news
              • Kerry Group Plc - Key offerings
              • Kerry Group Plc - Segment focus
            • 12.15 NEXIRA
              • NEXIRA - Overview
              • NEXIRA - Product / Service
              • NEXIRA - Key news
              • NEXIRA - Key offerings
            • 12.16 Palsgaard AS
              • Palsgaard AS - Overview
              • Palsgaard AS - Product / Service
              • Palsgaard AS - Key offerings
            • 12.17 Tate and Lyle PLC
              • Tate and Lyle PLC - Overview
              • Tate and Lyle PLC - Business segments
              • Tate and Lyle PLC - Key news
              • Tate and Lyle PLC - Key offerings
              • Tate and Lyle PLC - Segment focus

            13 Appendix

            • 13.1 Scope of the report
              • 13.2 Inclusions and exclusions checklist
                • Inclusions checklist
                • Exclusions checklist
              • 13.3 Currency conversion rates for US$
                • Currency conversion rates for US$
              • 13.4 Research methodology
                • Research methodology
              • 13.5 Data procurement
                • Information sources
              • 13.6 Data validation
                • Data validation
              • 13.7 Validation techniques employed for market sizing
                • Validation techniques employed for market sizing
              • 13.8 Data synthesis
                • Data synthesis
              • 13.9 360 degree market analysis
                • 360 degree market analysis
              • 13.10 List of abbreviations
                • List of abbreviations

              Research Methodology

              Technavio presents a detailed picture of the market by way of study, synthesis, and summation of data from multiple sources. The analysts have presented the various facets of the market with a particular focus on identifying the key industry influencers. The data thus presented is comprehensive, reliable, and the result of extensive research, both primary and secondary.

              INFORMATION SOURCES

              Primary sources

              • Manufacturers and suppliers
              • Channel partners
              • Industry experts
              • Strategic decision makers

              Secondary sources

              • Industry journals and periodicals
              • Government data
              • Financial reports of key industry players
              • Historical data
              • Press releases

              DATA ANALYSIS

              Data Synthesis

              • Collation of data
              • Estimation of key figures
              • Analysis of derived insights

              Data Validation

              • Triangulation with data models
              • Reference against proprietary databases
              • Corroboration with industry experts

              REPORT WRITING

              Qualitative

              • Market drivers
              • Market challenges
              • Market trends
              • Five forces analysis

              Quantitative

              • Market size and forecast
              • Market segmentation
              • Geographical insights
              • Competitive landscape

              Interested in this report?

              Get your sample now to see our research methodology and insights!

              Download Now

              Frequently Asked Questions

              Food Stabilizers market growth will increase by $ 725.8 mn during 2024-2028 .

              The Food Stabilizers market is expected to grow at a CAGR of 4.36% during 2024-2028 .

              Food Stabilizers market is segmented by Usage( Texture, Stability, Moisture retention, Others) Application( Dairy and dairy products, Bakery, Confectionery, Beverages, Sauces and dressings and others)

              Archer Daniels Midland Co., Arthur Branwell and Co. Ltd., Ashland Inc., Avlast Hydrocolloids, Cargill Inc., Condio GmbH, Crest Foods Co. Inc., DuPont de Nemours Inc., Fiberstar Inc., Givaudan SA, Hydrosol GmbH and Co. KG, Ingredion Inc., J M Huber Corp., Kerry Group Plc, NEXIRA, Palsgaard AS, RPM International Inc., Superior sp. z o.o., Tate and Lyle PLC, YOGIRAJ RESIN AND POLYCHEM PVT. LTD. are a few of the key vendors in the Food Stabilizers market.

              Europe will register the highest growth rate of 34% among the other regions. Therefore, the Food Stabilizers market in Europe is expected to garner significant business opportunities for the vendors during the forecast period.

              US, Germany, UK, China, France

              • Rising demand for food stabilizers in convenience foodsA rise in the demand for packaged food products among consumers across developed and developing countries has propelled the demand for food stabilizers. With economic conditions and disposable income levels improving in developed and developing nations is the driving factor this market.
              • the global demand for packaged food and processed food has been increasing. This category of food is called convenience food because it is easy to consume is the driving factor this market.
              • portion-packaged is the driving factor this market.
              • timesaving is the driving factor this market.
              • and freeze- or thaw-stable and has convenient packaging. Technological advances in the packaging industry have enabled convenience foods to expand from just frozen is the driving factor this market.
              • chilled is the driving factor this market.
              • and shelf-stable varieties to become more diversified in terms of portion size is the driving factor this market.
              • microwave-friendly packaging is the driving factor this market.
              • prepared mixes is the driving factor this market.
              • and others. Food stabilizers are used extensively in a wide variety of convenience foods ranging from dressings and emulsified sauces and marinades to margarine and spreads. For instance is the driving factor this market.
              • Cargill offers pectin for various convenience foods is the driving factor this market.
              • while Herbstreith & Fox offers Amid CF 010 pectin for improving the water-binding capacity and texture of crème fraîche and mayonnaise. Further is the driving factor this market.
              • it helps enhance the spreadability of low-fat margarine. Therefore is the driving factor this market.
              • the functional properties of food stabilizers are driving their demand for use in convenience foods.The demand for frozen foods and packaged products has been on the rise for the past decade. Urbanization has resulted in changing dietary habits. The urbanized global population is inclined toward packaged food products and frozen foods. An expanding global middle-class population and an increase in the number of working women contribute to the high demand for processed and packaged foods. A long shelf-life is a key advantage of frozen foods. Frozen-food manufacturers employ innovative ways to improve the shelf life of frozen food products. In frozen meat and frozen RTE meals is the driving factor this market.
              • food stabilizers are added for emulsion and stabilization purposes. This improves the shelf life of the respective products. Thus is the driving factor this market.
              • there is an increase in the use of food stabilizers in frozen food products. The biggest market in the world for convenience food is the US is the driving factor this market.
              • and it is expected to remain at the top due to the increasing demand for instant food products for preparing meals is the driving factor this market.
              • especially among the youth. According to research studies is the driving factor this market.
              • the average American eats around six convenience foods per day. Thus is the driving factor this market.
              • the growing popularity of convenience food will spur the growth of the global food stabilizers market during the forecast period.??????? is the driving factor this market.

              The Food Stabilizers market vendors should focus on grabbing business opportunities from the Texture segment as it accounted for the largest market share in the base year.