
US Foodservice Tea Market Size 2026-2030
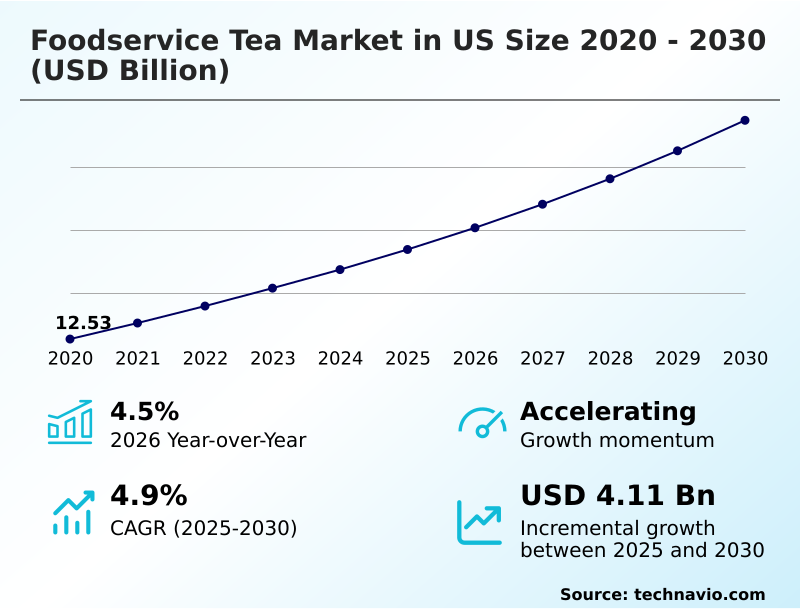
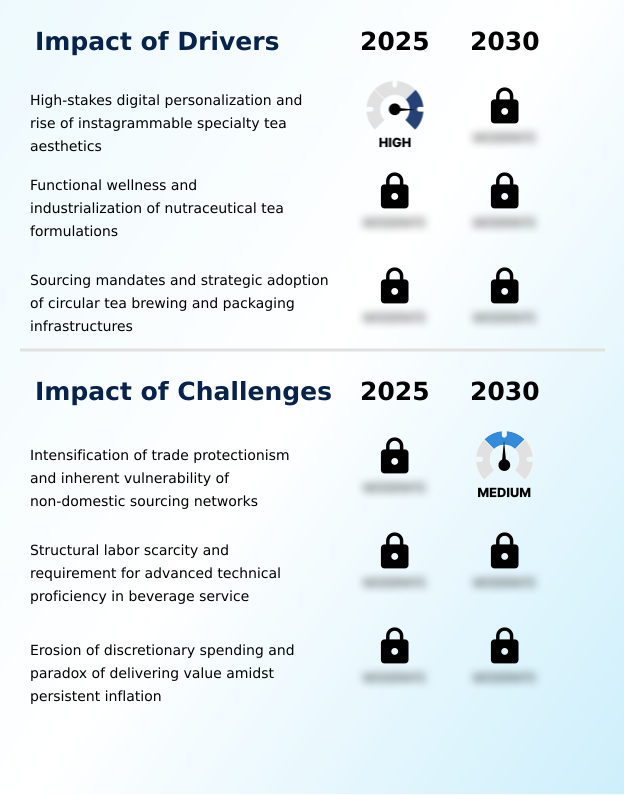
The us foodservice tea market size is valued to increase by USD 4.11 billion, at a CAGR of 4.9% from 2025 to 2030. High-stakes digital personalization and rise of instagrammable specialty tea aesthetics will drive the us foodservice tea market.
Major Market Trends & Insights
- By Distribution Channel - Full-service restaurants segment was valued at USD 7.12 billion in 2024
- By Product - Black tea segment accounted for the largest market revenue share in 2024
Market Size & Forecast
- Market Opportunities: USD 6.96 billion
- Market Future Opportunities: USD 4.11 billion
- CAGR from 2025 to 2030 : 4.9%
Market Summary
- The foodservice tea market in US is undergoing a significant transformation, moving beyond a commodity-based model to one centered on premium, functional, and experiential offerings. This evolution is driven by a consumer shift toward holistic wellness and the sober-curious movement, positioning tea as a sophisticated alternative to both sugary soft drinks and coffee.
- Key to this transition is the adoption of advanced preparation methods, including precision brewing technology and nitrogen-infusion taps, which deliver consistent, high-quality results. Operators are diversifying menus with high-margin products like ceremonial-grade matcha, hojicha roasted profiles, and functional botanical infusions.
- For instance, a full-service restaurant chain might implement automated dispensing systems for its single-origin tea sourcing program, reducing product waste from inconsistent manual brewing by over 15%. However, the industry contends with challenges such as the need for staff with tea sommelier proficiency and margin pressure from the high cost of high-purity botanicals.
- Success hinges on balancing artisanal tea craftsmanship with scalable, efficient operations, using AI-driven flavor profiling and data-backed tea programs to meet the nuanced demands of a discerning consumer base, from custom bubble tea to loaded tea formulations.
What will be the Size of the US Foodservice Tea Market during the forecast period?
Get Key Insights on Market Forecast (PDF) Get Free Sample
How is the US Foodservice Tea Market Segmented?
The us foodservice tea industry research report provides comprehensive data (region-wise segment analysis), with forecasts and estimates in "USD million" for the period 2026-2030, as well as historical data from 2020-2024 for the following segments.
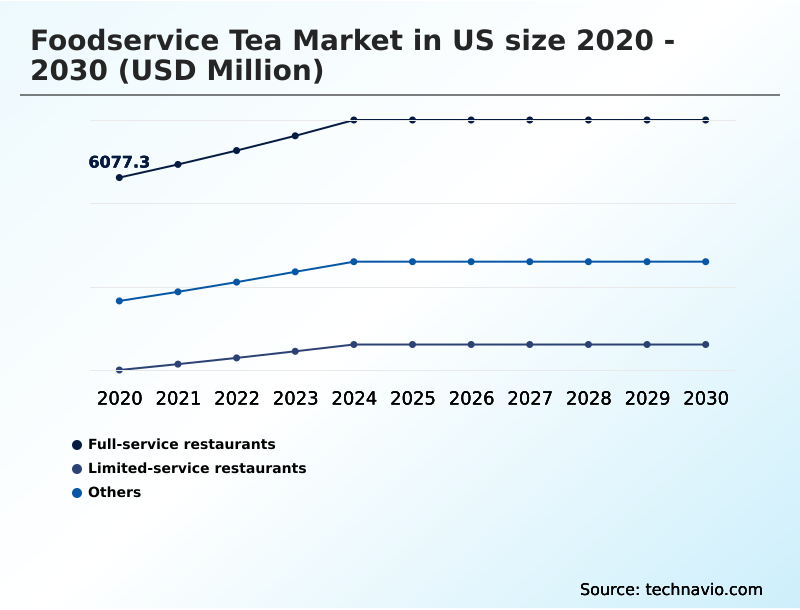
- Distribution channel
- Full-service restaurants
- Limited-service restaurants
- Others
- Product
- Black tea
- Green tea
- Others
- Application
- Iced tea
- Hot tea
- Blended drinks
- Geography
- North America
- US
- North America
By Distribution Channel Insights
The full-service restaurants segment is estimated to witness significant growth during the forecast period.
The full-service restaurant segment is emphasizing dining experience premiumization, positioning tea as a sophisticated component of the meal.
Operators are adopting single-origin tea sourcing and artisanal tea craftsmanship to justify higher price points, aligning with consumer demand for transparent, climate-smart supply chains.
These establishments are integrating advanced precision brewing technology and sometimes even nitrogen-infusion taps to ensure a consistent, high-quality beverage that is difficult to replicate at home.
This strategic pivot toward high-margin, experiential offerings is a response to evolving consumer preferences, where the narrative and preparation of the beverage are as important as the taste.
For these venues, menu engineering now often includes pairings and functional botanical infusions, catering to a clientele whose spending habits show a decline in growth at roughly twice the rate of transaction growth, indicating more deliberate purchasing decisions.
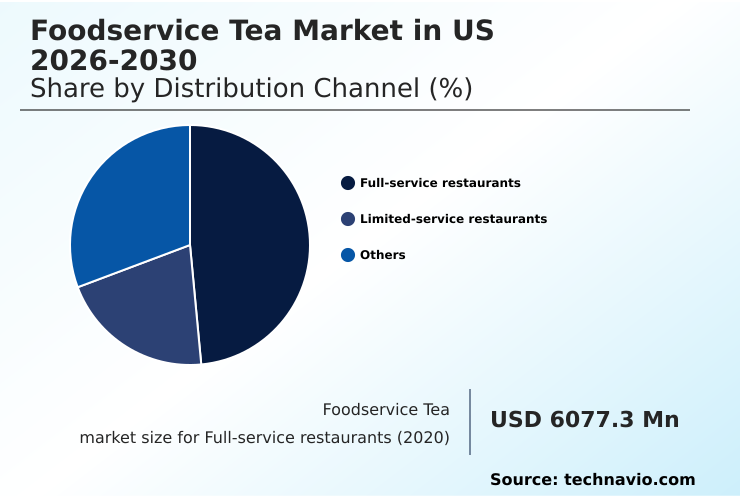
The Full-service restaurants segment was valued at USD 7.12 billion in 2024 and showed a gradual increase during the forecast period.
Market Dynamics
Our researchers analyzed the data with 2025 as the base year, along with the key drivers, trends, and challenges. A holistic analysis of drivers will help companies refine their marketing strategies to gain a competitive advantage.
- Operators in the foodservice tea market in US are navigating a complex environment that demands strategic investments in both product and process. The impact of automated brewing on consistency is a primary consideration, as it directly addresses labor shortages and consumer expectations for quality.
- To capture younger demographics, creating an instagrammable tea for gen z engagement through vibrant colors and unique toppings has become essential. Simultaneously, the demand for functional tea for cognitive health support is pushing menus toward incorporating adaptogens and nootropics. Many businesses are exploring private label tea program development to create unique brand identities and control quality.
- A key operational goal is to reduce bitterness with cold-brew techniques, which yields a smoother product that commands a premium. For upscale venues, the role of nitrogen infusion in mouthfeel is a critical differentiator, while training staff on artisanal tea service becomes paramount. Developing low-caffeine roasted tea profiles caters to a broader audience seeking sophisticated flavors.
- On the operational side, optimizing temperature for oolong extraction ensures that high-cost ingredients are not wasted. Businesses targeting corporate clients must focus on sustainable sourcing for corporate dining, which often includes the cost-benefit of biodegradable packaging. Marketing loaded teas to fitness consumers opens a new revenue stream, while the technology for bubble tea customization allows for high-margin personalization at scale.
- Managing the supply chain for single-origin varietals and integrating adaptogens into beverage menus requires significant expertise, with successful implementation often leading to market advantages that are more than twice as effective as generic offerings.
What are the key market drivers leading to the rise in the adoption of US Foodservice Tea Industry?
- High-stakes digital personalization, combined with the rise of 'Instagrammable' specialty tea aesthetics, is a key driver propelling market growth, particularly among younger consumer demographics.
- Growth is primarily driven by evolving consumer values that prioritize personalization, wellness, and sustainability.
- The rise of specialty tea aesthetics and the 'little treat culture' on social media makes visually appealing beverages like those with cheese-foam toppings critical for attracting younger demographics.
- This digital engagement translates directly into foot traffic, with customized beverage orders placed through digital ordering ecosystems growing 25% faster than in-store orders.
- Concurrently, the demand for functional beverages is compelling operators to adopt data-backed tea programs featuring high-purity botanicals and adaptogens.
- A third major driver is the enforcement of institutional procurement mandates for sustainable and ethical sourcing, pushing the industry toward regenerative agriculture standards and circular tea packaging, which resonates strongly with environmentally conscious consumers and reinforces brand value.
What are the market trends shaping the US Foodservice Tea Industry?
- The market is witnessing a structural shift toward the institutionalization of functional fortification. This involves the widespread integration of nutraceutical tea infusions designed to deliver specific health benefits.
- Key market trends are centered on the institutionalization of functional and experiential beverages. The proliferation of nutraceutical tea formulations is shifting menus toward evidence-based menu engineering, where ingredients are chosen for specific health outcomes. This is exemplified by the rise of loaded teas and veggie tea hybrids.
- Technologically, the adoption of software-defined brewing and AI-driven flavor profiling is enabling operators to deliver artisanal-quality beverages at scale, a crucial advantage as labor shortages persist. For instance, automated platforms can ensure bioactive compound preservation in delicate green teas with an accuracy rate over 30% higher than manual methods.
- The expansion of globalized varieties, such as nutty hojicha roasted profiles and savory flavor mashups, is diversifying palates and creating new daypart menu targeting opportunities, moving tea into the third space market share traditionally held by other beverages.
What challenges does the US Foodservice Tea Industry face during its growth?
- The intensification of trade protectionism and the inherent vulnerability of non-domestic sourcing networks present a key challenge to the industry's growth and supply chain stability.
- The market faces significant headwinds from supply chain vulnerabilities, labor shortages, and economic pressures. Heavy reliance on non-domestic sourcing networks makes the industry susceptible to trade protectionism, with recent tariffs causing procurement costs for some specialty teas and botanicals to increase by nearly 15%.
- This margin compression is exacerbated by a structural labor scarcity; nearly three-quarters of operators report difficulty hiring staff with the tea sommelier proficiency needed for high-touch beverage service. Furthermore, persistent inflation, reflected in a 4% rise in the food away from home price index, is eroding discretionary spending.
- This forces operators to balance the premiumization trend with consumer price sensitivity, a challenge that threatens the profitability of establishments unable to optimize their direct-store delivery systems and operational costs.
Exclusive Technavio Analysis on Customer Landscape
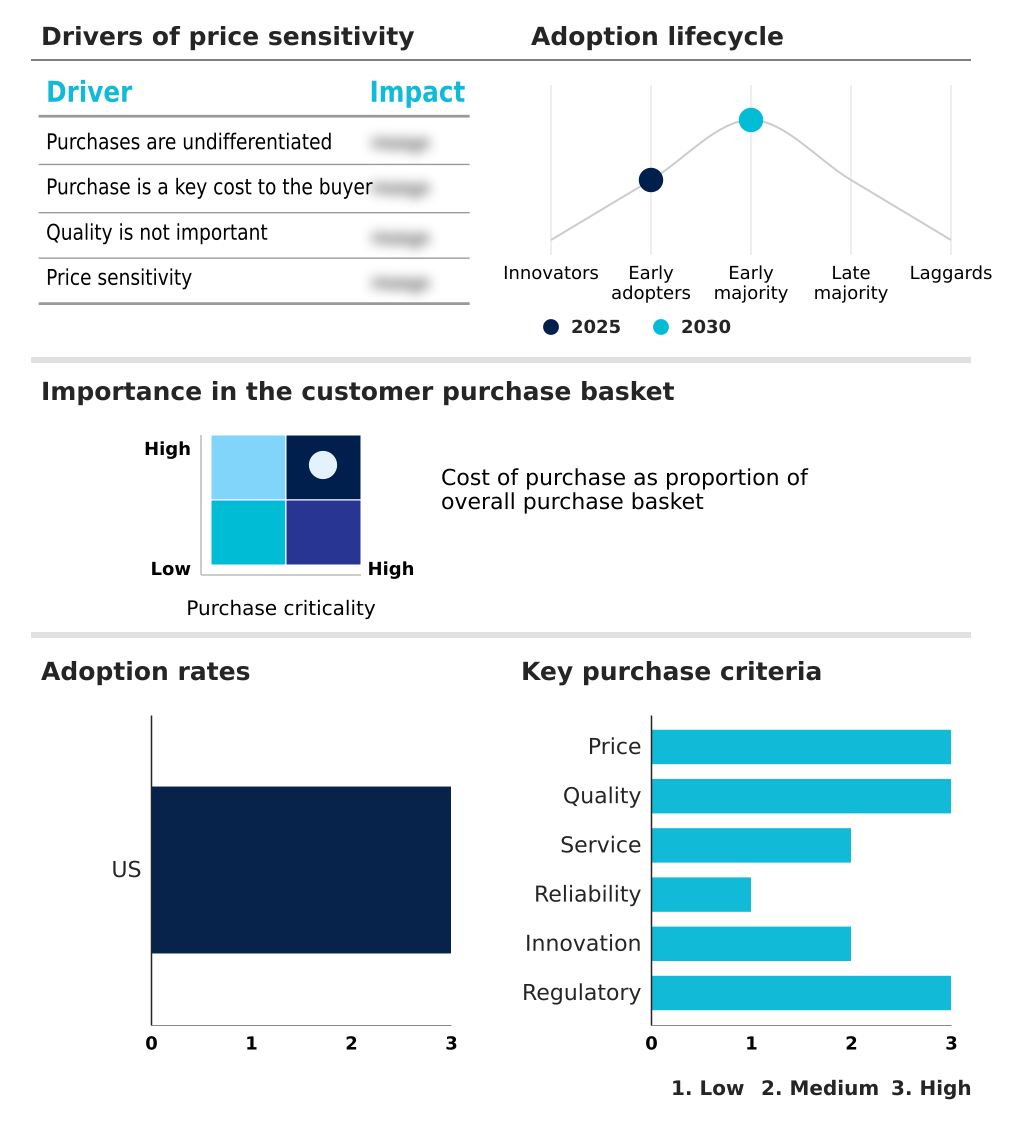
The us foodservice tea market forecasting report includes the adoption lifecycle of the market, covering from the innovator’s stage to the laggard’s stage. It focuses on adoption rates in different regions based on penetration. Furthermore, the us foodservice tea market report also includes key purchase criteria and drivers of price sensitivity to help companies evaluate and develop their market growth analysis strategies.
Customer Landscape of US Foodservice Tea Industry
Competitive Landscape
Companies are implementing various strategies, such as strategic alliances, us foodservice tea market forecast, partnerships, mergers and acquisitions, geographical expansion, and product/service launches, to enhance their presence in the industry.
Anchor Hocking Foodservice - The company provides a portfolio of branded black and specialty teas tailored for diverse foodservice channels and consumer preferences.
The industry research and growth report includes detailed analyses of the competitive landscape of the market and information about key companies, including:
- Anchor Hocking Foodservice
- Aroma Israel
- Associated British Foods Plc
- Azadea Group
- Bigelow Tea
- Harney and Sons Fine Teas
- Harris Freeman and Co. Inc.
- Inspire Brands Inc.
- Lipton Teas and Infusions
- Numi Inc.
- Oliver Pluff and Co.
- Oribe Tea LLC
- Palais des Thes
- Starbucks Corp.
- Tata Consumer Products Ltd.
- Teatulia Organic Teas
- The Hain Celestial Group
- TreeHouse Foods Inc.
- Yamamotoyama Co. Ltd.
Qualitative and quantitative analysis of companies has been conducted to help clients understand the wider business environment as well as the strengths and weaknesses of key industry players. Data is qualitatively analyzed to categorize companies as pure play, category-focused, industry-focused, and diversified; it is quantitatively analyzed to categorize companies as dominant, leading, strong, tentative, and weak.
Recent Development and News in Us foodservice tea market
- In October, 2024, Royal Cup Inc. announced it entered a definitive agreement to acquire assets from Farmer Brothers Co., a strategic move aimed at streamlining national distribution for foodservice tea and coffee programs across hospitality and healthcare sectors.
- In November, 2024, HTeaO unveiled an aggressive expansion plan to open over forty new franchise locations by the end of 2025, significantly increasing its retail footprint in the iced tea-centric markets of the southern and southwestern United States.
- In January, 2025, Starbucks Corp. added an unsweetened matcha powder to its permanent menu, allowing for greater beverage customization and directly addressing consumer demand for low-sugar, functional beverage options.
- In March, 2025, The Coffee Bean & Tea Leaf debuted its new Cold Brew Energy Teas as an official sponsor of a major metropolitan marathon, targeting performance-oriented consumers and expanding its presence in the functional beverage category.
Dive into Technavio’s robust research methodology, blending expert interviews, extensive data synthesis, and validated models for unparalleled US Foodservice Tea Market insights. See full methodology.
| Market Scope | |
|---|---|
| Page number | 183 |
| Base year | 2025 |
| Historic period | 2020-2024 |
| Forecast period | 2026-2030 |
| Growth momentum & CAGR | Accelerate at a CAGR of 4.9% |
| Market growth 2026-2030 | USD 4110.4 million |
| Market structure | Fragmented |
| YoY growth 2025-2026(%) | 4.5% |
| Key countries | US |
| Competitive landscape | Leading Companies, Market Positioning of Companies, Competitive Strategies, and Industry Risks |
Research Analyst Overview
- The foodservice tea market in US is maturing beyond simple beverage service into a sophisticated sector defined by functional innovation and operational technology. The integration of functional botanical infusions, ceremonial-grade matcha, and loaded tea formulations reflects a strategic pivot to meet wellness demands.
- This requires investment in precision brewing technology and automated dispensing systems to manage complex preparations like those involving delicate matcha powder formulation or specific tea-to-milk ratio control. Operators are leveraging nitrogen-infusion taps and developing cold-brew tea concentrate to create premium products.
- However, sourcing remains a critical challenge, with a focus on single-origin tea sourcing, regenerative agriculture standards, and climate-smart supply chains to ensure access to high-purity botanicals and plastic-free sachet technology. Boardroom decisions are increasingly centered on product strategy that balances the appeal of hojicha roasted profiles and bubble tea customization with the operational complexities of preserving bioactive compounds.
- With establishments reporting that over 70% of hiring managers face challenges recruiting staff with specialized beverage knowledge, the adoption of AI-driven flavor profiling and technologies that support artisanal tea craftsmanship at scale is no longer optional but essential for competitive survival.
What are the Key Data Covered in this US Foodservice Tea Market Research and Growth Report?
-
What is the expected growth of the US Foodservice Tea Market between 2026 and 2030?
-
USD 4.11 billion, at a CAGR of 4.9%
-
-
What segmentation does the market report cover?
-
The report is segmented by Distribution Channel (Full-service restaurants, Limited-service restaurants, and Others), Product (Black tea, Green tea, and Others), Application (Iced tea, Hot tea, and Blended drinks) and Geography (North America)
-
-
Which regions are analyzed in the report?
-
North America
-
-
What are the key growth drivers and market challenges?
-
High-stakes digital personalization and rise of instagrammable specialty tea aesthetics, Intensification of trade protectionism and inherent vulnerability of non-domestic sourcing networks
-
-
Who are the major players in the US Foodservice Tea Market?
-
Anchor Hocking Foodservice, Aroma Israel, Associated British Foods Plc, Azadea Group, Bigelow Tea, Harney and Sons Fine Teas, Harris Freeman and Co. Inc., Inspire Brands Inc., Lipton Teas and Infusions, Numi Inc., Oliver Pluff and Co., Oribe Tea LLC, Palais des Thes, Starbucks Corp., Tata Consumer Products Ltd., Teatulia Organic Teas, The Hain Celestial Group, TreeHouse Foods Inc. and Yamamotoyama Co. Ltd.
-
Market Research Insights
- Market dynamics are shaped by a pivot toward away-from-home tea consumption that prioritizes health and experience. The premiumization trend is evident as consumers seek sober-curious beverage alternatives, driving demand for complex nutraceutical tea formulations. This shift requires operators to invest in beverage menu engineering and staff training to deliver high-touch beverage service.
- However, this investment occurs in a challenging environment where nearly three-quarters of operators report significant difficulty recruiting skilled personnel. Furthermore, while the food away from home price index continues to rise, consumer spending growth is declining at roughly twice the rate of transaction growth, forcing operators to deliver perceived value.
- This economic pressure compels a focus on efficient direct-store delivery systems and contactless beverage delivery to manage costs while satisfying demand for experiential tea culture.
We can help! Our analysts can customize this us foodservice tea market research report to meet your requirements.
 RIA -
RIA - 
