Frac Stack Market Analysis North America, Europe, APAC, South America, Middle East and Africa - US, China, Canada, Argentina, Australia - Size and Forecast 2024-2028

Frac Stack Market Analysis North America, Europe, APAC, South America, Middle East and Africa - US, China, Canada, Argentina, Australia - Size and Forecast 2024-2028

Published: Jun 2024 166 Pages SKU: IRTNTR75483

Market Overview at a Glance

$8.49 B
Market Opportunity
4.36%
CAGR
4.11
YoY growth 2023-2024(%)

Frac Stack Market Size 2024-2028

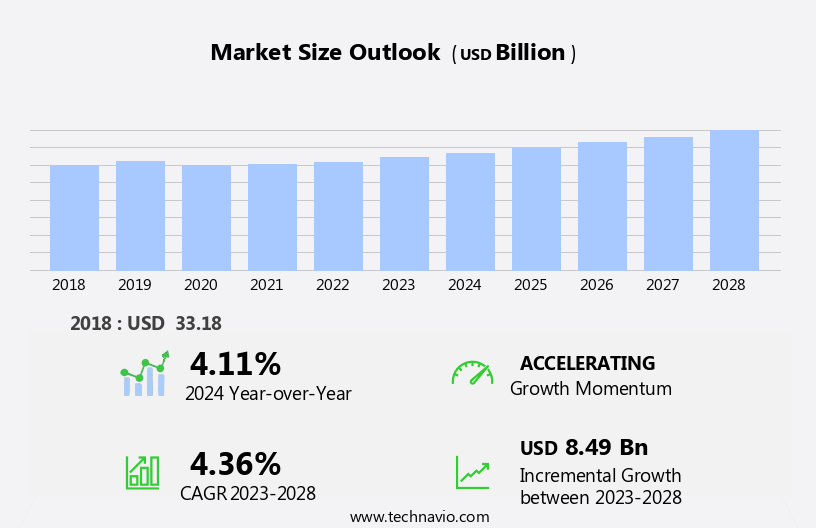
The frac stack market size is forecast to increase by USD 8.49 billion at a CAGR of 4.36% between 2023 and 2028.

  • The market is experiencing significant growth, driven by the abundance of unconventional oil and gas resources. This trend is particularly prominent in regions with large shale formations, such as the United States and Canada. A key driver for market expansion is the increasing adoption of green fracking methods, which aim to reduce the environmental impact of hydraulic fracturing processes. However, regulatory hurdles and supply chain inconsistencies temper growth potential. Regulatory frameworks, both domestically and internationally, continue to evolve in response to environmental concerns associated with hydraulic fracturing. These regulations can impact adoption rates and add complexity to market dynamics.
  • Additionally, the supply chain for frac stack components is subject to inconsistencies, with fluctuations in raw material prices and logistical challenges impacting production schedules and costs. Companies seeking to capitalize on market opportunities must navigate these challenges effectively, while also staying abreast of regulatory developments and technological advancements. Overall, the market presents significant growth potential, particularly for those able to address these challenges and offer innovative solutions that enhance operational efficiency and reduce environmental impact.

What will be the Size of the Frac Stack Market during the forecast period?

Frac Stack Market Size

 Request Free Sample

  • In the market, carbon footprint reduction is a significant trend as operators seek to minimize environmental impact. Fracture characterization plays a crucial role in optimizing production forecasting by providing insights into proppant properties, fluid rheology, and fracture network complexity. Frac stack modularity enables logistics optimization and remote control of wellsite operations, while energy efficiency gains are achieved through pumping schedule optimization and high-pressure system design. Maintenance scheduling and spare parts management are essential for ensuring equipment upgrades and maintaining optimal frac stack capacity. Safety procedures are a priority, with data analytics and predictive modeling used to assess environmental impact and fracturing design.
  • Hydraulic fracture simulation and downhole monitoring are essential for optimizing stimulation efficiency and fracture mechanics. Flowback management and proppant distribution are critical aspects of frac stack design, with automation technology and on-site blending used to improve efficiency and chemical compatibility. Stage spacing and pumping schedule adjustments are made based on fracture width and reservoir engineering analysis. Fracturing pressure is closely monitored to ensure safe and effective operations, with real-time data analytics and downhole monitoring providing valuable insights.

How is this Frac Stack Industry segmented?

The frac stack industry research report provides comprehensive data (region-wise segment analysis), with forecasts and estimates in "USD billion" for the period 2024-2028, as well as historical data from 2018-2022 for the following segments.

  • Deployment
    • Onshore
    • Offshore
  • Type
    • Horizontal and deviated
    • Vertical
  • Geography
    • North America
      • US
      • Canada
    • APAC
      • Australia
      • China
    • South America
      • Argentina
    • Rest of World (ROW)

    By Deployment Insights

    The onshore segment is estimated to witness significant growth during the forecast period.

    Onshore oil and gas production plays a significant role in global energy supply, with lower operating costs compared to offshore projects. The increasing demand for profitability in onshore exploration and production (E&P) projects has led to a surge in frac stack adoption. Frac stacks are essential for pressure control, safety protocols, and performance improvement during hydraulic fracturing, a critical process in extracting unconventional resources like shale gas. Technological advancements have been instrumental in optimizing well completions and production operations. Major players in the energy sector, including the US, Canada, China, and Argentina, are investing in unconventional resources to meet the growing energy demand.

    These countries have vast reserves of unconventional oil and gas and recognize the potential for cost reduction and operational efficiency through the application of technology. Data acquisition and stage optimization are crucial aspects of frac stack design, enabling real-time monitoring and predictive maintenance. Digital transformation, including the adoption of digital technologies like remote operations, fluid dynamics, and reservoir simulation, is essential for improving hydraulic fracturing efficiency and reducing downtime. Proppant selection, fluid management, and pressure containment are essential elements of frac stack design, ensuring wellbore integrity and emission reduction. Rock mechanics and sustainable operations are also essential considerations for maximizing asset optimization and lifecycle management.

    The cost of ownership for frac stacks is a critical factor in their adoption, with supply chain management and cost reduction being key areas of focus. Chemical additives and blending systems play a role in enhancing hydraulic efficiency and production enhancement. Pressure vessels and well stimulation are other essential components of frac stack design, ensuring efficient pumping units and equipment reliability. In conclusion, the market is experiencing significant growth due to the increasing demand for cost-effective onshore oil and gas production. Technological advancements in areas like fracture modeling, data acquisition, and remote monitoring are driving innovation and improving operational efficiency.

    The adoption of sustainable practices and the focus on reducing emissions are also essential trends in the market.

    Frac Stack Market Size

    Request Free Sample

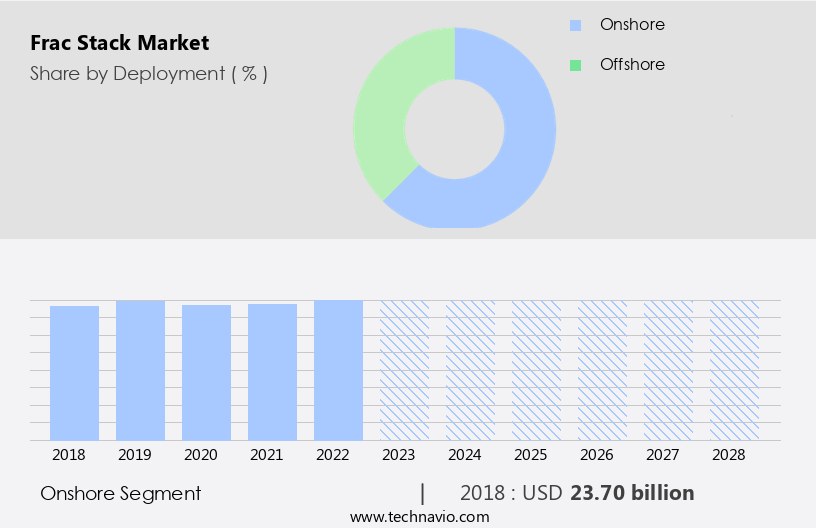
    The Onshore segment was valued at USD 23.70 billion in 2018 and showed a gradual increase during the forecast period.
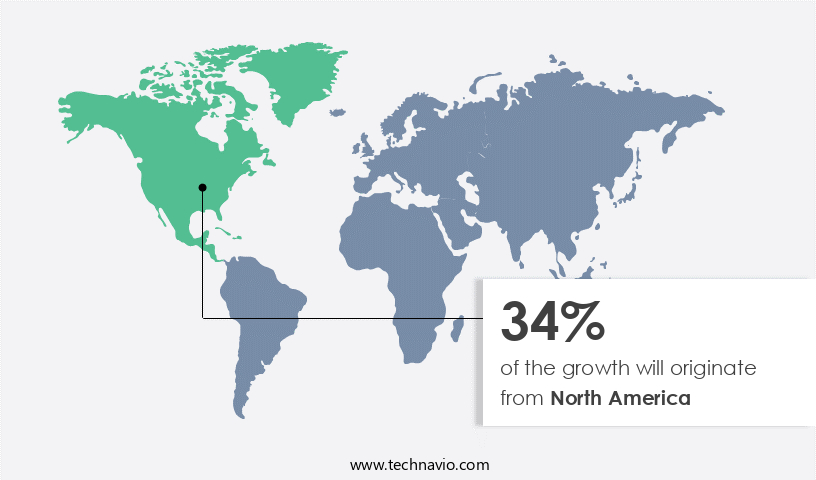
    Regional Analysis

    North America is estimated to contribute 34% to the growth of the global market during the forecast period.Technavio’s analysts have elaborately explained the regional trends and drivers that shape the market during the forecast period.

    Frac Stack Market Share by Geography

    Download Free Sample Report

    Unconventional oil and gas production in North America is primarily driven by the adoption of hydraulic fracturing and horizontal drilling techniques, making it the largest market for frac stacks. With over 772 rigs in the US alone dedicated to horizontal drilling in March 2020, the region's reliance on frac stacks for extracting shale gas is evident. The high prevalence of unconventional reserves in countries such as the US, Canada, and Argentina contributes to the widespread use of frac stacks. Frac stacks play a crucial role in the production process, ensuring pressure control, safety protocols, and performance improvement. Fracture modeling and optimization are integral to frac stack design, enhancing hydraulic fracturing efficiency and reducing downtime.

    Fluid management, including proppant selection and chemical additives, is essential for maintaining equipment reliability and wellbore integrity. Sustainable operations and emission reduction are increasingly important in the industry, necessitating the adoption of technology and digital transformation. Predictive maintenance, remote monitoring, and asset optimization are essential for lifecycle management and cost reduction. Pressure containment and control systems ensure safe and efficient production operations. Rock mechanics and reservoir simulation are critical in the exploration and development of energy resources. Pressure vessels, well stimulation, and blending systems are essential components of the frac stack system. The market for frac stacks continues to evolve, with a focus on cost reduction, supply chain management, and the integration of advanced technologies.

    Market Dynamics

    Our researchers analyzed the data with 2023 as the base year, along with the key drivers, trends, and challenges. A holistic analysis of drivers will help companies refine their marketing strategies to gain a competitive advantage.

    What are the Frac Stack market drivers leading to the rise in the adoption of Industry?

    • The abundance of unconventional oil and gas resources serves as the primary market driver, with these unconventional resources becoming increasingly significant due to their growing availability and potential to meet expanding energy demands. 

    • Unconventional oil and gas resources, such as shale, tight formations, and coal seams, require innovative techniques for production due to their lower natural pressure. These resources have gained significance in response to the depletion of easily accessible conventional hydrocarbons. The primary distinction between conventional and unconventional sources lies in the permeability of the gas-bearing formations. To maximize production from these resources, various technologies have emerged. Horizontal drilling and hydraulic fracturing, or fracking, are widely used techniques for extracting oil and gas from unconventional formations. Pressure vessels are essential components in the fracking process, storing and regulating the high-pressure fluids used for well stimulation.
    • Proppant handling systems ensure the effective delivery of proppants during the fracturing process. Digital transformation plays a crucial role in the unconventional oil and gas industry. Predictive maintenance systems, utilizing fluid dynamics and control systems, optimize equipment performance and minimize downtime. Production enhancement strategies, including the optimization of fracturing fluids, are also essential for improving the efficiency of unconventional resource extraction. The unconventional oil and gas industry's focus on reservoir stimulation and maintenance and repair continues to evolve, with a growing emphasis on technological advancements to optimize production and minimize environmental impact.

    What are the Frac Stack market trends shaping the Industry?

    • The increasing adoption of green fracking methods represents a significant market trend in the energy sector. This eco-friendly approach to hydraulic fracturing is gaining popularity due to its reduced environmental impact.

    • Hydraulic fracturing, or fracking, is a technique used to extract unconventional resources, such as shale gas, by injecting chemically treated water under high pressure to crack rock formations. This process, however, poses environmental challenges, including water consumption, liquid waste generation, and greenhouse gas emissions. To mitigate these issues, energy technology providers are developing eco-friendly fracking methods. Fracture modeling, pressure control, safety protocols, and performance improvement are crucial elements in the fracking process. Fluid management, data acquisition, stage optimization, and completion stages are essential for operational efficiency. Remote operations enable real-time monitoring and analysis, enhancing safety and reducing costs.
    • Environmental regulations play a significant role in the fracking industry. Compliance with these regulations requires the implementation of advanced technologies, such as pressure control systems, to minimize environmental impact. Service life, safety, and performance improvement are key priorities for companies operating in this sector. In conclusion, the fracking market is dynamic, with a focus on innovation and sustainability. Providers of energy technologies are addressing environmental concerns by developing green fracking methods that minimize water usage, reduce waste, and lower greenhouse gas emissions. The use of fracture modeling, pressure control, safety protocols, and data acquisition technologies is essential for operational efficiency and regulatory compliance.

    How does Frac Stack market faces challenges face during its growth?

    • The growth of the hydraulic fracturing industry is significantly influenced by the environmental concerns surrounding its processes. These concerns, which include water usage and contamination, air pollution, and seismic activity, necessitate continuous research and implementation of mitigation measures to ensure sustainable and responsible extraction methods. 

    • Hydraulic fracturing, a key process in well completions, relies on water, sand, proppants, and chemicals. While not carbon-intensive, environmental concerns persist due to potential methane leaks and water pollution. The use of large volumes of water for hydraulic fracturing can deplete fresh water resources. Chemicals, including hydrochloric acid, ethylene glycol, methanol, and isopropanol, can pose health risks and damage the respiratory and nervous systems. Injection of chemicals into shale oil reservoirs can contaminate underground water reserves. To mitigate these challenges, industry focus is on proppant selection for optimal hydraulic efficiency, reducing downtime through technology adoption, and implementing chemical additives for hydraulic fracturing.
    • Asset optimization and lifecycle management are essential for cost reduction. Supply chain management plays a crucial role in ensuring a steady supply of essential resources for hydraulic fracturing operations. Pumping rate and frac stack design are critical factors in enhancing production efficiency.

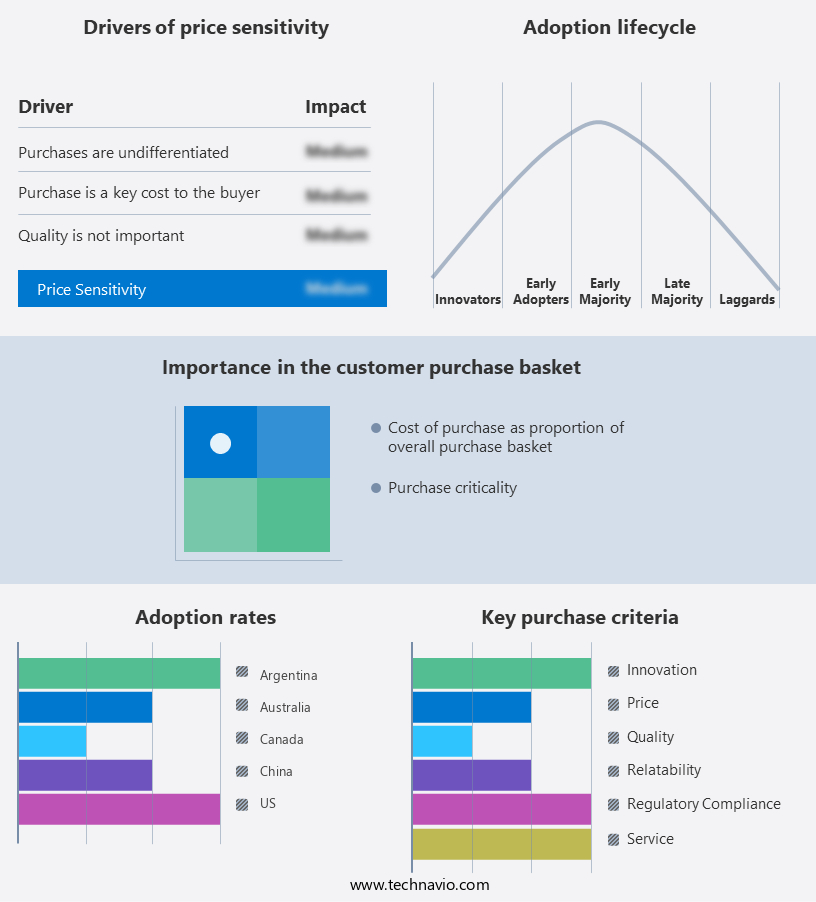
    Exclusive Customer Landscape

    The frac stack market forecasting report includes the adoption lifecycle of the market, covering from the innovator’s stage to the laggard’s stage. It focuses on adoption rates in different regions based on penetration. Furthermore, the frac stack market report also includes key purchase criteria and drivers of price sensitivity to help companies evaluate and develop their market growth analysis strategies.

    Frac Stack Market Share by Geography

     Customer Landscape

    Key Companies & Market Insights

    Companies are implementing various strategies, such as strategic alliances, frac stack market forecast, partnerships, mergers and acquisitions, geographical expansion, and product/service launches, to enhance their presence in the industry.

    AWC Frac Technology - The company specializes in providing advanced frac stack solutions, including Manual Frac Valves and Hydraulic Frac Valves. Our offerings prioritize efficiency, reliability, and safety, enhancing overall operational performance. These valves are integral components in hydraulic fracturing processes, controlling fluid flow and pressure to optimize resource extraction. By implementing cutting-edge technologies and engineering expertise, we ensure our clients achieve maximum results while minimizing environmental impact. Our commitment to innovation and quality sets us apart in the industry.

    The industry research and growth report includes detailed analyses of the competitive landscape of the market and information about key companies, including:

    • AWC Frac Technology
    • Baker Hughes Co.
    • Calfrac Well Services Ltd.
    • Caterpillar Inc.
    • CCSC Petroleum Equipment Co. Ltd.
    • Covenant Testing Technologies LLC
    • Halliburton Co.
    • Jiangsu Hongxun Oil Equipment Co. Ltd.
    • KLX Energy Services Holdings Inc.
    • Moto Mechanics Argentina SA
    • Oil States International Inc.
    • REIN PROCESS EQUIPMENT JIANGSU CO. LTD.
    • Schlumberger Ltd.
    • SHAANXI KERGY MECHANICAL EQUIPMENT CO. LTD.
    • Sunnda Corp.
    • Trican Well Service Ltd.
    • Universal Wellhead Services Holdings LLC
    • Worldwide Oilfield Machine Inc.
    • Yancheng Qihang Petroleum Machinery Co. Ltd.
    • Yantai Jereh Oilfield Services Group Co. Ltd.

    Qualitative and quantitative analysis of companies has been conducted to help clients understand the wider business environment as well as the strengths and weaknesses of key industry players. Data is qualitatively analyzed to categorize companies as pure play, category-focused, industry-focused, and diversified; it is quantitatively analyzed to categorize companies as dominant, leading, strong, tentative, and weak.

    Recent Development and News in Frac Stack Market

    • In February 2024, Schlumberger Limited, a leading oilfield services company, announced the launch of its new frac stack, the E-Frac 365, which offers continuous fracking operations with minimal interruptions (Schlumberger Press Release, 2024). This innovation is expected to increase operational efficiency and reduce costs for oil and gas producers.
    • In October 2024, Halliburton Company and Baker Hughes, two major oilfield services providers, announced their merger, creating a new company, Baker Hughes a GE Company. This strategic partnership aims to strengthen their position in the market by combining their resources and expertise (Baker Hughes Press Release, 2024).
    • In January 2025, the U.S. Environmental Protection Agency (EPA) approved the use of closed-loop frac systems, which significantly reduce the amount of water used in hydraulic fracturing. This regulatory approval is a major step towards more sustainable fracking practices and is expected to increase the demand for frac stacks using this technology (EPA Press Release, 2025).
    • In March 2025, National Oilwell Varco, a leading provider of equipment and components for the oil and gas industry, announced the successful deployment of its new frac stack design, the REDHORSE 3.0. This design offers improved pressure control and increased capacity, making it a significant technological advancement in the market (National Oilwell Varco Press Release, 2025).

    Research Analyst Overview

    The market continues to evolve, driven by the dynamic nature of market dynamics and the ever-evolving applications across various sectors of the energy industry. Fracture modeling and pressure control play crucial roles in optimizing well completions and ensuring operational efficiency. Environmental regulations are a significant factor, pushing for emission reduction and sustainable operations. Unconventional resources, such as shale gas, require specialized frac stack designs for hydraulic fracturing and well stimulation. The focus on performance improvement and safety protocols has led to advancements in proppant selection, pumping rate optimization, and pumping unit reliability. Fluid management, including fluid dynamics and chemical additives, is essential for cost reduction and asset optimization throughout the lifecycle of a well.

    Remote monitoring, predictive maintenance, and digital transformation are key to minimizing downtime and enhancing operational efficiency. Stage optimization and completion stages benefit from reservoir simulation, hydraulic fracturing, and pressure containment technologies. Wellbore integrity, equipment reliability, and rock mechanics are critical for maintaining production operations and ensuring cost of ownership remains competitive. The market continues to adopt technology and supply chain management strategies to improve cost reduction and efficiency. The ongoing unfolding of market activities reveals evolving patterns in fracturing fluids, tight oil production, and field development.

    Dive into Technavio’s robust research methodology, blending expert interviews, extensive data synthesis, and validated models for unparalleled Frac Stack Market insights. See full methodology.

    Market Scope

    Report Coverage

    Details

    Page number

    166

    Base year

    2023

    Historic period

    2018-2022

    Forecast period

    2024-2028

    Growth momentum & CAGR

    Accelerate at a CAGR of 4.36%

    Market growth 2024-2028

    USD 8.49 billion

    Market structure

    Fragmented

    YoY growth 2023-2024(%)

    4.11

    Key countries

    US, China, Canada, Argentina, and Australia

    Competitive landscape

    Leading Companies, Market Positioning of Companies, Competitive Strategies, and Industry Risks

    Request Free Sample

    What are the Key Data Covered in this Frac Stack Market Research and Growth Report?

    • CAGR of the Frac Stack industry during the forecast period
    • Detailed information on factors that will drive the growth and forecasting between 2024 and 2028
    • Precise estimation of the size of the market and its contribution of the industry in focus to the parent market
    • Accurate predictions about upcoming growth and trends and changes in consumer behaviour
    • Growth of the market across North America, Europe, APAC, South America, and Middle East and Africa
    • Thorough analysis of the market’s competitive landscape and detailed information about companies
    • Comprehensive analysis of factors that will challenge the frac stack market growth of industry companies

    We can help! Our analysts can customize this frac stack market research report to meet your requirements.

    Get in touch


    1 Executive Summary

    • 1.1 Market overview
      • Executive Summary - Chart on Market Overview
      • Executive Summary - Data Table on Market Overview
      • Executive Summary - Chart on Global Market Characteristics
      • Executive Summary - Chart on Market by Geography
      • Executive Summary - Chart on Market Segmentation by Deployment
      • Executive Summary - Chart on Market Segmentation by Type
      • Executive Summary - Chart on Incremental Growth
      • Executive Summary - Data Table on Incremental Growth
      • Executive Summary - Chart on Company Market Positioning

    2 Market Landscape

    • 2.1 Market ecosystem
      • Parent Market
      • Data Table on - Parent Market
    • 2.2 Market characteristics
      • Market characteristics analysis
    • 2.3 Value chain analysis
      • Value Chain Analysis

    3 Market Sizing

    • 3.1 Market definition
      • Offerings of companies included in the market definition
    • 3.2 Market segment analysis
      • Market segments
    • 3.3 Market size 2023
      • 3.4 Market outlook: Forecast for 2023-2028
        • Chart on Global - Market size and forecast 2023-2028 ($ million)
        • Data Table on Global - Market size and forecast 2023-2028 ($ million)
        • Chart on Global Market: Year-over-year growth 2023-2028 (%)
        • Data Table on Global Market: Year-over-year growth 2023-2028 (%)

      4 Historic Market Size

      • 4.1 Global Frac Stack Market 2018 - 2022
        • Historic Market Size - Data Table on Global Frac Stack Market 2018 - 2022 ($ million)
      • 4.2 Deployment segment analysis 2018 - 2022
        • Historic Market Size - Deployment Segment 2018 - 2022 ($ million)
      • 4.3 Type segment analysis 2018 - 2022
        • Historic Market Size - Type Segment 2018 - 2022 ($ million)
      • 4.4 Geography segment analysis 2018 - 2022
        • Historic Market Size - Geography Segment 2018 - 2022 ($ million)
      • 4.5 Country segment analysis 2018 - 2022
        • Historic Market Size - Country Segment 2018 - 2022 ($ million)

      5 Five Forces Analysis

      • 5.1 Five forces summary
        • Five forces analysis - Comparison between 2023 and 2028
      • 5.2 Bargaining power of buyers
        • Bargaining power of buyers - Impact of key factors 2023 and 2028
      • 5.3 Bargaining power of suppliers
        • Bargaining power of suppliers - Impact of key factors in 2023 and 2028
      • 5.4 Threat of new entrants
        • Threat of new entrants - Impact of key factors in 2023 and 2028
      • 5.5 Threat of substitutes
        • Threat of substitutes - Impact of key factors in 2023 and 2028
      • 5.6 Threat of rivalry
        • Threat of rivalry - Impact of key factors in 2023 and 2028
      • 5.7 Market condition
        • Chart on Market condition - Five forces 2023 and 2028

      6 Market Segmentation by Deployment

      • 6.1 Market segments
        • Chart on Deployment - Market share 2023-2028 (%)
        • Data Table on Deployment - Market share 2023-2028 (%)
      • 6.2 Comparison by Deployment
        • Chart on Comparison by Deployment
        • Data Table on Comparison by Deployment
      • 6.3 Onshore - Market size and forecast 2023-2028
        • Chart on Onshore - Market size and forecast 2023-2028 ($ million)
        • Data Table on Onshore - Market size and forecast 2023-2028 ($ million)
        • Chart on Onshore - Year-over-year growth 2023-2028 (%)
        • Data Table on Onshore - Year-over-year growth 2023-2028 (%)
      • 6.4 Offshore - Market size and forecast 2023-2028
        • Chart on Offshore - Market size and forecast 2023-2028 ($ million)
        • Data Table on Offshore - Market size and forecast 2023-2028 ($ million)
        • Chart on Offshore - Year-over-year growth 2023-2028 (%)
        • Data Table on Offshore - Year-over-year growth 2023-2028 (%)
      • 6.5 Market opportunity by Deployment
        • Market opportunity by Deployment ($ million)
        • Data Table on Market opportunity by Deployment ($ million)

      7 Market Segmentation by Type

      • 7.1 Market segments
        • Chart on Type - Market share 2023-2028 (%)
        • Data Table on Type - Market share 2023-2028 (%)
      • 7.2 Comparison by Type
        • Chart on Comparison by Type
        • Data Table on Comparison by Type
      • 7.3 Horizontal and deviated - Market size and forecast 2023-2028
        • Chart on Horizontal and deviated - Market size and forecast 2023-2028 ($ million)
        • Data Table on Horizontal and deviated - Market size and forecast 2023-2028 ($ million)
        • Chart on Horizontal and deviated - Year-over-year growth 2023-2028 (%)
        • Data Table on Horizontal and deviated - Year-over-year growth 2023-2028 (%)
      • 7.4 Vertical - Market size and forecast 2023-2028
        • Chart on Vertical - Market size and forecast 2023-2028 ($ million)
        • Data Table on Vertical - Market size and forecast 2023-2028 ($ million)
        • Chart on Vertical - Year-over-year growth 2023-2028 (%)
        • Data Table on Vertical - Year-over-year growth 2023-2028 (%)
      • 7.5 Market opportunity by Type
        • Market opportunity by Type ($ million)
        • Data Table on Market opportunity by Type ($ million)

      8 Customer Landscape

      • 8.1 Customer landscape overview
        • Analysis of price sensitivity, lifecycle, customer purchase basket, adoption rates, and purchase criteria

      9 Geographic Landscape

      • 9.1 Geographic segmentation
        • Chart on Market share by geography 2023-2028 (%)
        • Data Table on Market share by geography 2023-2028 (%)
      • 9.2 Geographic comparison
        • Chart on Geographic comparison
        • Data Table on Geographic comparison
      • 9.3 North America - Market size and forecast 2023-2028
        • Chart on North America - Market size and forecast 2023-2028 ($ million)
        • Data Table on North America - Market size and forecast 2023-2028 ($ million)
        • Chart on North America - Year-over-year growth 2023-2028 (%)
        • Data Table on North America - Year-over-year growth 2023-2028 (%)
      • 9.4 Europe - Market size and forecast 2023-2028
        • Chart on Europe - Market size and forecast 2023-2028 ($ million)
        • Data Table on Europe - Market size and forecast 2023-2028 ($ million)
        • Chart on Europe - Year-over-year growth 2023-2028 (%)
        • Data Table on Europe - Year-over-year growth 2023-2028 (%)
      • 9.5 APAC - Market size and forecast 2023-2028
        • Chart on APAC - Market size and forecast 2023-2028 ($ million)
        • Data Table on APAC - Market size and forecast 2023-2028 ($ million)
        • Chart on APAC - Year-over-year growth 2023-2028 (%)
        • Data Table on APAC - Year-over-year growth 2023-2028 (%)
      • 9.6 South America - Market size and forecast 2023-2028
        • Chart on South America - Market size and forecast 2023-2028 ($ million)
        • Data Table on South America - Market size and forecast 2023-2028 ($ million)
        • Chart on South America - Year-over-year growth 2023-2028 (%)
        • Data Table on South America - Year-over-year growth 2023-2028 (%)
      • 9.7 Middle East and Africa - Market size and forecast 2023-2028
        • Chart on Middle East and Africa - Market size and forecast 2023-2028 ($ million)
        • Data Table on Middle East and Africa - Market size and forecast 2023-2028 ($ million)
        • Chart on Middle East and Africa - Year-over-year growth 2023-2028 (%)
        • Data Table on Middle East and Africa - Year-over-year growth 2023-2028 (%)
      • 9.8 US - Market size and forecast 2023-2028
        • Chart on US - Market size and forecast 2023-2028 ($ million)
        • Data Table on US - Market size and forecast 2023-2028 ($ million)
        • Chart on US - Year-over-year growth 2023-2028 (%)
        • Data Table on US - Year-over-year growth 2023-2028 (%)
      • 9.9 China - Market size and forecast 2023-2028
        • Chart on China - Market size and forecast 2023-2028 ($ million)
        • Data Table on China - Market size and forecast 2023-2028 ($ million)
        • Chart on China - Year-over-year growth 2023-2028 (%)
        • Data Table on China - Year-over-year growth 2023-2028 (%)
      • 9.10 Canada - Market size and forecast 2023-2028
        • Chart on Canada - Market size and forecast 2023-2028 ($ million)
        • Data Table on Canada - Market size and forecast 2023-2028 ($ million)
        • Chart on Canada - Year-over-year growth 2023-2028 (%)
        • Data Table on Canada - Year-over-year growth 2023-2028 (%)
      • 9.11 Argentina - Market size and forecast 2023-2028
        • Chart on Argentina - Market size and forecast 2023-2028 ($ million)
        • Data Table on Argentina - Market size and forecast 2023-2028 ($ million)
        • Chart on Argentina - Year-over-year growth 2023-2028 (%)
        • Data Table on Argentina - Year-over-year growth 2023-2028 (%)
      • 9.12 Australia - Market size and forecast 2023-2028
        • Chart on Australia - Market size and forecast 2023-2028 ($ million)
        • Data Table on Australia - Market size and forecast 2023-2028 ($ million)
        • Chart on Australia - Year-over-year growth 2023-2028 (%)
        • Data Table on Australia - Year-over-year growth 2023-2028 (%)
      • 9.13 Market opportunity by geography
        • Market opportunity by geography ($ million)
        • Data Tables on Market opportunity by geography ($ million)

      10 Drivers, Challenges, and Opportunity/Restraints

      • 10.1 Market drivers
        • 10.2 Market challenges
          • 10.3 Impact of drivers and challenges
            • Impact of drivers and challenges in 2023 and 2028
          • 10.4 Market opportunities/restraints

            11 Competitive Landscape

            • 11.1 Overview
              • 11.2 Competitive Landscape
                • Overview on criticality of inputs and factors of differentiation
              • 11.3 Landscape disruption
                • Overview on factors of disruption
              • 11.4 Industry risks
                • Impact of key risks on business

              12 Competitive Analysis

              • 12.1 Companies profiled
                • Companies covered
              • 12.2 Market positioning of companies
                • Matrix on companies position and classification
              • 12.3 AWC Frac Technology
                • AWC Frac Technology - Overview
                • AWC Frac Technology - Product / Service
                • AWC Frac Technology - Key offerings
              • 12.4 Baker Hughes Co.
                • Baker Hughes Co. - Overview
                • Baker Hughes Co. - Business segments
                • Baker Hughes Co. - Key news
                • Baker Hughes Co. - Key offerings
                • Baker Hughes Co. - Segment focus
              • 12.5 Calfrac Well Services Ltd.
                • Calfrac Well Services Ltd. - Overview
                • Calfrac Well Services Ltd. - Business segments
                • Calfrac Well Services Ltd. - Key offerings
                • Calfrac Well Services Ltd. - Segment focus
              • 12.6 Caterpillar Inc.
                • Caterpillar Inc. - Overview
                • Caterpillar Inc. - Business segments
                • Caterpillar Inc. - Key news
                • Caterpillar Inc. - Key offerings
                • Caterpillar Inc. - Segment focus
              • 12.7 CCSC Petroleum Equipment Co. Ltd.
                • CCSC Petroleum Equipment Co. Ltd. - Overview
                • CCSC Petroleum Equipment Co. Ltd. - Product / Service
                • CCSC Petroleum Equipment Co. Ltd. - Key offerings
              • 12.8 Covenant Testing Technologies LLC
                • Covenant Testing Technologies LLC - Overview
                • Covenant Testing Technologies LLC - Product / Service
                • Covenant Testing Technologies LLC - Key offerings
              • 12.9 Halliburton Co.
                • Halliburton Co. - Overview
                • Halliburton Co. - Business segments
                • Halliburton Co. - Key news
                • Halliburton Co. - Key offerings
                • Halliburton Co. - Segment focus
              • 12.10 Moto Mechanics Argentina SA
                • Moto Mechanics Argentina SA - Overview
                • Moto Mechanics Argentina SA - Product / Service
                • Moto Mechanics Argentina SA - Key offerings
              • 12.11 Oil States International Inc.
                • Oil States International Inc. - Overview
                • Oil States International Inc. - Business segments
                • Oil States International Inc. - Key offerings
                • Oil States International Inc. - Segment focus
              • 12.12 REIN PROCESS EQUIPMENT JIANGSU CO. LTD.
                • REIN PROCESS EQUIPMENT JIANGSU CO. LTD. - Overview
                • REIN PROCESS EQUIPMENT JIANGSU CO. LTD. - Product / Service
                • REIN PROCESS EQUIPMENT JIANGSU CO. LTD. - Key offerings
              • 12.13 Schlumberger Ltd.
                • Schlumberger Ltd. - Overview
                • Schlumberger Ltd. - Business segments
                • Schlumberger Ltd. - Key news
                • Schlumberger Ltd. - Key offerings
                • Schlumberger Ltd. - Segment focus
              • 12.14 SHAANXI KERGY MECHANICAL EQUIPMENT CO. LTD.
                • SHAANXI KERGY MECHANICAL EQUIPMENT CO. LTD. - Overview
                • SHAANXI KERGY MECHANICAL EQUIPMENT CO. LTD. - Product / Service
                • SHAANXI KERGY MECHANICAL EQUIPMENT CO. LTD. - Key offerings
              • 12.15 Worldwide Oilfield Machine Inc.
                • Worldwide Oilfield Machine Inc. - Overview
                • Worldwide Oilfield Machine Inc. - Product / Service
                • Worldwide Oilfield Machine Inc. - Key offerings
              • 12.16 Yancheng Qihang Petroleum Machinery Co. Ltd.
                • Yancheng Qihang Petroleum Machinery Co. Ltd. - Overview
                • Yancheng Qihang Petroleum Machinery Co. Ltd. - Product / Service
                • Yancheng Qihang Petroleum Machinery Co. Ltd. - Key offerings
              • 12.17 Yantai Jereh Oilfield Services Group Co. Ltd.
                • Yantai Jereh Oilfield Services Group Co. Ltd. - Overview
                • Yantai Jereh Oilfield Services Group Co. Ltd. - Product / Service
                • Yantai Jereh Oilfield Services Group Co. Ltd. - Key offerings

              13 Appendix

              • 13.1 Scope of the report
                • 13.2 Inclusions and exclusions checklist
                  • Inclusions checklist
                  • Exclusions checklist
                • 13.3 Currency conversion rates for US$
                  • Currency conversion rates for US$
                • 13.4 Research methodology
                  • Research methodology
                • 13.5 Data procurement
                  • Information sources
                • 13.6 Data validation
                  • Data validation
                • 13.7 Validation techniques employed for market sizing
                  • Validation techniques employed for market sizing
                • 13.8 Data synthesis
                  • Data synthesis
                • 13.9 360 degree market analysis
                  • 360 degree market analysis
                • 13.10 List of abbreviations
                  • List of abbreviations

                Research Methodology

                Technavio presents a detailed picture of the market by way of study, synthesis, and summation of data from multiple sources. The analysts have presented the various facets of the market with a particular focus on identifying the key industry influencers. The data thus presented is comprehensive, reliable, and the result of extensive research, both primary and secondary.

                INFORMATION SOURCES

                Primary sources

                • Manufacturers and suppliers
                • Channel partners
                • Industry experts
                • Strategic decision makers

                Secondary sources

                • Industry journals and periodicals
                • Government data
                • Financial reports of key industry players
                • Historical data
                • Press releases

                DATA ANALYSIS

                Data Synthesis

                • Collation of data
                • Estimation of key figures
                • Analysis of derived insights

                Data Validation

                • Triangulation with data models
                • Reference against proprietary databases
                • Corroboration with industry experts

                REPORT WRITING

                Qualitative

                • Market drivers
                • Market challenges
                • Market trends
                • Five forces analysis

                Quantitative

                • Market size and forecast
                • Market segmentation
                • Geographical insights
                • Competitive landscape

                Interested in this report?

                Get your sample now to see our research methodology and insights!

                Download Now

                Frequently Asked Questions

                Frac Stack market growth will increase by $ 8.49 bn during 2024-2028 .

                The Frac Stack market is expected to grow at a CAGR of 4.36% during 2024-2028 .

                Frac Stack market is segmented by Deployment( Onshore, Offshore) Type( Horizontal and deviated, Vertical, Vertical)

                AWC Frac Technology, Baker Hughes Co., Calfrac Well Services Ltd., Caterpillar Inc., CCSC Petroleum Equipment Co. Ltd., Covenant Testing Technologies LLC, Halliburton Co., Jiangsu Hongxun Oil Equipment Co. Ltd., KLX Energy Services Holdings Inc., Moto Mechanics Argentina SA, Oil States International Inc., REIN PROCESS EQUIPMENT JIANGSU CO. LTD., Schlumberger Ltd., SHAANXI KERGY MECHANICAL EQUIPMENT CO. LTD., Sunnda Corp., Trican Well Service Ltd., Universal Wellhead Services Holdings LLC, Worldwide Oilfield Machine Inc., Yancheng Qihang Petroleum Machinery Co. Ltd., Yantai Jereh Oilfield Services Group Co. Ltd. are a few of the key vendors in the Frac Stack market.

                North America will register the highest growth rate of 34% among the other regions. Therefore, the Frac Stack market in North America is expected to garner significant business opportunities for the vendors during the forecast period.

                US, China, Canada, Argentina, Australia

                • Abundance of unconventional oil and gas resourcesUnconventional oil and gas resources refer to the oil and natural gas found in shale and tight formations and oil sands. CBM is the driving factor this market.
                • which is found in coal seams or coal deposits is the driving factor this market.
                • is another unconventional source of natural gas and has gained prominence. Unconventional hydrocarbon resources lose their natural pressure of flow faster than conventional hydrocarbon resources. This demands the use of different techniques to improve the production rate.  With depleting resources of easily available natural gas and crude oil is the driving factor this market.
                • unconventional energy sources were gradually explored and have received substantial impetus in the past decade. The major difference between a conventional and unconventional oil and gas source is the permeability of the gas-bearing formation. Unconventional sources have lower permeability than conventional sources. Due to their low permeability is the driving factor this market.
                • oil and gas cannot easily pass through the hydrocarbon-bearing formations.  Unlike the rapidly depleting conventional oil and gas resources is the driving factor this market.
                • unconventional resources are present in abundance across many countries is the driving factor this market.
                • such as the US is the driving factor this market.
                • Canada is the driving factor this market.
                • China is the driving factor this market.
                • and Argentina. Many other countries is the driving factor this market.
                • such as China is the driving factor this market.
                • have not been able to utilize their unconventional resources completely. However is the driving factor this market.
                • they have enough resources and are spending significantly on R&D to make production economically viable. In March 2022 is the driving factor this market.
                • China had set a target of achieving a shale gas production of 650 bcm by 2040. The subsidies offered by the country for the domestic production of unconventional gas are significantly supporting the production of unconventional gas in the country.  Such factors suggest that unconventional oil and gas resources are abundantly available is the driving factor this market.
                • and even with the increase in production is the driving factor this market.
                • they will remain available for a longer period. This is expected to support the growth of the market in focus during the forecast period.  is the driving factor this market.

                The Frac Stack market vendors should focus on grabbing business opportunities from the Onshore segment as it accounted for the largest market share in the base year.