Fracking Water Treatment Market Size 2026-2030
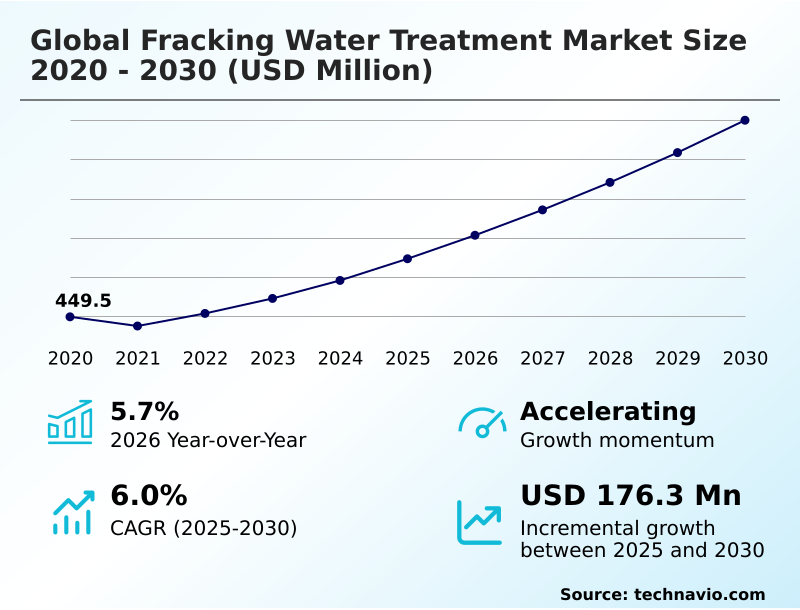
The fracking water treatment market size is valued to increase by USD 176.3 million, at a CAGR of 6% from 2025 to 2030. Increasing consumption of natural gas will drive the fracking water treatment market.
Major Market Trends & Insights
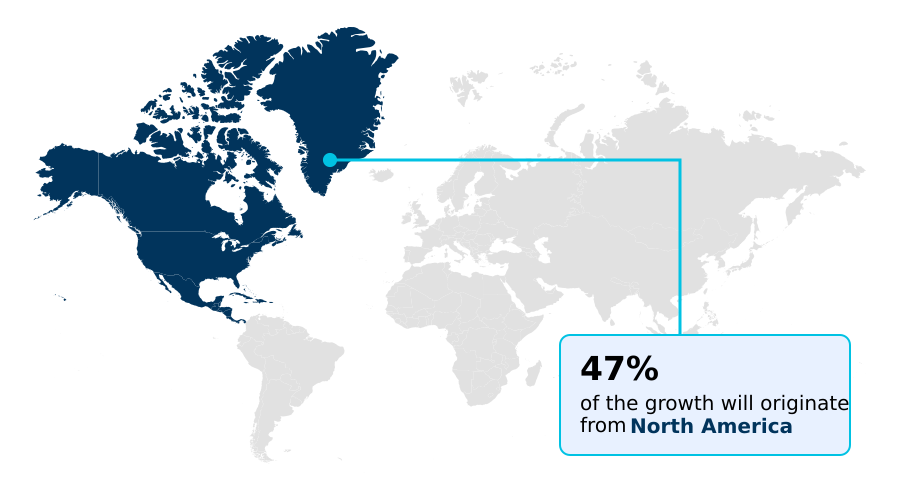
- North America dominated the market and accounted for a 47.1% growth during the forecast period.
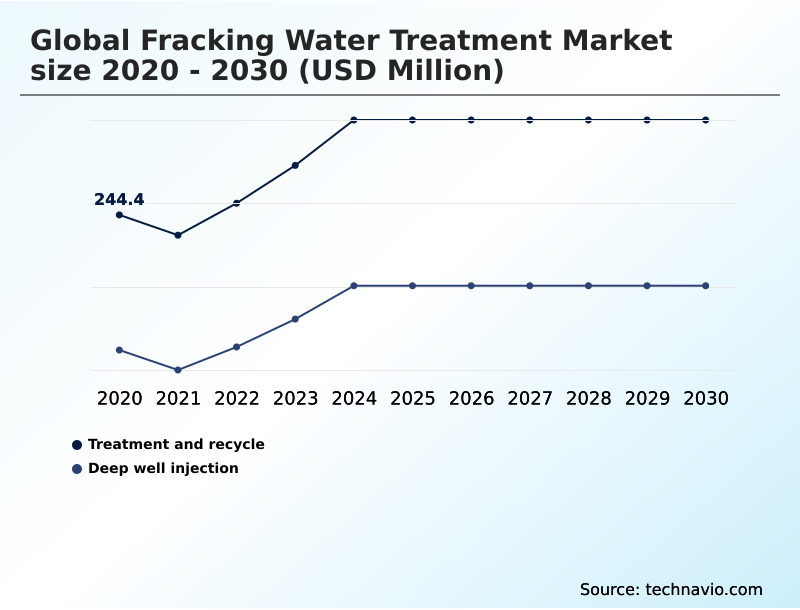
- By Application - Treatment and recycle segment was valued at USD 272 million in 2024
- By End-user - Commercial segment accounted for the largest market revenue share in 2024
Market Size & Forecast
- Market Opportunities: USD 250.2 million
- Market Future Opportunities: USD 176.3 million
- CAGR from 2025 to 2030 : 6%
Market Summary
- The Fracking Water Treatment Market is fundamentally shaped by the operational necessity to manage vast quantities of water generated during unconventional oil and gas exploration. As hydraulic fracturing activity expands, so does the volume of flowback and produced water, creating a pressing need for effective management.
- Key market drivers include increasingly stringent environmental regulations governing wastewater disposal and the powerful economic incentive to reduce freshwater consumption in water-stressed regions. A primary trend is the industry's strategic shift from disposal-centric models, such as deep well injection, toward on-site treatment and recycle frameworks. This transition is enabled by technological advancements in membrane filtration, electrocoagulation, and distillation.
- However, the market faces challenges from the complex and highly variable chemistry of produced water, which often contains high total dissolved solids (TDS), hydrocarbons, and chemical additives.
- For instance, an operator in an arid basin must weigh the high capital cost of a zero liquid discharge system against the long-term risks and escalating costs of water hauling and disposal, a decision that directly impacts field development economics and environmental compliance.
What will be the Size of the Fracking Water Treatment Market during the forecast period?
Get Key Insights on Market Forecast (PDF) Get Free Sample
How is the Fracking Water Treatment Market Segmented?
The fracking water treatment industry research report provides comprehensive data (region-wise segment analysis), with forecasts and estimates in "USD million" for the period 2026-2030, as well as historical data from 2020-2024 for the following segments.
- Application
- Treatment and recycle
- Deep well injection
- End-user
- Commercial
- Industrial
- Residential
- Type
- Membrane filtration
- Electrocoagulation
- Biological treatment
- Distillation
- Others
- Geography
- North America
- US
- Canada
- Mexico
- APAC
- China
- Australia
- India
- South America
- Argentina
- Brazil
- Europe
- UK
- Germany
- France
- Middle East and Africa
- Saudi Arabia
- UAE
- South Africa
- Rest of World (ROW)
- North America
By Application Insights
The treatment and recycle segment is estimated to witness significant growth during the forecast period.
The treatment and recycle segment is undergoing a paradigm shift, moving from a disposal-focused model to a circular water economy. Driven by regulatory pressures and water scarcity concerns, this transition is most evident in major shale plays.
Operators are increasingly adopting advanced solutions for produced water reuse to mitigate environmental risks and achieve significant operational cost savings.
The focus is on robust, efficient systems for produced water purification capable of handling variable water chemistries, including high total dissolved solids (TDS) and hydrocarbon removal. This approach is not merely for compliance; it is a source of competitive advantage.
The deployment of advanced water management solutions has enabled some operators to improve water recycling efficiency by up to 95%, making it a cornerstone of sustainable oil and gas development.
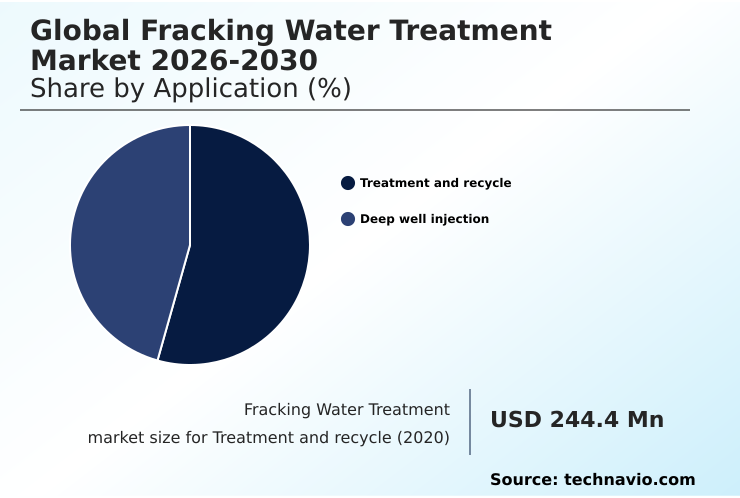
The Treatment and recycle segment was valued at USD 272 million in 2024 and showed a gradual increase during the forecast period.
Regional Analysis
North America is estimated to contribute 47.1% to the growth of the global market during the forecast period.Technavio’s analysts have elaborately explained the regional trends and drivers that shape the market during the forecast period.
See How Fracking Water Treatment Market Demand is Rising in North America Get Free Sample
The geographic landscape of the fracking water treatment market is characterized by distinct regional dynamics and varying levels of maturity.
North America commands the largest market share, contributing nearly 48% of the incremental growth, driven by extensive unconventional drilling and a sophisticated regulatory framework that encourages produced water reuse.
However, high-growth frontiers are rapidly emerging in regions facing acute water scarcity concerns. New projects in the Middle East and South America, for example, are increasingly mandating water recycling rates exceeding 90% as an operational prerequisite.
This strategic shift toward closed-loop water systems and advanced desalination by ro treatment has been shown to reduce overall water lifecycle costs by more than 25% in arid environments, spurring investment in robust technologies like distillation and advanced oxidation processes for effective saline wastewater treatment.
Market Dynamics
Our researchers analyzed the data with 2025 as the base year, along with the key drivers, trends, and challenges. A holistic analysis of drivers will help companies refine their marketing strategies to gain a competitive advantage.
- Strategic decision-making in the fracking water treatment sector revolves around a complex analysis of operational economics and technological trade-offs. The primary metric under scrutiny is the cost of fracking water treatment per barrel, which influences investment in different management strategies. Companies must evaluate the economic viability of onsite fracking water recycling against the logistical costs and long-term liabilities of disposal.
- This analysis directly informs technology selection, such as choosing between reverse osmosis vs distillation for frac water, depending on the specific chemistry of the flowback and produced water. For instance, innovations in ceramic membrane filtration for produced water are providing more robust options for challenging waste streams.
- The benefits of supercritical carbon vs water in fracking are also being closely examined as a method to reduce water intensity altogether. In densely drilled areas like the Permian Basin, fracking water reuse in permian basin operations is now standard practice, supported by mobile fracking water treatment systems for remote sites.
- These systems are crucial for treating high-salinity brine and help operators meet regulatory compliance for fracking water disposal. As part of a comprehensive risk management strategy, operators are also focused on managing induced seismicity from deep well injection, often turning to zero liquid discharge systems in hydraulic fracturing as a preferred alternative.
- Operational planning models show that such integrated water management for unconventional gas development can reduce project-related water sourcing delays by several weeks compared to reliance on external disposal facilities, underscoring the shift toward self-sufficient water handling.
What are the key market drivers leading to the rise in the adoption of Fracking Water Treatment Industry?
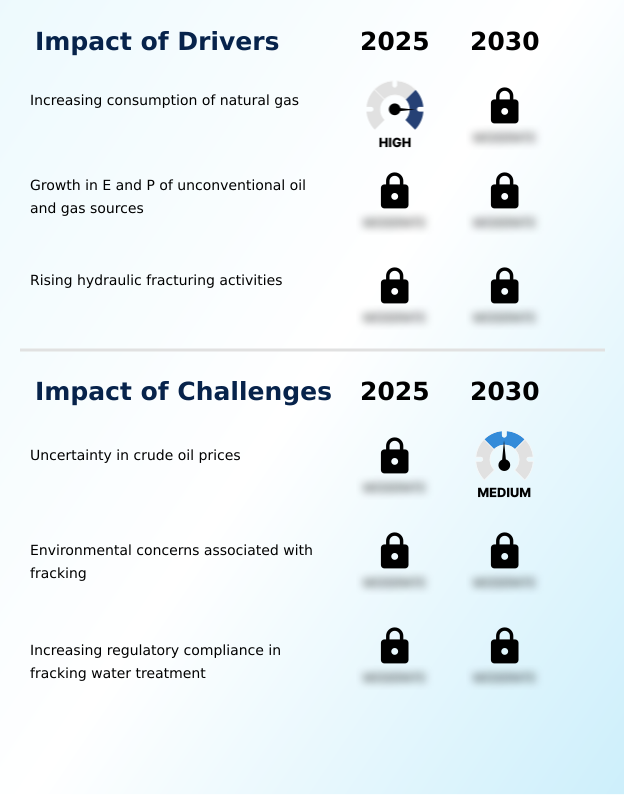
- The increasing consumption of natural gas is a key driver for the market, fueling the expansion of hydraulic fracturing activities and the subsequent need for water treatment solutions.
- The market's expansion is directly propelled by rising hydraulic fracturing activity and the corresponding increase in wastewater volumes that require sophisticated management.
- As operators intensify shale gas extraction to meet growing energy demands, the economic case for advanced water treatment strengthens significantly. On-site treatment and recycle systems have proven to reduce water-related operating expenses by 30-40% compared to traditional disposal methods.
- Furthermore, tightening environmental compliance standards are forcing a move toward sustainable production practices.
- The implementation of closed-loop water systems, which can achieve over 95% reuse rates, is becoming crucial for mitigating regulatory risks and enhancing corporate water stewardship programs, thus avoiding costly penalties for non-compliance.
- This focus on operational cost reduction and a circular water economy is a primary driver.
What are the market trends shaping the Fracking Water Treatment Industry?
- The adoption of supercritical carbon in fracking is emerging as a notable market trend, driven by the growing demand for sustainable and efficient extraction methods that reduce water consumption.
- Key market trends are centered on enhancing sustainability and operational efficiency through technological innovation. The adoption of advanced membrane filtration technologies has demonstrated the capability to reduce wastewater volumes by over 85%, enabling higher rates of produced water reuse.
- Concurrently, emerging waterless or reduced-water techniques, such as the use of supercritical carbon dioxide, can lower freshwater consumption by nearly 100% in certain geological formations, directly addressing water scarcity concerns. These innovations in the hydraulic fracturing process are critical as operators seek to improve their environmental footprint.
- The integration of mobile and modular treatment systems that can be rapidly deployed to new sites has been shown to improve logistical efficiency by up to 20%, supporting the industry’s need for agile and cost-effective water management solutions. This is essential for both unconventional oil and gas exploration.
What challenges does the Fracking Water Treatment Industry face during its growth?
- Uncertainty in crude oil prices presents a key challenge to industry growth, as price volatility directly impacts investment in hydraulic fracturing and related water treatment services.
- Market growth faces significant headwinds from the inherent volatility of crude oil prices, where a 20% price drop can trigger corresponding cutbacks in drilling budgets and investment in advanced water treatment technologies. Concurrently, increasing regulatory compliance pressures add considerable operational complexity, with systems for frac water conditioning needed to meet diverse and stringent standards.
- This can increase per-barrel water management costs by 15-25% in some regions. Environmental concerns, particularly around induced seismicity linked to deep well injection and the challenge of electrode passivation in electrocoagulation systems, further constrain operations. These factors necessitate investment in higher-cost, lower-risk alternatives such as frac water reuse systems to ensure long-term operational viability and social license to operate.
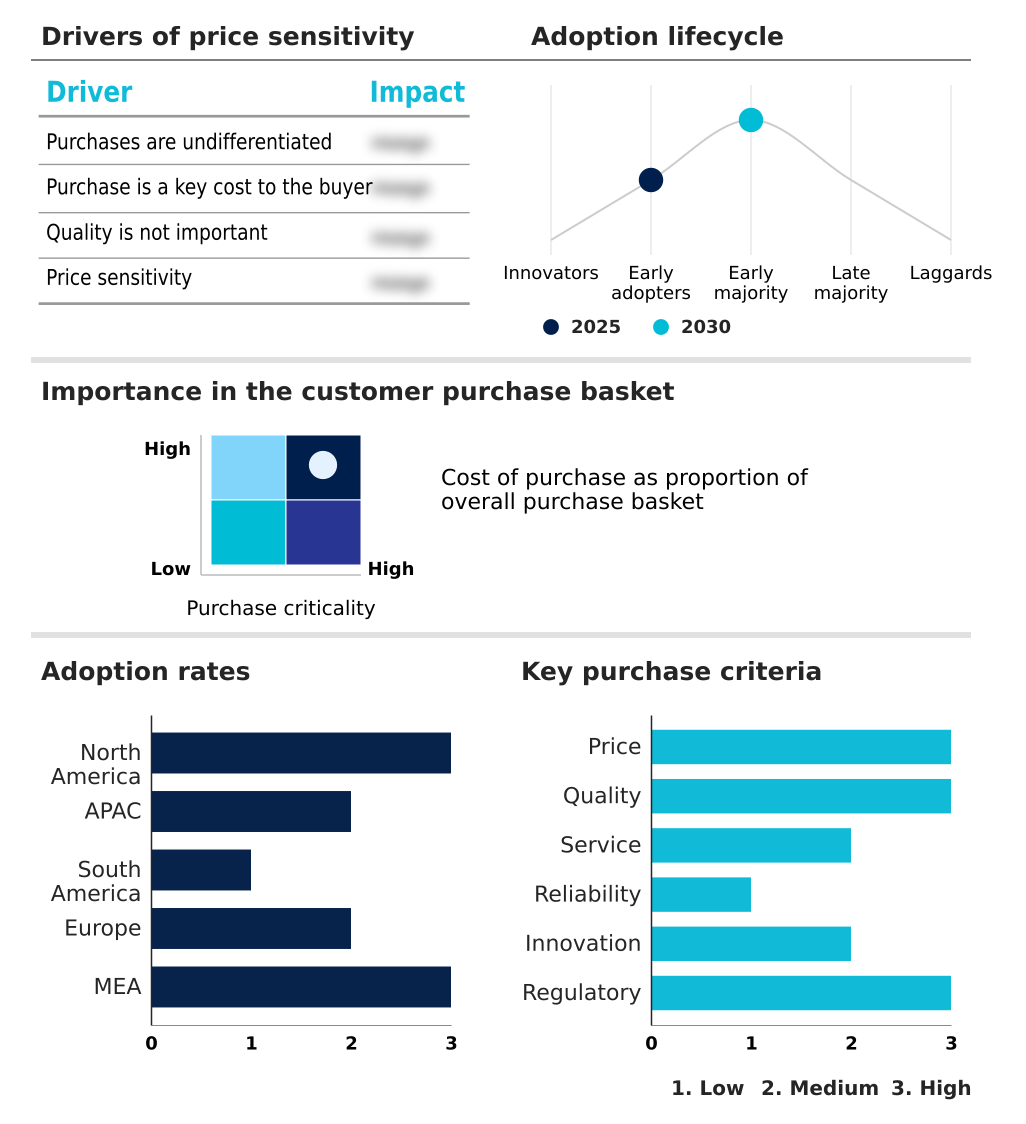
Exclusive Technavio Analysis on Customer Landscape
The fracking water treatment market forecasting report includes the adoption lifecycle of the market, covering from the innovator’s stage to the laggard’s stage. It focuses on adoption rates in different regions based on penetration. Furthermore, the fracking water treatment market report also includes key purchase criteria and drivers of price sensitivity to help companies evaluate and develop their market growth analysis strategies.
Customer Landscape of Fracking Water Treatment Industry
Competitive Landscape
Companies are implementing various strategies, such as strategic alliances, fracking water treatment market forecast, partnerships, mergers and acquisitions, geographical expansion, and product/service launches, to enhance their presence in the industry.
Alfa Laval AB - Offerings include advanced evaporation and separation technologies, enabling efficient produced and flowback water reuse in hydraulic fracturing operations.
The industry research and growth report includes detailed analyses of the competitive landscape of the market and information about key companies, including:
- Alfa Laval AB
- Anguil Environmental Systems
- Aquatech International LLC
- Baker Hughes Co.
- Calfrac Well Services Ltd.
- ChampionX Corp.
- Cudd Energy Services
- DuPont de Nemours Inc.
- Ecologix Environmental Systems
- Filtra Systems Co.
- Fluence Corp. Ltd.
- Halliburton Co.
- Industrie De Nora Spa
- LiqTech International Inc.
- OriginClear Inc.
- Schlumberger Ltd.
- Sorbster Inc.
- Veolia Environment SA
- WesTech Engineering LLC
- Xylem Inc.
Qualitative and quantitative analysis of companies has been conducted to help clients understand the wider business environment as well as the strengths and weaknesses of key industry players. Data is qualitatively analyzed to categorize companies as pure play, category-focused, industry-focused, and diversified; it is quantitatively analyzed to categorize companies as dominant, leading, strong, tentative, and weak.
Recent Development and News in Fracking water treatment market
- In August, 2024, Baker Hughes Co. launched its new Aqua-Cycle mobile treatment unit, specifically designed for high-salinity brine from Permian Basin operations, improving water reuse rates by up to 95%.
- In December, 2024, Xylem Inc. announced the purchase of a majority stake in Idrica, a leading water data analytics firm, to integrate advanced digital twin and AI capabilities into its water management platforms.
- In January, 2025, Xylem Inc. completed its acquisition of Heusser Water Solutions AG, expanding its portfolio of advanced water treatment technologies and systems integration services in Europe.
- In March, 2025, SLB announced a pilot project with EOG Resources, Inc. deploying the TETRA Oasis Total Desalination Solution (TDS), a full-cycle platform for produced water treatment and mineral recovery.
Dive into Technavio’s robust research methodology, blending expert interviews, extensive data synthesis, and validated models for unparalleled Fracking Water Treatment Market insights. See full methodology.
| Market Scope | |
|---|---|
| Page number | 303 |
| Base year | 2025 |
| Historic period | 2020-2024 |
| Forecast period | 2026-2030 |
| Growth momentum & CAGR | Accelerate at a CAGR of 6% |
| Market growth 2026-2030 | USD 176.3 million |
| Market structure | Fragmented |
| YoY growth 2025-2026(%) | 5.7% |
| Key countries | US, Canada, Mexico, China, Australia, India, Indonesia, Japan, South Korea, Argentina, Brazil, Chile, Poland, UK, Germany, France, The Netherlands, Spain, Saudi Arabia, UAE, South Africa, Algeria and Egypt |
| Competitive landscape | Leading Companies, Market Positioning of Companies, Competitive Strategies, and Industry Risks |
Research Analyst Overview
- The fracking water treatment market is transitioning from a cost-centric disposal model to a value-driven resource management framework. This evolution is defined by the strategic adoption of advanced technologies designed to handle the complexities of flowback and produced water.
- The industry is moving beyond basic treatment and recycle methods, increasingly investing in sophisticated solutions like membrane filtration, electrocoagulation, and thermal distillation to achieve higher water recovery rates and meet stringent environmental standards. A key trend influencing boardroom-level capital allocation is the deployment of modular and mobile treatment units, which offer greater operational flexibility and scalability.
- The adoption of these systems has enabled operators to achieve up to a 30% faster deployment time compared to traditional fixed facilities. This shift is driven by the need to minimize freshwater consumption, reduce operational expenditures associated with water transport, and mitigate the long-term liabilities of deep well injection.
- As a result, technologies enabling zero liquid discharge and effective brine concentration are gaining prominence, positioning water management as a critical component of sustainable and profitable unconventional resource development.
What are the Key Data Covered in this Fracking Water Treatment Market Research and Growth Report?
-
What is the expected growth of the Fracking Water Treatment Market between 2026 and 2030?
-
USD 176.3 million, at a CAGR of 6%
-
-
What segmentation does the market report cover?
-
The report is segmented by Application (Treatment and recycle, and Deep well injection), End-user (Commercial, Industrial, and Residential), Type (Membrane filtration, Electrocoagulation, Biological treatment, Distillation, and Others) and Geography (North America, APAC, South America, Europe, Middle East and Africa)
-
-
Which regions are analyzed in the report?
-
North America, APAC, South America, Europe and Middle East and Africa
-
-
What are the key growth drivers and market challenges?
-
Increasing consumption of natural gas, Uncertainty in crude oil prices
-
-
Who are the major players in the Fracking Water Treatment Market?
-
Alfa Laval AB, Anguil Environmental Systems, Aquatech International LLC, Baker Hughes Co., Calfrac Well Services Ltd., ChampionX Corp., Cudd Energy Services, DuPont de Nemours Inc., Ecologix Environmental Systems, Filtra Systems Co., Fluence Corp. Ltd., Halliburton Co., Industrie De Nora Spa, LiqTech International Inc., OriginClear Inc., Schlumberger Ltd., Sorbster Inc., Veolia Environment SA, WesTech Engineering LLC and Xylem Inc.
-
Market Research Insights
- The dynamics of the fracking water treatment market are shifting toward efficiency and sustainability, driven by a combination of regulatory pressures and economic imperatives. The focus on a circular water economy is compelling operators to adopt advanced water stewardship programs that prioritize onsite treatment and reuse over traditional disposal methods.
- This strategic move is supported by tangible performance improvements; for instance, integrated water management solutions incorporating mobile treatment units have been shown to reduce freshwater acquisition costs by up to 50% and lower water transportation expenses by over 70% in certain basins.
- This emphasis on sustainable production practices enhances operational resilience and aligns with corporate environmental, social, and governance (ESG) goals, making effective water management a critical competitive differentiator.
We can help! Our analysts can customize this fracking water treatment market research report to meet your requirements.
 RIA -
RIA - 
