Froth Flotation Chemicals Market Analysis APAC, Europe, North America, South America, Middle East and Africa - China, US, India, Russia, Canada - Size and Forecast 2024-2028

Froth Flotation Chemicals Market Analysis APAC, Europe, North America, South America, Middle East and Africa - China, US, India, Russia, Canada - Size and Forecast 2024-2028

Published: Jul 2024 173 Pages SKU: IRTNTR72925

Market Overview at a Glance

$249.4 Mn
Market Opportunity
2.12%
CAGR
2.06
YoY growth 2023-2024(%)

Froth Flotation Chemicals Market Size 2024-2028 

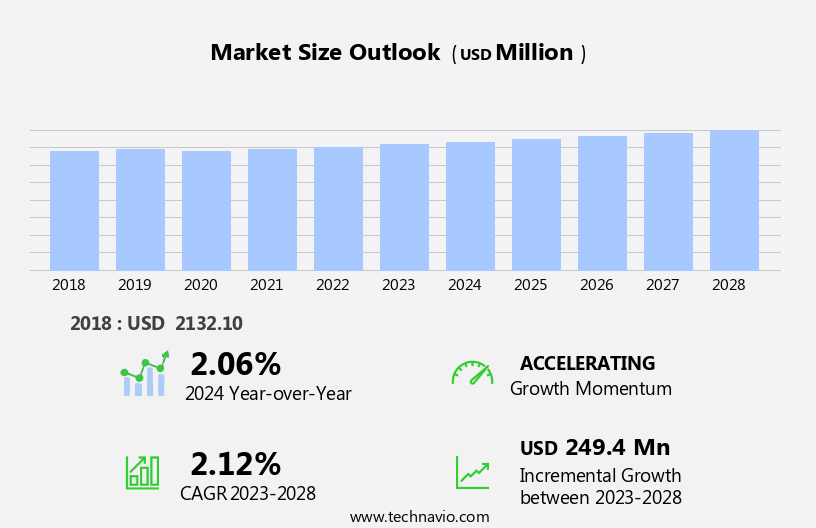
The froth flotation chemicals market size is forecast to increase by USD 249.4 million at a CAGR of 2.12% between 2023 and 2028.

  • The market is experiencing significant growth due to the increasing demand for froth flotation in the mining industry. This process is essential for separating and purifying minerals, making it a crucial aspect of mining flotation chemicals. A notable trend in the market is the growing utilization of mixed collectors during the flotation process. 
  • Mixed collectors offer enhanced efficiency and selectivity, leading to improved mineral recovery rates. However, the high cost of froth flotation remains a challenge for market growth. Despite this, the market is expected to continue expanding due to the essential role of froth flotation and mining chemicals in the mining industry and the ongoing research and development efforts aimed at reducing costs and enhancing efficiency.

What will be the Size of the Froth Flotation Chemicals Market During the Forecast Period?

Froth Flotation Chemicals Market Size

 Request Free Sample

  • The market encompasses a range of specialized chemicals utilized In the mineral processing industry for separating and concentrating valuable minerals, such as iron ore, feldspar, quartz, calcite, potash, barite, phosphate, fluorspar, base metals, and precious metals. These chemicals facilitate the attachment of hydrophobic minerals to hydrophilic bubbles in a froth, enabling their selective separation from the pulp. End-users industries, including mining, pulp and paper, sewage treatment, and produced water treatment, drive market demand. 
  • Key trends include the adoption of environmentally friendly chemicals, increasing urbanization leading to higher demand for paper goods and municipal water treatment, and the integration of froth flotation technologies in industrial waste management.
  • Industrialization and rising literacy rates further fuel market growth. MOSPI, hydrophobic and hydrophilic materials, paper recycling, and wastewater treatment are additional areas of application.

How is this Froth Flotation Chemicals Industry segmented and which is the largest segment?

The froth flotation chemicals industry research report provides comprehensive data (region-wise segment analysis), with forecasts and estimates in "USD million" for the period 2024-2028, as well as historical data from 2018-2022 for the following segments.

  • Type
    • Collectors
    • Frothers
    • Modifiers
    • Flocculants
  • End-user
    • Mining industry
    • Pulp and paper industry
    • Wastewater treatment
    • Plastic recycling industry
  • Geography
    • APAC
      • China
      • India
    • Europe
    • North America
      • Canada
      • US
    • South America
    • Middle East and Africa

By Type Insights

  • The collectors segment is estimated to witness significant growth during the forecast period.

Collectors, a crucial category of flotation reagents, function by modifying mineral surfaces to exhibit hydrophobic properties during the flotation process. These compounds, featuring a polar group and a non-polar hydrocarbon chain, are essential for enhancing mineral recovery, particularly for those that are naturally hydrophilic. Anionic and cationic collectors are the two primary types employed in both direct and reverse flotation processes. Mineral processing industries, including those dealing with iron ore, feldspar, quartz, calcite, potash, barite, phosphate, fluorspar, base metals, precious metals, and sewage treatment, heavily rely on these collectors. The mining, pulp, paper, hydrophobic, and hydrophilic materials sectors also utilize these chemicals in mineral processing, paper recycling, wastewater treatment, and urbanization. Supply chain disorders, raw materials, industrialization, economic growth, regulatory framework, innovation, and product segments are significant factors influencing the demand for collectors.

Froth Flotation Chemicals Market Size

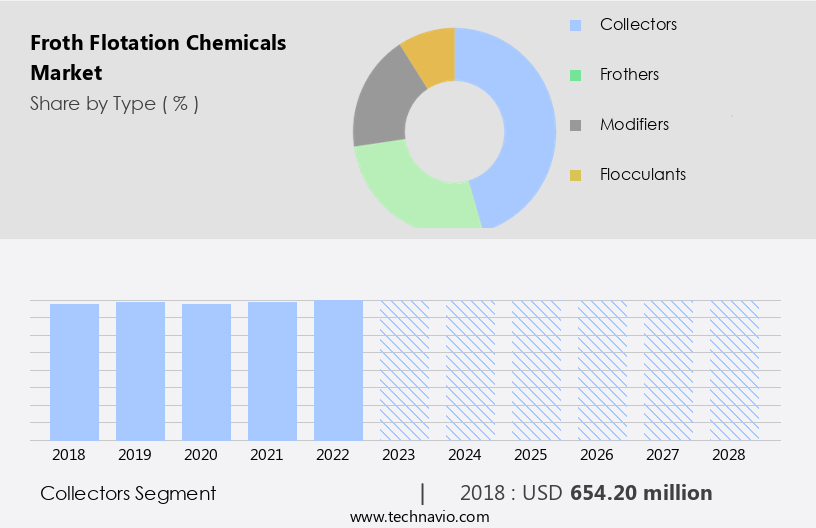
Get a glance at the  Froth Flotation Chemicals Industry report of share of various segments Request Free Sample

The Collectors segment was valued at USD 654.20 million in 2018 and showed a gradual increase during the forecast period.

Regional Analysis

  • APAC is estimated to contribute 40% to the growth of the global market during the forecast period.

Technavio's analysts have elaborately explained the regional trends and drivers that shape the market during the forecast period.

Froth Flotation Chemicals Market Share by Geography

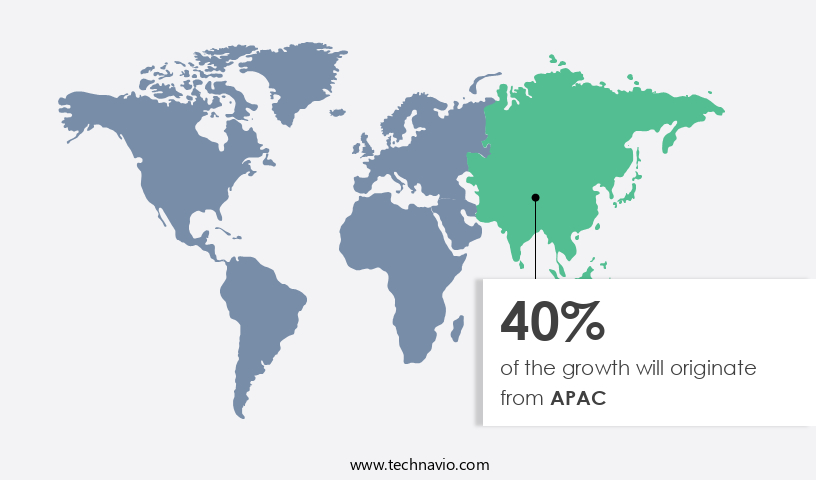
For more insights on the market share of various regions, Request Free Sample

The Asia Pacific region is anticipated to dominate the market due to the significant demand from the mineral processing industry. The expanding mining sector in APAC, driven by the increasing requirement for raw materials like iron, aluminum, and others from developing economies, fuels the market growth. With substantial mineral reserves of aluminum, coal, iron, and more, countries such as China, India, Australia, Malaysia, and others witness intensive mining operations. Froth flotation chemicals play a crucial role In the mining industry by facilitating mineral recovery from slurries, impurity separation, and other applications.

Market Dynamics

Our  researchers analyzed the data with 2023 as the base year, along with the key drivers, trends, and challenges. A holistic analysis of drivers will help companies refine their marketing strategies to gain a competitive advantage.

What are the key market drivers leading to the rise In the adoption of Froth Flotation Chemicals Industry?

Increasing demand for froth flotation in mining industry is the key driver of the market.

  • Froth flotation chemicals play a crucial role In the mining industry by facilitating the separation of valuable minerals from their ores during the froth flotation process. These chemicals, including collectors, dispersants, and frothers, enable minerals to attach to air bubbles, improving their wettability characteristics and reducing the mixture's stability. The use of froth flotation chemicals is increasingly important due to the decline In the grade of mineral ores and the need for efficient mineral processing. Froth flotation chemicals are utilized In the extraction of various minerals such as iron ore, feldspar, quartz, calcite, potash, barite, phosphate, fluorspar, base metals, and precious metals.
  • In addition, they find applications in industries like pulp and paper, sewage treatment, wastewater treatment, urbanization, and paper recycling. The demand for froth flotation chemicals is influenced by several factors, including supply chain disorders, raw materials availability, consumer preferences, industrial policy amendments, geopolitical tensions, economic growth, and regulatory framework. The market is expected to witness significant growth due to the increasing adoption of environment-friendly chemicals in mining technologies, the expansion of end-user industries, and the recovery of industrial waste for reuse. The market is segmented into various product segments, including collectors, dispersants, frothers, and modifiers. Technological advancements and innovation are driving the development of new and improved froth flotation chemicals, leading to shifts in demand and the emergence of new applications.
  • The supply chain dynamics of the market are influenced by factors such as procurement, inventory management, product portfolios, capabilities, and regional specific strategies. The market is also impacted by economic slowdowns, stagflation, and supply chain concerns, making it essential for market players to stay informed of the latest developments and trends. Despite the challenges, the outlook for the market is positive, with increasing revenues, prices, and production expected In the estimated year and beyond. The market is expected to be driven by the growth of the manufacturing sector, the energy transition, and the demand for biochemicals and materials in various end markets and geographies.

What are the market trends shaping the Froth Flotation Chemicals Industry?

Growth in use of mixed collectors during flotation is the upcoming market trend.

  • The market encompasses a range of substances used In the mineral processing industry to enhance the selectivity and recovery of valuable minerals and metals during the froth flotation process. These chemicals include collectors, which are hydrophobic materials that promote the attachment of hydrophilic minerals to air bubbles for separation. Mixed collector systems, comprised of anionic or nonionic and anionic or cationic collectors, have gained popularity due to their ability to improve selectivity and reduce costs. Mixed collectors offer several advantages In the froth flotation process, such as increased froth carrying capacity, improved grades, less entrainment into final concentrate, improved middling particle flotation, and overall cost reduction.
  • These benefits are particularly valuable In the flotation of various minerals and metals, including iron ore, hematite, magnetite, quartz, feldspar, calcite, potash, barite, phosphate, fluorspar, base metals, precious metals, and more. For instance, In the flotation of phosphate, using oleic acid alone as a collector results in an inefficient process. However, employing a mixed collector system of oleic acid, linoleic acid, and linolenic acid significantly enhances the recovery of phosphate flotation. This system's advantages extend to various industries, including mining, pulp and paper, sewage treatment, water treatment, urbanization, and paper recycling. The market is influenced by several factors, including supply chain disorders, raw materials availability, industrial waste, economic growth, regulatory framework, innovation, and consumer preferences.
  • These factors impact the market's dynamics, revenues, prices, production, and logistics, necessitating regional-specific strategies and incentives for growth. In summary, the market plays a crucial role In the mineral processing industry by enhancing the selectivity and recovery of valuable minerals and metals. Mixed collector systems offer several advantages, including improved froth carrying capacity, grades, and cost reduction, making them a popular choice for various industries and applications. The market's growth is influenced by various factors, necessitating strategic approaches to address supply chain concerns, consumer preferences, and regulatory frameworks.

What challenges does the Froth Flotation Chemicals Industry face during its growth?

High cost of froth flotation process is a key challenge affecting the industry growth.

  • The market is driven by the demand for minerals such as Iron ore, Feldspar, Quartz, Calcite, Potash, Barite, Phosphate, Fluorspar, Base metals, and Precious metals. These chemicals play a crucial role In the mineral processing industry, particularly In the froth flotation process. However, the high cost of these chemicals is a significant challenge for end-user industries, including mining, pulp and paper, sewage treatment, and water treatment. The cost is attributed to the rising expenses of raw materials like flotation reagents and flocculants, as well as processing, logistics, and transportation. To mitigate these costs, manufacturers are focusing on innovations and technologies to improve efficiency and reduce waste.
  • Additionally, the increasing urbanization and literacy rates, coupled with the growth of paper goods industries, are expected to boost demand for these chemicals. However, supply chain disorders, industrial waste, and regulatory frameworks pose challenges to market growth. The market outlook is promising, with potential opportunities in industrial waste treatment, incentives for environmentally friendly chemicals, and the energy transition towards renewable sources. The market is segmented into various product types, technologies, and applications, with leading end-users being the mining, paper recycling, and municipal water treatment industries. The historical years have shown steady growth, with estimated revenues and prices continuing to increase In the outlook period.
  • Despite challenges such as economic slowdown, stagflation, and supply chain dynamics, the market is expected to witness significant growth due to shifts in demand and product types.

Exclusive Customer Landscape

The froth flotation chemicals market forecasting report includes the adoption lifecycle of the market, covering from the innovator's stage to the laggard's stage. It focuses on adoption rates in different regions based on penetration. Furthermore, the froth flotation chemicals market report also includes key purchase criteria and drivers of price sensitivity to help companies evaluate and develop their market growth analysis strategies.
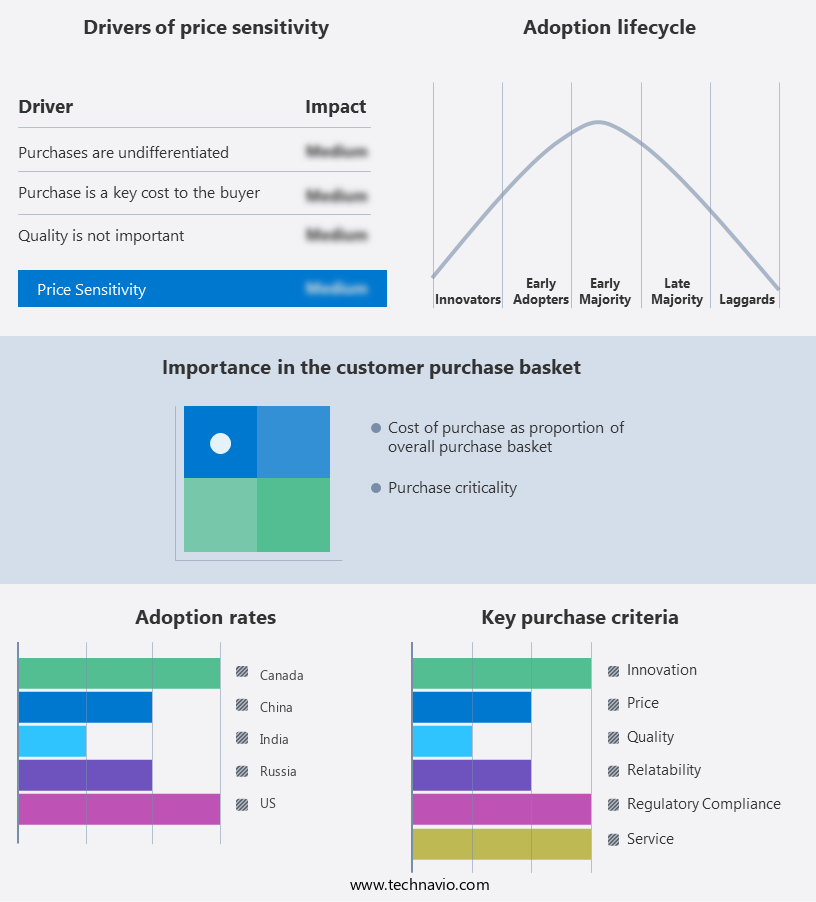
Froth Flotation Chemicals Market Share by Geography

 Customer Landscape

Key Companies & Market Insights

Companies are implementing various strategies, such as strategic alliances, froth flotation chemicals market forecast, partnerships, mergers and acquisitions, geographical expansion, and product/service launches, to enhance their presence In the industry.

The industry research and growth report includes detailed analyses of the competitive landscape of the market and information about key companies, including:

  • Arkema SA
  • BASF SE
  • Celanese Corp.
  • Chevron Phillips Chemical Co. LLC
  • Clariant International Ltd.
  • Dow Inc.
  • Ecolab Inc.
  • Huntsman Corp
  • Nasaco International Ltd
  • Nouryon
  • Qingdao Sesame Chemical Co. Ltd.
  • Quadra Chemicals Ltd.
  • Senmin International Pty Ltd.
  • Solenis
  • Solvay SA
  • Y and X Beijing Technology Co. Ltd.

Qualitative and quantitative analysis of companies has been conducted to help clients understand the wider business environment as well as the strengths and weaknesses of key industry players. Data is qualitatively analyzed to categorize companies as pure play, category-focused, industry-focused, and diversified; it is quantitatively analyzed to categorize companies as dominant, leading, strong, tentative, and weak.

Research Analyst Overview

The market encompasses a broad spectrum of substances employed In the mineral processing industry to enhance the separation of valuable minerals from their host rocks. These chemicals play a crucial role In the mineral processing industry, particularly In the concentration of base metals, precious metals, and industrial minerals such as iron ore, feldspar, quartz, calcite, potash, barite, phosphate, fluorspar, and others. The froth flotation process relies on the selective adherence of hydrophobic minerals to hydrophilic collector molecules, which are then transported to the froth layer at the surface of the pulp for collection. The choice of flotation chemicals depends on the specific mineral composition and the desired product quality.

The market dynamics of froth flotation chemicals are influenced by several factors. Industrialization and urbanization have led to an increase in demand for minerals and metals, driving the need for efficient mineral processing technologies. The mining industry's focus on reducing production costs and improving recovery rates has also spurred innovation in flotation chemicals. The supply chain for froth flotation chemicals is subject to various disruptions, including raw material availability and price fluctuations. The mining industry's shift towards more environmentally friendly practices has also led to a growing demand for chemicals that minimize water consumption and reduce wastewater generation.

The paper and pulp industry is a significant end-user of froth flotation chemicals, particularly In the recycling process. The industry's growth is influenced by consumer preferences for sustainable and eco-friendly products, as well as economic growth and industrial policy amendments. The packaging industry is another major consumer of froth flotation chemicals, particularly In the production of paper and paper-based products. The industry's growth is influenced by economic factors such as credit availability, consumer preferences, and geopolitical tensions. The procurement and inventory management practices of end-user industries also impact the market. Companies are increasingly focusing on optimizing their product portfolios and capabilities to meet changing market demands and supply chain concerns.

The energy transition and manufacturing sector growth are also significant factors influencing the market. The demand for biochemicals and materials used in renewable energy is growing, and the mining industry is adapting to meet this demand. Despite these growth opportunities, the market faces challenges such as supply chain disorders, raw material availability, and price volatility. Regulatory frameworks and geopolitical tensions can also impact the market's growth prospects. In conclusion, the market is a dynamic and complex industry that plays a crucial role in the mineral processing and manufacturing sectors. The market's growth is influenced by various factors, including industrialization, urbanization, consumer preferences, and regulatory frameworks. Companies operating in this market must stay abreast of these trends and adapt to meet changing market demands to remain competitive.

Market Scope

Report Coverage

Details

Page number

173

Base year

2023

Historic period

2018-2022

Forecast period

2024-2028

Growth momentum & CAGR

Accelerate at a CAGR of 2.12%

Market growth 2024-2028

USD 249.4 million

Market structure

Fragmented

YoY growth 2023-2024(%)

2.06

Key countries

China, US, India, Russia, and Canada

Competitive landscape

Leading Companies, Market Positioning of Companies, Competitive Strategies, and Industry Risks

Request Free Sample

What are the Key Data Covered in this Froth Flotation Chemicals Market Research and Growth Report?

  • CAGR of the Froth Flotation Chemicals industry during the forecast period
  • Detailed information on factors that will drive the growth and forecasting between 2024 and 2028
  • Precise estimation of the size of the market and its contribution of the industry in focus to the parent market
  • Accurate predictions about upcoming growth and trends and changes in consumer behaviour
  • Growth of the market across APAC, Europe, North America, South America, and Middle East and Africa
  • Thorough analysis of the market's competitive landscape and detailed information about companies
  • Comprehensive analysis of factors that will challenge the froth flotation chemicals market growth of industry companies

We can help! Our analysts can customize this froth flotation chemicals market research report to meet your requirements.

Get in touch

1 Executive Summary

  • 1.1 Market overview
    • Executive Summary - Chart on Market Overview
    • Executive Summary - Data Table on Market Overview
    • Executive Summary - Chart on Global Market Characteristics
    • Executive Summary - Chart on Market by Geography
    • Executive Summary - Chart on Market Segmentation by Type
    • Executive Summary - Chart on Market Segmentation by End-user
    • Executive Summary - Chart on Incremental Growth
    • Executive Summary - Data Table on Incremental Growth
    • Executive Summary - Chart on Company Market Positioning

2 Market Landscape

  • 2.1 Market ecosystem
    • Parent Market
    • Data Table on - Parent Market
  • 2.2 Market characteristics
    • Market characteristics analysis
  • 2.3 Value chain analysis
    • Value Chain Analysis

3 Market Sizing

  • 3.1 Market definition
    • Offerings of companies included in the market definition
  • 3.2 Market segment analysis
    • Market segments
  • 3.3 Market size 2023
    • 3.4 Market outlook: Forecast for 2023-2028
      • Chart on Global - Market size and forecast 2023-2028 ($ million)
      • Data Table on Global - Market size and forecast 2023-2028 ($ million)
      • Chart on Global Market: Year-over-year growth 2023-2028 (%)
      • Data Table on Global Market: Year-over-year growth 2023-2028 (%)

    4 Historic Market Size

    • 4.1 Global Froth Flotation Chemicals Market 2018 - 2022
      • Historic Market Size - Data Table on Global Froth Flotation Chemicals Market 2018 - 2022 ($ million)
    • 4.2 Type segment analysis 2018 - 2022
      • Historic Market Size - Type Segment 2018 - 2022 ($ million)
    • 4.3 End-user segment analysis 2018 - 2022
      • Historic Market Size - End-user Segment 2018 - 2022 ($ million)
    • 4.4 Geography segment analysis 2018 - 2022
      • Historic Market Size - Geography Segment 2018 - 2022 ($ million)
    • 4.5 Country segment analysis 2018 - 2022
      • Historic Market Size - Country Segment 2018 - 2022 ($ million)

    5 Five Forces Analysis

    • 5.1 Five forces summary
      • Five forces analysis - Comparison between 2023 and 2028
    • 5.2 Bargaining power of buyers
      • Bargaining power of buyers - Impact of key factors 2023 and 2028
    • 5.3 Bargaining power of suppliers
      • Bargaining power of suppliers - Impact of key factors in 2023 and 2028
    • 5.4 Threat of new entrants
      • Threat of new entrants - Impact of key factors in 2023 and 2028
    • 5.5 Threat of substitutes
      • Threat of substitutes - Impact of key factors in 2023 and 2028
    • 5.6 Threat of rivalry
      • Threat of rivalry - Impact of key factors in 2023 and 2028
    • 5.7 Market condition
      • Chart on Market condition - Five forces 2023 and 2028

    6 Market Segmentation by Type

    • 6.1 Market segments
      • Chart on Type - Market share 2023-2028 (%)
      • Data Table on Type - Market share 2023-2028 (%)
    • 6.2 Comparison by Type
      • Chart on Comparison by Type
      • Data Table on Comparison by Type
    • 6.3 Collectors - Market size and forecast 2023-2028
      • Chart on Collectors - Market size and forecast 2023-2028 ($ million)
      • Data Table on Collectors - Market size and forecast 2023-2028 ($ million)
      • Chart on Collectors - Year-over-year growth 2023-2028 (%)
      • Data Table on Collectors - Year-over-year growth 2023-2028 (%)
    • 6.4 Frothers - Market size and forecast 2023-2028
      • Chart on Frothers - Market size and forecast 2023-2028 ($ million)
      • Data Table on Frothers - Market size and forecast 2023-2028 ($ million)
      • Chart on Frothers - Year-over-year growth 2023-2028 (%)
      • Data Table on Frothers - Year-over-year growth 2023-2028 (%)
    • 6.5 Modifiers - Market size and forecast 2023-2028
      • Chart on Modifiers - Market size and forecast 2023-2028 ($ million)
      • Data Table on Modifiers - Market size and forecast 2023-2028 ($ million)
      • Chart on Modifiers - Year-over-year growth 2023-2028 (%)
      • Data Table on Modifiers - Year-over-year growth 2023-2028 (%)
    • 6.6 Flocculants - Market size and forecast 2023-2028
      • Chart on Flocculants - Market size and forecast 2023-2028 ($ million)
      • Data Table on Flocculants - Market size and forecast 2023-2028 ($ million)
      • Chart on Flocculants - Year-over-year growth 2023-2028 (%)
      • Data Table on Flocculants - Year-over-year growth 2023-2028 (%)
    • 6.7 Market opportunity by Type
      • Market opportunity by Type ($ million)
      • Data Table on Market opportunity by Type ($ million)

    7 Market Segmentation by End-user

    • 7.1 Market segments
      • Chart on End-user - Market share 2023-2028 (%)
      • Data Table on End-user - Market share 2023-2028 (%)
    • 7.2 Comparison by End-user
      • Chart on Comparison by End-user
      • Data Table on Comparison by End-user
    • 7.3 Mining industry - Market size and forecast 2023-2028
      • Chart on Mining industry - Market size and forecast 2023-2028 ($ million)
      • Data Table on Mining industry - Market size and forecast 2023-2028 ($ million)
      • Chart on Mining industry - Year-over-year growth 2023-2028 (%)
      • Data Table on Mining industry - Year-over-year growth 2023-2028 (%)
    • 7.4 Pulp and paper industry - Market size and forecast 2023-2028
      • Chart on Pulp and paper industry - Market size and forecast 2023-2028 ($ million)
      • Data Table on Pulp and paper industry - Market size and forecast 2023-2028 ($ million)
      • Chart on Pulp and paper industry - Year-over-year growth 2023-2028 (%)
      • Data Table on Pulp and paper industry - Year-over-year growth 2023-2028 (%)
    • 7.5 Wastewater treatment - Market size and forecast 2023-2028
      • Chart on Wastewater treatment - Market size and forecast 2023-2028 ($ million)
      • Data Table on Wastewater treatment - Market size and forecast 2023-2028 ($ million)
      • Chart on Wastewater treatment - Year-over-year growth 2023-2028 (%)
      • Data Table on Wastewater treatment - Year-over-year growth 2023-2028 (%)
    • 7.6 Plastic recycling industry - Market size and forecast 2023-2028
      • Chart on Plastic recycling industry - Market size and forecast 2023-2028 ($ million)
      • Data Table on Plastic recycling industry - Market size and forecast 2023-2028 ($ million)
      • Chart on Plastic recycling industry - Year-over-year growth 2023-2028 (%)
      • Data Table on Plastic recycling industry - Year-over-year growth 2023-2028 (%)
    • 7.7 Market opportunity by End-user
      • Market opportunity by End-user ($ million)
      • Data Table on Market opportunity by End-user ($ million)

    8 Customer Landscape

    • 8.1 Customer landscape overview
      • Analysis of price sensitivity, lifecycle, customer purchase basket, adoption rates, and purchase criteria

    9 Geographic Landscape

    • 9.1 Geographic segmentation
      • Chart on Market share by geography 2023-2028 (%)
      • Data Table on Market share by geography 2023-2028 (%)
    • 9.2 Geographic comparison
      • Chart on Geographic comparison
      • Data Table on Geographic comparison
    • 9.3 APAC - Market size and forecast 2023-2028
      • Chart on APAC - Market size and forecast 2023-2028 ($ million)
      • Data Table on APAC - Market size and forecast 2023-2028 ($ million)
      • Chart on APAC - Year-over-year growth 2023-2028 (%)
      • Data Table on APAC - Year-over-year growth 2023-2028 (%)
    • 9.4 Europe - Market size and forecast 2023-2028
      • Chart on Europe - Market size and forecast 2023-2028 ($ million)
      • Data Table on Europe - Market size and forecast 2023-2028 ($ million)
      • Chart on Europe - Year-over-year growth 2023-2028 (%)
      • Data Table on Europe - Year-over-year growth 2023-2028 (%)
    • 9.5 North America - Market size and forecast 2023-2028
      • Chart on North America - Market size and forecast 2023-2028 ($ million)
      • Data Table on North America - Market size and forecast 2023-2028 ($ million)
      • Chart on North America - Year-over-year growth 2023-2028 (%)
      • Data Table on North America - Year-over-year growth 2023-2028 (%)
    • 9.6 South America - Market size and forecast 2023-2028
      • Chart on South America - Market size and forecast 2023-2028 ($ million)
      • Data Table on South America - Market size and forecast 2023-2028 ($ million)
      • Chart on South America - Year-over-year growth 2023-2028 (%)
      • Data Table on South America - Year-over-year growth 2023-2028 (%)
    • 9.7 Middle East and Africa - Market size and forecast 2023-2028
      • Chart on Middle East and Africa - Market size and forecast 2023-2028 ($ million)
      • Data Table on Middle East and Africa - Market size and forecast 2023-2028 ($ million)
      • Chart on Middle East and Africa - Year-over-year growth 2023-2028 (%)
      • Data Table on Middle East and Africa - Year-over-year growth 2023-2028 (%)
    • 9.8 China - Market size and forecast 2023-2028
      • Chart on China - Market size and forecast 2023-2028 ($ million)
      • Data Table on China - Market size and forecast 2023-2028 ($ million)
      • Chart on China - Year-over-year growth 2023-2028 (%)
      • Data Table on China - Year-over-year growth 2023-2028 (%)
    • 9.9 US - Market size and forecast 2023-2028
      • Chart on US - Market size and forecast 2023-2028 ($ million)
      • Data Table on US - Market size and forecast 2023-2028 ($ million)
      • Chart on US - Year-over-year growth 2023-2028 (%)
      • Data Table on US - Year-over-year growth 2023-2028 (%)
    • 9.10 India - Market size and forecast 2023-2028
      • Chart on India - Market size and forecast 2023-2028 ($ million)
      • Data Table on India - Market size and forecast 2023-2028 ($ million)
      • Chart on India - Year-over-year growth 2023-2028 (%)
      • Data Table on India - Year-over-year growth 2023-2028 (%)
    • 9.11 Russia - Market size and forecast 2023-2028
      • Chart on Russia - Market size and forecast 2023-2028 ($ million)
      • Data Table on Russia - Market size and forecast 2023-2028 ($ million)
      • Chart on Russia - Year-over-year growth 2023-2028 (%)
      • Data Table on Russia - Year-over-year growth 2023-2028 (%)
    • 9.12 Canada - Market size and forecast 2023-2028
      • Chart on Canada - Market size and forecast 2023-2028 ($ million)
      • Data Table on Canada - Market size and forecast 2023-2028 ($ million)
      • Chart on Canada - Year-over-year growth 2023-2028 (%)
      • Data Table on Canada - Year-over-year growth 2023-2028 (%)
    • 9.13 Market opportunity by geography
      • Market opportunity by geography ($ million)
      • Data Tables on Market opportunity by geography ($ million)

    10 Drivers, Challenges, and Opportunity/Restraints

    • 10.1 Market drivers
      • 10.2 Market challenges
        • 10.3 Impact of drivers and challenges
          • Impact of drivers and challenges in 2023 and 2028
        • 10.4 Market opportunities/restraints

          11 Competitive Landscape

          • 11.1 Overview
            • 11.2 Competitive Landscape
              • Overview on criticality of inputs and factors of differentiation
            • 11.3 Landscape disruption
              • Overview on factors of disruption
            • 11.4 Industry risks
              • Impact of key risks on business

            12 Competitive Analysis

            • 12.1 Companies profiled
              • Companies covered
            • 12.2 Market positioning of companies
              • Matrix on companies position and classification
            • 12.3 Arkema SA
              • Arkema SA - Overview
              • Arkema SA - Business segments
              • Arkema SA - Key news
              • Arkema SA - Key offerings
              • Arkema SA - Segment focus
            • 12.4 BASF SE
              • BASF SE - Overview
              • BASF SE - Business segments
              • BASF SE - Key news
              • BASF SE - Key offerings
              • BASF SE - Segment focus
            • 12.5 Chevron Phillips Chemical Co. LLC
              • Chevron Phillips Chemical Co. LLC - Overview
              • Chevron Phillips Chemical Co. LLC - Product / Service
              • Chevron Phillips Chemical Co. LLC - Key offerings
            • 12.6 Clariant International Ltd.
              • Clariant International Ltd. - Overview
              • Clariant International Ltd. - Business segments
              • Clariant International Ltd. - Key news
              • Clariant International Ltd. - Key offerings
              • Clariant International Ltd. - Segment focus
            • 12.7 Dow Inc.
              • Dow Inc. - Overview
              • Dow Inc. - Business segments
              • Dow Inc. - Key news
              • Dow Inc. - Key offerings
              • Dow Inc. - Segment focus
            • 12.8 Nasaco International Ltd
              • Nasaco International Ltd - Overview
              • Nasaco International Ltd - Product / Service
              • Nasaco International Ltd - Key offerings
            • 12.9 Nouryon
              • Nouryon - Overview
              • Nouryon - Product / Service
              • Nouryon - Key offerings
            • 12.10 Solenis
              • Solenis - Overview
              • Solenis - Product / Service
              • Solenis - Key offerings
            • 12.11 Solvay SA
              • Solvay SA - Overview
              • Solvay SA - Business segments
              • Solvay SA - Key news
              • Solvay SA - Key offerings
              • Solvay SA - Segment focus
            • 12.12 Y and X Beijing Technology Co. Ltd.
              • Y and X Beijing Technology Co. Ltd. - Overview
              • Y and X Beijing Technology Co. Ltd. - Product / Service
              • Y and X Beijing Technology Co. Ltd. - Key offerings

            13 Appendix

            • 13.1 Scope of the report
              • 13.2 Inclusions and exclusions checklist
                • Inclusions checklist
                • Exclusions checklist
              • 13.3 Currency conversion rates for US$
                • Currency conversion rates for US$
              • 13.4 Research methodology
                • Research methodology
              • 13.5 Data procurement
                • Information sources
              • 13.6 Data validation
                • Data validation
              • 13.7 Validation techniques employed for market sizing
                • Validation techniques employed for market sizing
              • 13.8 Data synthesis
                • Data synthesis
              • 13.9 360 degree market analysis
                • 360 degree market analysis
              • 13.10 List of abbreviations
                • List of abbreviations

              Research Methodology

              Technavio presents a detailed picture of the market by way of study, synthesis, and summation of data from multiple sources. The analysts have presented the various facets of the market with a particular focus on identifying the key industry influencers. The data thus presented is comprehensive, reliable, and the result of extensive research, both primary and secondary.

              INFORMATION SOURCES

              Primary sources

              • Manufacturers and suppliers
              • Channel partners
              • Industry experts
              • Strategic decision makers

              Secondary sources

              • Industry journals and periodicals
              • Government data
              • Financial reports of key industry players
              • Historical data
              • Press releases

              DATA ANALYSIS

              Data Synthesis

              • Collation of data
              • Estimation of key figures
              • Analysis of derived insights

              Data Validation

              • Triangulation with data models
              • Reference against proprietary databases
              • Corroboration with industry experts

              REPORT WRITING

              Qualitative

              • Market drivers
              • Market challenges
              • Market trends
              • Five forces analysis

              Quantitative

              • Market size and forecast
              • Market segmentation
              • Geographical insights
              • Competitive landscape

              Interested in this report?

              Get your sample now to see our research methodology and insights!

              Download Now

              Frequently Asked Questions

              Froth Flotation Chemicals market growth will increase by $ 249.4 mn during 2024-2028.

              The Froth Flotation Chemicals market is expected to grow at a CAGR of 2.12% during 2024-2028.

              Froth Flotation Chemicals market is segmented by Type( Collectors, Frothers, Modifiers, Flocculants) End-user( Mining industry, Pulp and paper industry, Wastewater treatment, Plastic recycling industry)

              Arkema SA, BASF SE, Celanese Corp., Chevron Phillips Chemical Co. LLC, Clariant International Ltd., Dow Inc., Ecolab Inc., Huntsman Corp, Nasaco International Ltd, Nouryon, Qingdao Sesame Chemical Co. Ltd., Quadra Chemicals Ltd., Senmin International Pty Ltd., Solenis, Solvay SA, Y and X Beijing Technology Co. Ltd. are a few of the key vendors in the Froth Flotation Chemicals market.

              APAC will register the highest growth rate of 40% among the other regions. Therefore, the Froth Flotation Chemicals market in APAC is expected to garner significant business opportunities for the vendors during the forecast period.

              China, US, India, Russia, Canada

              • Increasing demand for froth flotation in mining industryFroth flotation chemicals have wide applicability in the mining industry is the driving factor this market.
              • mainly according to the nature of the mine explored in a particular area. In the froth flotation process is the driving factor this market.
              • valuable minerals are separated from their ores using reagents on the surface of the froth layer. Froth flotation chemicals are used for the extraction of minerals by enabling them to attach to air bubbles. For instance is the driving factor this market.
              • froth flotation chemicals such as collectors are used for improving the wettability characteristics of the required minerals is the driving factor this market.
              • reducing the mixture's stability is the driving factor this market.
              • and separating the minerals. The decrease in the grade of mineral ores due to the aging of mineral deposits is encouraging the use of froth flotation chemicals for mineral processing. Following are some of the examples of the growing investments in mining projects across the world:In January 2022 is the driving factor this market.
              • Vedanta Ltd planned to invest in Saudi Arabia's mineral sector is the driving factor this market.
              • as the country looked to team up with global companies to become a leading producer of zinc metal.In March 2021 is the driving factor this market.
              • State-run Coal India Ltd (CIL) approved 32 mining projects is the driving factor this market.
              • which may see investments to the tune of around Rs 47 is the driving factor this market.
              • 300 crore as the company seeks to replace imports and move toward its 1 billion ton coal production target by 2023-2034. Such new mining projects are likely to increase the mining activities globally is the driving factor this market.
              • in turn is the driving factor this market.
              • increasing the demand for mining chemicals such as froth flotation chemicals during the forecast period. is the driving factor this market.

              The Froth Flotation Chemicals market vendors should focus on grabbing business opportunities from the Collectors segment as it accounted for the largest market share in the base year.