Frozen Breakfast Foods Market Analysis, Size, and Forecast 2026-2030: Europe (Germany, UK, and France), North America (US, Canada, and Mexico), APAC (China, Japan, and South Korea), Middle East and Africa (Saudi Arabia, UAE, and Turkey), South America (Brazil and Argentina), and Rest of World (ROW)

Frozen Breakfast Foods Market Analysis, Size, and Forecast 2026-2030:
Europe (Germany, UK, and France), North America (US, Canada, and Mexico), APAC (China, Japan, and South Korea), Middle East and Africa (Saudi Arabia, UAE, and Turkey), South America (Brazil and Argentina), and Rest of World (ROW)

Published: May 2026 305 Pages SKU: IRTNTR43500

Market Overview at a Glance

$2.99 B
Market Opportunity
8.8%
CAGR 2025 - 2030
39.7%
Europe Growth
$3.20 B
Bakery products segment 2024

Frozen Breakfast Foods Market Size 2026-2030

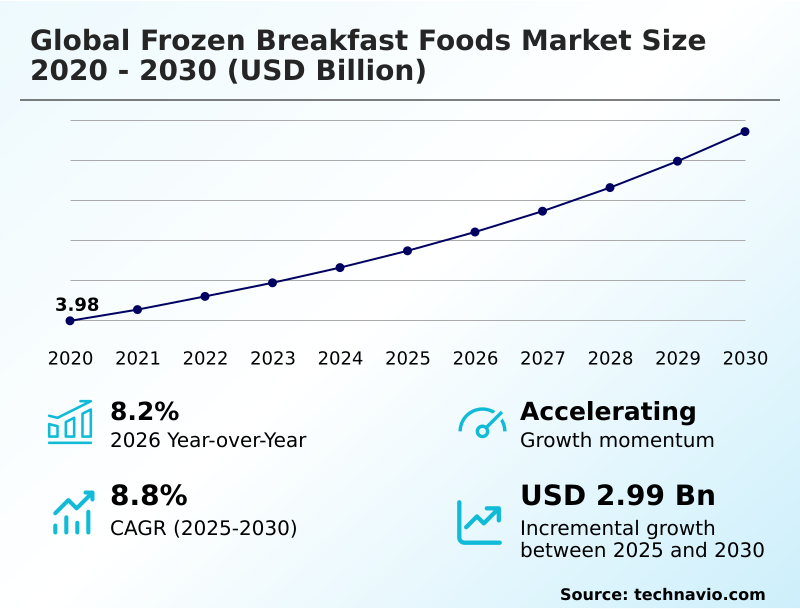
The Frozen Breakfast Foods Market size was valued at USD 5.73 billion in 2025, growing at a CAGR of 8.8% during the forecast period 2026-2030.

Major Market Trends & Insights

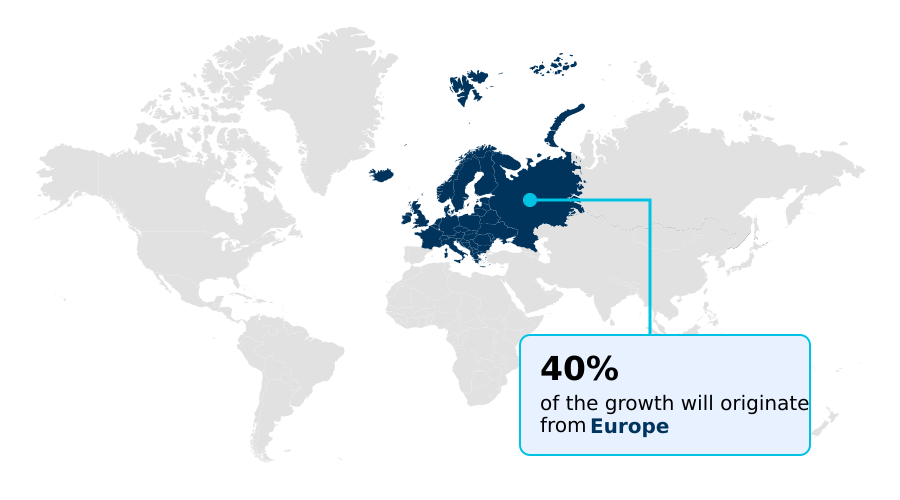
  • Europe dominated the market and accounted for a 39.7% growth during the forecast period.
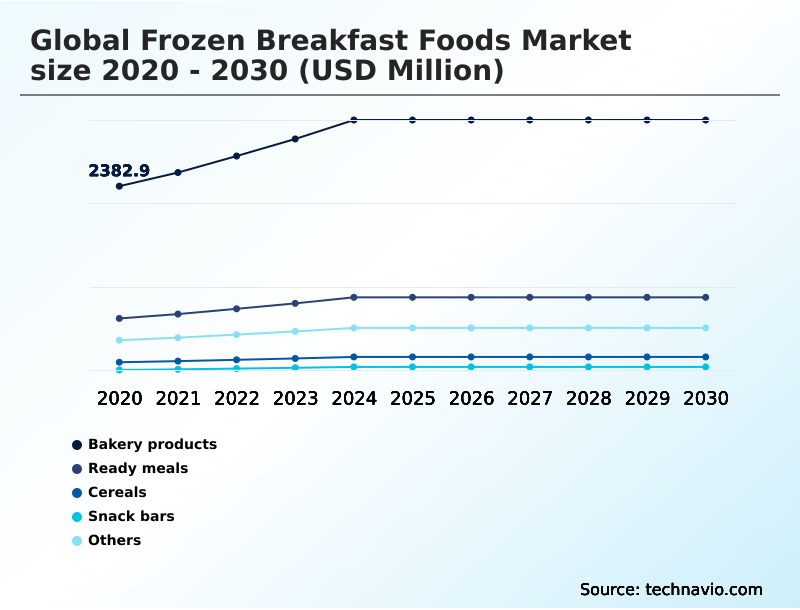
  • By Product Type - Bakery products segment was valued at USD 3.20 billion in 2024
  • By Distribution Channel - Offline segment accounted for the largest market revenue share in 2024

Market Size & Forecast

  • Historic Market Opportunities 2020-2024: USD 4.73 billion
  • Market Future Opportunities 2025-2030: USD 2.99 billion
  • CAGR from 2025 to 2030 : 8.8%

Market Summary

  • The frozen breakfast foods market is defined by a strategic pivot toward nutrient-density, with products fortified with protein outpacing traditional offerings by a growth margin of nearly 15%.
  • This shift is evident in supply chain operations, where manufacturers are retooling production lines to accommodate high-protein flour blends and plant-based ingredients, a move that increases raw material costs but reduces spoilage by 5% due to improved ingredient stability. A primary driver is the expansion of all-day breakfast consumption, which industrializes handheld formats for on-the-go consumers.
  • However, the market faces a significant challenge from widespread consumer skepticism of ultra-processed foods. This forces a clean-label imperative, requiring the removal of artificial preservatives and enhancers, which complicates formulation and can impact shelf-life stability and texture in products like frozen waffles and breakfast sandwiches.

What will be the Size of the Frozen Breakfast Foods Market during the forecast period?

Get Key Insights on Market Forecast (PDF) Request Free Sample

How is the Frozen Breakfast Foods Market Segmented?

The frozen breakfast foods industry research report provides comprehensive data (region-wise segment analysis), with forecasts and analysis for the period 2026-2030, as well as historical data from 2020-2024 for the following segments.

  • Product type
    • Bakery products
    • Ready meals
    • Cereals
    • Snack bars
    • Others
  • Distribution channel
    • Offline
    • Online
  • Flavor
    • Sweet
    • Savory
    • Plain
  • Geography
    • Europe
      • Germany
      • UK
      • France
    • North America
      • US
      • Canada
      • Mexico
    • APAC
      • China
      • Japan
      • South Korea
    • Middle East and Africa
      • Saudi Arabia
      • UAE
      • Turkey
    • South America
      • Brazil
      • Argentina
    • Rest of World (ROW)

How is the Frozen Breakfast Foods Market Segmented by Product Type?

The bakery products segment is estimated to witness significant growth during the forecast period.

The bakery products segment, accounting for over 60.3% of the frozen breakfast foods market, is fundamentally driven by consumer demand for convenient, heat-and-eat morning staples like waffles and croissants.

This segment is experiencing a shift toward premiumization, with a 15% rise in products featuring artisanal textures and gourmet flavor profiles.

Advancements in flash-freezing technology and the use of high-protein flour blends are enabling manufacturers to create functional bakery goods that appeal to health-conscious demographics.

The logistical advantages, including extended shelf life and reduced food waste for both retailers and households, continue to support steady revenue growth, positioning this segment as a resilient and high-volume component of the international breakfast landscape.

Request Free Sample

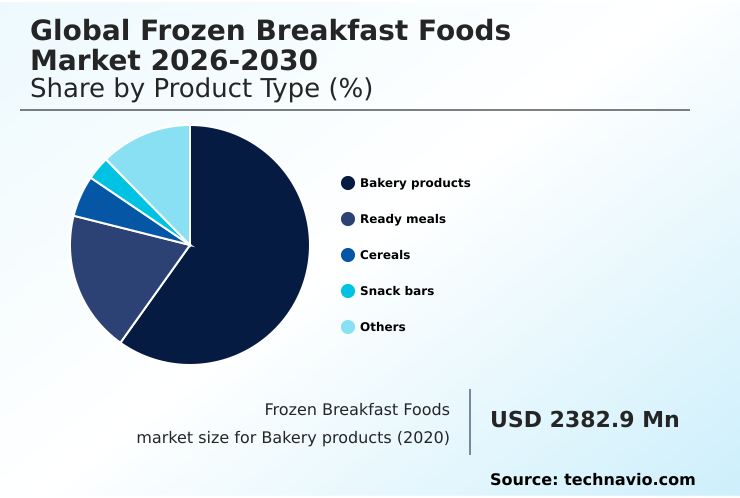
The Bakery products segment was valued at USD 3.20 billion in 2024 and showed a gradual increase during the forecast period.

Request Free Sample

How demand for the Frozen Breakfast Foods market is rising in the leading region?

Europe is estimated to contribute 39.7% to the growth of the global market during the forecast period.Technavio’s analysts have elaborately explained the regional trends and drivers that shape the market during the forecast period.

See How Frozen Breakfast Foods Market demand is rising in Europe Request Free Sample

Regional dynamics in the frozen breakfast foods market show significant variance, with Europe holding a 39.7% share of the incremental growth, marginally ahead of North America's 37.6%.

This European dominance is largely propelled by Germany, which contributes over 18% to the regional market, where consumer demand for organic and non-GMO certified bakery products is highest.

In contrast, the North American market, led by the US, focuses more on high-protein, handheld formats like breakfast sandwiches and burritos, reflecting a faster-paced, convenience-driven lifestyle.

This divergence necessitates distinct product strategies; for instance, European product lines emphasize clean-label formulations and sustainable packaging, while North American innovation centers on functional benefits and portability. These regional preferences directly influence cold chain logistics and private-label premiumization strategies.

What are the key Drivers, Trends, and Challenges in the Frozen Breakfast Foods Market?

Our researchers analyzed the data with 2025 as the base year, along with the key drivers, trends, and challenges. A holistic analysis of drivers will help companies refine their marketing strategies to gain a competitive advantage.

  • Strategic decisions in the frozen breakfast foods sector are increasingly data-driven, with manufacturers analyzing consumer queries to refine product development. For example, the search for the best high-protein frozen breakfast has led to a 20% increase in new product launches featuring fortified protein content over the last two years.
  • This is nearly double the growth rate of traditional sweet bakery items. Consumers exploring plant-based frozen breakfast options are influencing supply chains, pushing for greater transparency in ingredient sourcing and prompting investment in next-generation soy and pea protein analogs.
  • The demand for convenience is evident in searches for frozen breakfast for quick mornings, which directly correlates with the rising popularity of handheld formats and advanced microwaveable packaging that preserves texture. Families seeking gluten-free frozen breakfast sandwiches represent a key niche, driving innovation in alternative flours and clean-label formulations that avoid common allergens.
  • Similarly, inquiries about low-sugar frozen breakfast foods are compelling brands to adopt natural sweeteners and reduce overall carbohydrate content, aligning with broader wellness trends. Understanding these specific consumer needs allows companies to create targeted products that resonate more effectively than mass-market offerings.

What are the key market drivers leading to the rise in the adoption of Frozen Breakfast Foods Industry?

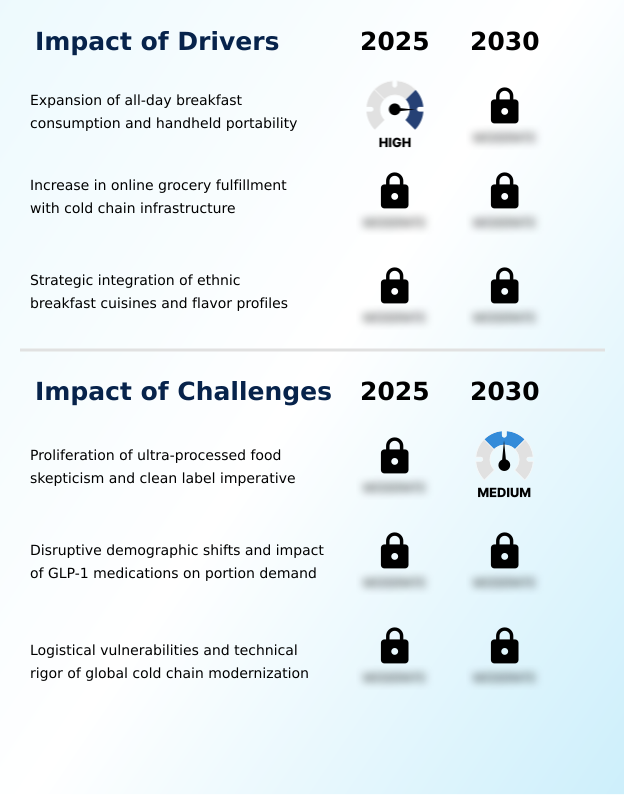
  • The expansion of all-day breakfast consumption, coupled with growing demand for handheld and portable formats, is a key driver for the market.

  • The expansion of all-day breakfast consumption is a critical driver for the frozen breakfast foods market, with data showing that over 40% of such items are now consumed outside of traditional morning hours, a 15% increase from five years ago.
  • This behavioral shift fuels demand for high-portability, handheld formats such as breakfast burritos and stuffed waffles that require minimal preparation.
  • The industrialization of these convenient, on-the-go options is essential for capturing sales in non-traditional channels like convenience stores and quick-service restaurants.
  • This trend aligns with modern, fragmented schedules, positioning frozen breakfast foods as versatile snacks or meal replacements and driving innovation in microwaveable packaging to enhance food quality and texture.

What are the market trends shaping the Frozen Breakfast Foods Industry?

  • The institutionalization of private-label premiumization is an emerging market trend, characterized by tiered retail strategies that challenge established national brands.

  • A primary trend reshaping the frozen breakfast foods market is the institutionalization of private-label premiumization, where retailer-owned brands now capture over 25% of the market share in some European countries, growing 1.5 times faster than national brands. This shift is driven by consumers seeking gourmet-style frozen waffles and organic breakfast bowls at a lower price point without sacrificing quality.
  • This trend forces established CPG firms to accelerate innovation, particularly in clean-label formulations and the development of plant-based protein alternatives. Consequently, the freezer aisle is becoming a more competitive space, characterized by a rapid introduction of high-quality, house-branded products that often set the pace for removing artificial ingredients and adopting sustainable packaging, ultimately improving ingredient transparency for the end consumer.

What challenges does the Frozen Breakfast Foods Industry face during its growth?

  • A key challenge affecting industry growth is the proliferation of skepticism toward ultra-processed foods and the corresponding imperative for clean-label formulations.

  • A formidable challenge for the frozen breakfast foods market is the growing consumer skepticism toward ultra-processed foods (UPFs), with surveys indicating that nearly 49% of consumers are actively trying to limit their intake. This movement pressures manufacturers to pursue clean-label formulations, a costly process that can increase production expenses by up to 20%.
  • The technical difficulty lies in removing synthetic preservatives and stabilizers from products like frozen breakfast sandwiches while maintaining expected taste, texture, and shelf life. Failure to transition toward nutrient-dense, whole-food-based alternatives risks significant market share loss to fresh and refrigerated options perceived as healthier by an increasingly ingredient-savvy consumer base.

Exclusive Technavio Analysis on Customer Landscape

The frozen breakfast foods market forecasting report includes the adoption lifecycle of the market, covering from the innovator’s stage to the laggard’s stage. It focuses on adoption rates in different regions based on penetration. Furthermore, the frozen breakfast foods market report also includes key purchase criteria and drivers of price sensitivity to help companies evaluate and develop their market growth analysis strategies.

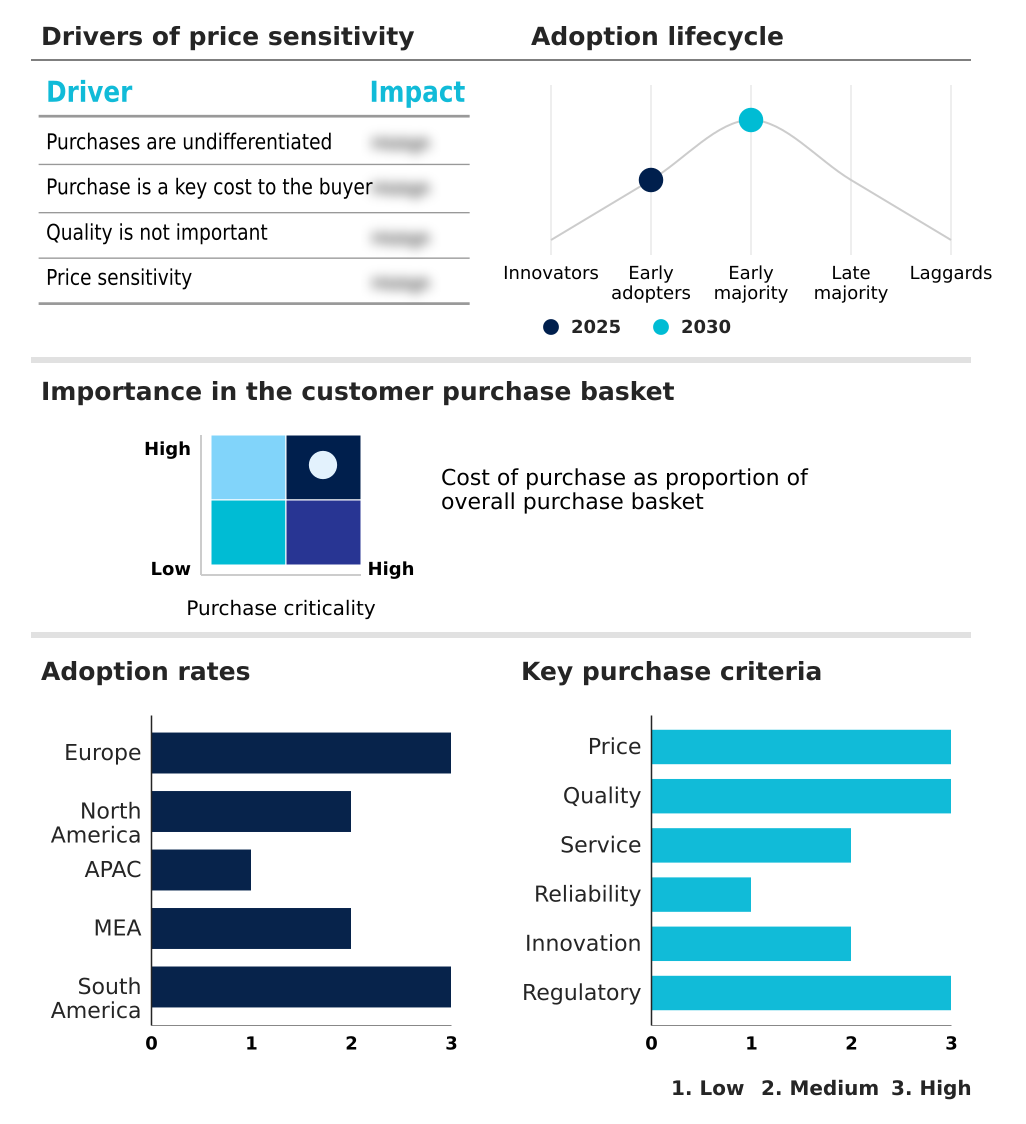
Customer Landscape of Frozen Breakfast Foods Industry

Competitive Landscape

Companies are implementing various strategies, such as strategic alliances, frozen breakfast foods market forecast, partnerships, mergers and acquisitions, geographical expansion, and product/service launches, to enhance their presence in the industry.

Ajinomoto Co. Inc. - Analysis reveals a portfolio focused on diversified frozen breakfast solutions, encompassing bowls and handheld formats engineered for consumer convenience and modern lifestyles.

The industry research and growth report includes detailed analyses of the competitive landscape of the market and information about key companies, including:

  • Ajinomoto Co. Inc.
  • Al Kabeer Group
  • Conagra Brands Inc.
  • Corporativo Bimbo SA de CV
  • Dr August Oetker KG
  • General Mills Inc.
  • Gujarat Co. Milk Ltd.
  • Hormel Foods Corp.
  • iD Fresh Food India Pvt. Ltd
  • ITC Ltd.
  • Kellanova
  • McCain Foods Ltd.
  • Nestle SA
  • Nomad Foods Ltd.
  • Quirch Foods LLC
  • Rich Products Corp.
  • The Kraft Heinz Co.
  • Turano Baking Co.
  • Tyson Foods Inc.
  • Unilever PLC

Qualitative and quantitative analysis of companies has been conducted to help clients understand the wider business environment as well as the strengths and weaknesses of key industry players. Data is qualitatively analyzed to categorize companies as pure play, category-focused, industry-focused, and diversified; it is quantitatively analyzed to categorize companies as dominant, leading, strong, tentative, and weak.

Market Intelligence Radar: High-Impact Developments & Growth Signals

  • In the Packaged Foods and Meats industry, heightened regulatory scrutiny on ultra-processed foods and mandatory front-of-pack nutritional labeling are compelling a reformulation of frozen breakfast foods. This requires a significant reduction in sodium and the removal of artificial preservatives to meet new health standards.
  • The widespread adoption of sustainable packaging solutions, driven by new government mandates targeting single-use plastics, is impacting the frozen breakfast foods market by necessitating a shift to recyclable and compostable materials, which can increase packaging costs but enhances brand perception among eco-conscious consumers.
  • The integration of IoT sensors and AI-driven analytics into cold chain logistics has become standard practice, improving temperature monitoring for temperature-sensitive products. This has successfully reduced spoilage rates by over 15% for items like frozen breakfast foods.
  • The mainstreaming of plant-based proteins, moving beyond niche vegan markets, is compelling the frozen breakfast foods sector to innovate with next-generation meat and egg analogs, which now constitute a significant portion of new product launches in the category.

Dive into Technavio’s robust research methodology, blending expert interviews, extensive data synthesis, and validated models for unparalleled Frozen Breakfast Foods Market insights. See full methodology.

Market Scope
Page number 305
Base year 2025
Historic period 2020-2024
Forecast period 2026-2030
Growth momentum & CAGR Accelerate at a CAGR of 8.8%
Market growth 2026-2030 USD 2985.6 million
Market structure Fragmented
YoY growth 2025-2026(%) 8.2%
Key countries Germany, UK, France, Italy, Spain, The Netherlands, US, Canada, Mexico, China, Japan, South Korea, India, Australia, Indonesia, Saudi Arabia, UAE, Turkey, South Africa, Israel, Brazil, Argentina and Chile
Competitive landscape Leading Companies, Market Positioning of Companies, Competitive Strategies, and Industry Risks

Request Free Sample

Research Analyst Overview

  • The frozen breakfast foods market ecosystem is a complex interplay of stakeholders, where raw material suppliers of items like high-protein flour and plant-based proteins form the foundational layer. These inputs are transformed by manufacturers, who must adhere to stringent food safety regulations, with compliance audits reducing recall incidents by up to 25%.
  • The value chain is heavily influenced by distribution channels, where offline supermarkets and hypermarkets still account for over 80% of sales, leveraging their established cold chain infrastructure. However, online DTC subscription models and e-commerce platforms represent the fastest-growing channel, enabling niche brands to bypass traditional retail gatekeepers.
  • End-users, ranging from time-constrained professionals to families, drive demand based on convenience, nutritional value, and flavor innovation. Supporting entities, including logistics providers specializing in the cold chain and packaging firms developing sustainable solutions, are critical for maintaining product integrity and meeting consumer expectations for environmental responsibility.

What are the Key Data Covered in this Frozen Breakfast Foods Market Research and Growth Report?

  • What is the expected growth of the Frozen Breakfast Foods Market between 2026 and 2030?

    • The Frozen Breakfast Foods Market is expected to grow by USD 2.99 billion during 2026-2030, registering a CAGR of 8.8%. Year-over-year growth in 2026 is estimated at 8.2%%. This acceleration is shaped by expansion of all-day breakfast consumption and handheld portability, which is intensifying demand across multiple end-use verticals covered in the report.

  • What segmentation does the market report cover?

    • The report is segmented by Product Type (Bakery products, Ready meals, Cereals, Snack bars, and Others), Distribution Channel (Offline, and Online), Flavor (Sweet, Savory, and Plain) and Geography (Europe, North America, APAC, Middle East and Africa, South America). Among these, the Bakery products segment is estimated to witness significant growth during the forecast period, driven by rising adoption across key application areas. Each segment includes detailed qualitative and quantitative analysis, along with historical data from 2020-2024 and forecasts through 2030 with year-over-year growth rates.

  • Which regions are analyzed in the report?

    • The report covers Europe, North America, APAC, Middle East and Africa and South America. Europe is estimated to contribute 39.7% to market growth during the forecast period. Country-level analysis includes Germany, UK, France, Italy, Spain, The Netherlands, US, Canada, Mexico, China, Japan, South Korea, India, Australia, Indonesia, Saudi Arabia, UAE, Turkey, South Africa, Israel, Brazil, Argentina and Chile, with dedicated market size tables and year-over-year growth for each.

  • What are the key growth drivers and market challenges?

    • The primary driver is expansion of all-day breakfast consumption and handheld portability, which is accelerating investment and industry demand. The main challenge is proliferation of ultra-processed food skepticism and clean label imperative, creating operational barriers for key market participants. The report quantifies the impact of each driver and challenge across 2026 and 2030 with comparative analysis.

  • Who are the major players in the Frozen Breakfast Foods Market?

    • Key vendors include Ajinomoto Co. Inc., Al Kabeer Group, Conagra Brands Inc., Corporativo Bimbo SA de CV, Dr August Oetker KG, General Mills Inc., Gujarat Co. Milk Ltd., Hormel Foods Corp., iD Fresh Food India Pvt. Ltd, ITC Ltd., Kellanova, McCain Foods Ltd., Nestle SA, Nomad Foods Ltd., Quirch Foods LLC, Rich Products Corp., The Kraft Heinz Co., Turano Baking Co., Tyson Foods Inc. and Unilever PLC. The report provides qualitative and quantitative analysis categorizing companies as dominant, leading, strong, tentative, and weak based on their market positioning. Company profiles include business segment analysis, SWOT assessment, key offerings, and recent strategic developments.

Market Research Insights

  • The competitive landscape for frozen breakfast foods is highly consolidated, with the top five vendors commanding over 45% of the market share through aggressive innovation in nutrient-density. Key players like Conagra Brands and Kellanova are focusing on high-protein and restaurant-inspired formats to meet evolving consumer demands.
  • For instance, recent product launches feature over 20% more protein per serving compared to legacy items. This strategic shift directly addresses the all-day breakfast trend, where breakfast items are consumed as snacks or meal replacements. This innovation push is a response to the challenge posed by premium private-label offerings from major retailers, which have intensified price competition.
  • To maintain margins, companies are optimizing cold chain logistics and investing in automated production to offset the rising costs of clean-label ingredients.

We can help! Our analysts can customize this frozen breakfast foods market research report to meet your requirements.

Get in touch

1. Executive Summary

1.1 Market overview

Executive Summary - Chart on Market Overview
Executive Summary - Data Table on Market Overview
Executive Summary - Chart on Global Market Characteristics
Executive Summary - Chart on Market by Geography
Executive Summary - Chart on Market Segmentation by Product Type
Executive Summary - Chart on Market Segmentation by Distribution Channel
Executive Summary - Chart on Market Segmentation by Flavor
Executive Summary - Chart on Incremental Growth
Executive Summary - Data Table on Incremental Growth
Executive Summary - Chart on Company Market Positioning

2. Technavio Analysis

2.1 Analysis of price sensitivity, lifecycle, customer purchase basket, adoption rates, and purchase criteria

2.2 Criticality of inputs and Factors of differentiation

Chart on Overview on criticality of inputs and factors of differentiation

2.3 Factors of disruption

Chart on Overview on factors of disruption

2.4 Impact of drivers and challenges

Chart on Impact of drivers and challenges in 2025 and 2030

3. Market Landscape

3.1 Market ecosystem

Chart on Parent Market
Data Table on - Parent Market

3.2 Market characteristics

Chart on Market characteristics analysis

3.3 Value chain analysis

Chart on Value chain analysis

4. Market Sizing

4.1 Market definition

Data Table on Offerings of companies included in the market definition

4.2 Market segment analysis

Market segments

4.3 Market size 2025

4.4 Market outlook: Forecast for 2025-2030

Chart on Global - Market size and forecast 2025-2030 ($ million)
Data Table on Global - Market size and forecast 2025-2030 ($ million)
Chart on Global Market: Year-over-year growth 2025-2030 (%)
Data Table on Global Market: Year-over-year growth 2025-2030 (%)

5. Historic Market Size

5.1 Global Frozen Breakfast Foods Market 2020 - 2024

Historic Market Size - Data Table on Global Frozen Breakfast Foods Market 2020 - 2024 ($ million)

5.2 Product Type segment analysis 2020 - 2024

Historic Market Size - Product Type Segment 2020 - 2024 ($ million)

5.3 Distribution Channel segment analysis 2020 - 2024

Historic Market Size - Distribution Channel Segment 2020 - 2024 ($ million)

5.4 Flavor segment analysis 2020 - 2024

Historic Market Size - Flavor Segment 2020 - 2024 ($ million)

5.5 Geography segment analysis 2020 - 2024

Historic Market Size - Geography Segment 2020 - 2024 ($ million)

5.6 Country segment analysis 2020 - 2024

Historic Market Size - Country Segment 2020 - 2024 ($ million)

6. Qualitative Analysis

6.1 Impact of AI in global frozen breakfast foods market

7. Five Forces Analysis

7.1 Five forces summary

Five forces analysis - Comparison between 2025 and 2030

7.2 Bargaining power of buyers

Bargaining power of buyers - Impact of key factors 2025 and 2030

7.3 Bargaining power of suppliers

Bargaining power of suppliers - Impact of key factors in 2025 and 2030

7.4 Threat of new entrants

Threat of new entrants - Impact of key factors in 2025 and 2030

7.5 Threat of substitutes

Threat of substitutes - Impact of key factors in 2025 and 2030

7.6 Threat of rivalry

Threat of rivalry - Impact of key factors in 2025 and 2030

7.7 Market condition

Chart on Market condition - Five forces 2025 and 2030

8. Market Segmentation by Product Type

8.1 Market segments

Chart on Product Type - Market share 2025-2030 (%)
Data Table on Product Type - Market share 2025-2030 (%)

8.2 Comparison by Product Type

Chart on Comparison by Product Type
Data Table on Comparison by Product Type

8.3 Bakery products - Market size and forecast 2025-2030

Chart on Bakery products - Market size and forecast 2025-2030 ($ million)
Data Table on Bakery products - Market size and forecast 2025-2030 ($ million)
Chart on Bakery products - Year-over-year growth 2025-2030 (%)
Data Table on Bakery products - Year-over-year growth 2025-2030 (%)

8.4 Ready meals - Market size and forecast 2025-2030

Chart on Ready meals - Market size and forecast 2025-2030 ($ million)
Data Table on Ready meals - Market size and forecast 2025-2030 ($ million)
Chart on Ready meals - Year-over-year growth 2025-2030 (%)
Data Table on Ready meals - Year-over-year growth 2025-2030 (%)

8.5 Cereals - Market size and forecast 2025-2030

Chart on Cereals - Market size and forecast 2025-2030 ($ million)
Data Table on Cereals - Market size and forecast 2025-2030 ($ million)
Chart on Cereals - Year-over-year growth 2025-2030 (%)
Data Table on Cereals - Year-over-year growth 2025-2030 (%)

8.6 Snack bars - Market size and forecast 2025-2030

Chart on Snack bars - Market size and forecast 2025-2030 ($ million)
Data Table on Snack bars - Market size and forecast 2025-2030 ($ million)
Chart on Snack bars - Year-over-year growth 2025-2030 (%)
Data Table on Snack bars - Year-over-year growth 2025-2030 (%)

8.7 Others - Market size and forecast 2025-2030

Chart on Others - Market size and forecast 2025-2030 ($ million)
Data Table on Others - Market size and forecast 2025-2030 ($ million)
Chart on Others - Year-over-year growth 2025-2030 (%)
Data Table on Others - Year-over-year growth 2025-2030 (%)

8.8 Market opportunity by Product Type

Market opportunity by Product Type ($ million)
Data Table on Market opportunity by Product Type ($ million)

9. Market Segmentation by Distribution Channel

9.1 Market segments

Chart on Distribution Channel - Market share 2025-2030 (%)
Data Table on Distribution Channel - Market share 2025-2030 (%)

9.2 Comparison by Distribution Channel

Chart on Comparison by Distribution Channel
Data Table on Comparison by Distribution Channel

9.3 Offline - Market size and forecast 2025-2030

Chart on Offline - Market size and forecast 2025-2030 ($ million)
Data Table on Offline - Market size and forecast 2025-2030 ($ million)
Chart on Offline - Year-over-year growth 2025-2030 (%)
Data Table on Offline - Year-over-year growth 2025-2030 (%)

9.4 Online - Market size and forecast 2025-2030

Chart on Online - Market size and forecast 2025-2030 ($ million)
Data Table on Online - Market size and forecast 2025-2030 ($ million)
Chart on Online - Year-over-year growth 2025-2030 (%)
Data Table on Online - Year-over-year growth 2025-2030 (%)

9.5 Market opportunity by Distribution Channel

Market opportunity by Distribution Channel ($ million)
Data Table on Market opportunity by Distribution Channel ($ million)

10. Market Segmentation by Flavor

10.1 Market segments

Chart on Flavor - Market share 2025-2030 (%)
Data Table on Flavor - Market share 2025-2030 (%)

10.2 Comparison by Flavor

Chart on Comparison by Flavor
Data Table on Comparison by Flavor

10.3 Sweet - Market size and forecast 2025-2030

Chart on Sweet - Market size and forecast 2025-2030 ($ million)
Data Table on Sweet - Market size and forecast 2025-2030 ($ million)
Chart on Sweet - Year-over-year growth 2025-2030 (%)
Data Table on Sweet - Year-over-year growth 2025-2030 (%)

10.4 Savory - Market size and forecast 2025-2030

Chart on Savory - Market size and forecast 2025-2030 ($ million)
Data Table on Savory - Market size and forecast 2025-2030 ($ million)
Chart on Savory - Year-over-year growth 2025-2030 (%)
Data Table on Savory - Year-over-year growth 2025-2030 (%)

10.5 Plain - Market size and forecast 2025-2030

Chart on Plain - Market size and forecast 2025-2030 ($ million)
Data Table on Plain - Market size and forecast 2025-2030 ($ million)
Chart on Plain - Year-over-year growth 2025-2030 (%)
Data Table on Plain - Year-over-year growth 2025-2030 (%)

10.6 Market opportunity by Flavor

Market opportunity by Flavor ($ million)
Data Table on Market opportunity by Flavor ($ million)

11. Customer Landscape

11.1 Customer landscape overview

Analysis of price sensitivity, lifecycle, customer purchase basket, adoption rates, and purchase criteria

12. Geographic Landscape

12.1 Geographic segmentation

Chart on Market share by geography 2025-2030 (%)
Data Table on Market share by geography 2025-2030 (%)

12.2 Geographic comparison

Chart on Geographic comparison
Data Table on Geographic comparison

12.3 Europe - Market size and forecast 2025-2030

Chart on Europe - Market size and forecast 2025-2030 ($ million)
Data Table on Europe - Market size and forecast 2025-2030 ($ million)
Chart on Europe - Year-over-year growth 2025-2030 (%)
Data Table on Europe - Year-over-year growth 2025-2030 (%)
Chart on Regional Comparison - Europe
Data Table on Regional Comparison - Europe

12.3.1 Germany - Market size and forecast 2025-2030

Chart on Germany - Market size and forecast 2025-2030 ($ million)
Data Table on Germany - Market size and forecast 2025-2030 ($ million)
Chart on Germany - Year-over-year growth 2025-2030 (%)
Data Table on Germany - Year-over-year growth 2025-2030 (%)

12.3.2 UK - Market size and forecast 2025-2030

Chart on UK - Market size and forecast 2025-2030 ($ million)
Data Table on UK - Market size and forecast 2025-2030 ($ million)
Chart on UK - Year-over-year growth 2025-2030 (%)
Data Table on UK - Year-over-year growth 2025-2030 (%)

12.3.3 France - Market size and forecast 2025-2030

Chart on France - Market size and forecast 2025-2030 ($ million)
Data Table on France - Market size and forecast 2025-2030 ($ million)
Chart on France - Year-over-year growth 2025-2030 (%)
Data Table on France - Year-over-year growth 2025-2030 (%)

12.3.4 Italy - Market size and forecast 2025-2030

Chart on Italy - Market size and forecast 2025-2030 ($ million)
Data Table on Italy - Market size and forecast 2025-2030 ($ million)
Chart on Italy - Year-over-year growth 2025-2030 (%)
Data Table on Italy - Year-over-year growth 2025-2030 (%)

12.3.5 Spain - Market size and forecast 2025-2030

Chart on Spain - Market size and forecast 2025-2030 ($ million)
Data Table on Spain - Market size and forecast 2025-2030 ($ million)
Chart on Spain - Year-over-year growth 2025-2030 (%)
Data Table on Spain - Year-over-year growth 2025-2030 (%)

12.3.6 The Netherlands - Market size and forecast 2025-2030

Chart on The Netherlands - Market size and forecast 2025-2030 ($ million)
Data Table on The Netherlands - Market size and forecast 2025-2030 ($ million)
Chart on The Netherlands - Year-over-year growth 2025-2030 (%)
Data Table on The Netherlands - Year-over-year growth 2025-2030 (%)

12.4 North America - Market size and forecast 2025-2030

Chart on North America - Market size and forecast 2025-2030 ($ million)
Data Table on North America - Market size and forecast 2025-2030 ($ million)
Chart on North America - Year-over-year growth 2025-2030 (%)
Data Table on North America - Year-over-year growth 2025-2030 (%)
Chart on Regional Comparison - North America
Data Table on Regional Comparison - North America

12.4.1 US - Market size and forecast 2025-2030

Chart on US - Market size and forecast 2025-2030 ($ million)
Data Table on US - Market size and forecast 2025-2030 ($ million)
Chart on US - Year-over-year growth 2025-2030 (%)
Data Table on US - Year-over-year growth 2025-2030 (%)

12.4.2 Canada - Market size and forecast 2025-2030

Chart on Canada - Market size and forecast 2025-2030 ($ million)
Data Table on Canada - Market size and forecast 2025-2030 ($ million)
Chart on Canada - Year-over-year growth 2025-2030 (%)
Data Table on Canada - Year-over-year growth 2025-2030 (%)

12.4.3 Mexico - Market size and forecast 2025-2030

Chart on Mexico - Market size and forecast 2025-2030 ($ million)
Data Table on Mexico - Market size and forecast 2025-2030 ($ million)
Chart on Mexico - Year-over-year growth 2025-2030 (%)
Data Table on Mexico - Year-over-year growth 2025-2030 (%)

12.5 APAC - Market size and forecast 2025-2030

Chart on APAC - Market size and forecast 2025-2030 ($ million)
Data Table on APAC - Market size and forecast 2025-2030 ($ million)
Chart on APAC - Year-over-year growth 2025-2030 (%)
Data Table on APAC - Year-over-year growth 2025-2030 (%)
Chart on Regional Comparison - APAC
Data Table on Regional Comparison - APAC

12.5.1 China - Market size and forecast 2025-2030

Chart on China - Market size and forecast 2025-2030 ($ million)
Data Table on China - Market size and forecast 2025-2030 ($ million)
Chart on China - Year-over-year growth 2025-2030 (%)
Data Table on China - Year-over-year growth 2025-2030 (%)

12.5.2 Japan - Market size and forecast 2025-2030

Chart on Japan - Market size and forecast 2025-2030 ($ million)
Data Table on Japan - Market size and forecast 2025-2030 ($ million)
Chart on Japan - Year-over-year growth 2025-2030 (%)
Data Table on Japan - Year-over-year growth 2025-2030 (%)

12.5.3 South Korea - Market size and forecast 2025-2030

Chart on South Korea - Market size and forecast 2025-2030 ($ million)
Data Table on South Korea - Market size and forecast 2025-2030 ($ million)
Chart on South Korea - Year-over-year growth 2025-2030 (%)
Data Table on South Korea - Year-over-year growth 2025-2030 (%)

12.5.4 India - Market size and forecast 2025-2030

Chart on India - Market size and forecast 2025-2030 ($ million)
Data Table on India - Market size and forecast 2025-2030 ($ million)
Chart on India - Year-over-year growth 2025-2030 (%)
Data Table on India - Year-over-year growth 2025-2030 (%)

12.5.5 Australia - Market size and forecast 2025-2030

Chart on Australia - Market size and forecast 2025-2030 ($ million)
Data Table on Australia - Market size and forecast 2025-2030 ($ million)
Chart on Australia - Year-over-year growth 2025-2030 (%)
Data Table on Australia - Year-over-year growth 2025-2030 (%)

12.5.6 Indonesia - Market size and forecast 2025-2030

Chart on Indonesia - Market size and forecast 2025-2030 ($ million)
Data Table on Indonesia - Market size and forecast 2025-2030 ($ million)
Chart on Indonesia - Year-over-year growth 2025-2030 (%)
Data Table on Indonesia - Year-over-year growth 2025-2030 (%)

12.6 Middle East and Africa - Market size and forecast 2025-2030

Chart on Middle East and Africa - Market size and forecast 2025-2030 ($ million)
Data Table on Middle East and Africa - Market size and forecast 2025-2030 ($ million)
Chart on Middle East and Africa - Year-over-year growth 2025-2030 (%)
Data Table on Middle East and Africa - Year-over-year growth 2025-2030 (%)
Chart on Regional Comparison - Middle East and Africa
Data Table on Regional Comparison - Middle East and Africa

12.6.1 Saudi Arabia - Market size and forecast 2025-2030

Chart on Saudi Arabia - Market size and forecast 2025-2030 ($ million)
Data Table on Saudi Arabia - Market size and forecast 2025-2030 ($ million)
Chart on Saudi Arabia - Year-over-year growth 2025-2030 (%)
Data Table on Saudi Arabia - Year-over-year growth 2025-2030 (%)

12.6.2 UAE - Market size and forecast 2025-2030

Chart on UAE - Market size and forecast 2025-2030 ($ million)
Data Table on UAE - Market size and forecast 2025-2030 ($ million)
Chart on UAE - Year-over-year growth 2025-2030 (%)
Data Table on UAE - Year-over-year growth 2025-2030 (%)

12.6.3 Turkey - Market size and forecast 2025-2030

Chart on Turkey - Market size and forecast 2025-2030 ($ million)
Data Table on Turkey - Market size and forecast 2025-2030 ($ million)
Chart on Turkey - Year-over-year growth 2025-2030 (%)
Data Table on Turkey - Year-over-year growth 2025-2030 (%)

12.6.4 South Africa - Market size and forecast 2025-2030

Chart on South Africa - Market size and forecast 2025-2030 ($ million)
Data Table on South Africa - Market size and forecast 2025-2030 ($ million)
Chart on South Africa - Year-over-year growth 2025-2030 (%)
Data Table on South Africa - Year-over-year growth 2025-2030 (%)

12.6.5 Israel - Market size and forecast 2025-2030

Chart on Israel - Market size and forecast 2025-2030 ($ million)
Data Table on Israel - Market size and forecast 2025-2030 ($ million)
Chart on Israel - Year-over-year growth 2025-2030 (%)
Data Table on Israel - Year-over-year growth 2025-2030 (%)

12.7 South America - Market size and forecast 2025-2030

Chart on South America - Market size and forecast 2025-2030 ($ million)
Data Table on South America - Market size and forecast 2025-2030 ($ million)
Chart on South America - Year-over-year growth 2025-2030 (%)
Data Table on South America - Year-over-year growth 2025-2030 (%)
Chart on Regional Comparison - South America
Data Table on Regional Comparison - South America

12.7.1 Brazil - Market size and forecast 2025-2030

Chart on Brazil - Market size and forecast 2025-2030 ($ million)
Data Table on Brazil - Market size and forecast 2025-2030 ($ million)
Chart on Brazil - Year-over-year growth 2025-2030 (%)
Data Table on Brazil - Year-over-year growth 2025-2030 (%)

12.7.2 Argentina - Market size and forecast 2025-2030

Chart on Argentina - Market size and forecast 2025-2030 ($ million)
Data Table on Argentina - Market size and forecast 2025-2030 ($ million)
Chart on Argentina - Year-over-year growth 2025-2030 (%)
Data Table on Argentina - Year-over-year growth 2025-2030 (%)

12.7.3 Chile - Market size and forecast 2025-2030

Chart on Chile - Market size and forecast 2025-2030 ($ million)
Data Table on Chile - Market size and forecast 2025-2030 ($ million)
Chart on Chile - Year-over-year growth 2025-2030 (%)
Data Table on Chile - Year-over-year growth 2025-2030 (%)

12.8 Market opportunity by geography

Market opportunity by geography ($ million)
Data Tables on Market opportunity by geography ($ million)

13. Drivers, Challenges, and Opportunity

13.1 Market drivers

Expansion of all-day breakfast consumption and handheld portability
Increase in online grocery fulfillment with cold chain infrastructure
Strategic integration of ethnic breakfast cuisines and flavor profiles

13.2 Market challenges

Proliferation of ultra-processed food skepticism and clean label imperative
Disruptive demographic shifts and impact of GLP-1 medications on portion demand
Logistical vulnerabilities and technical rigor of global cold chain modernization

13.3 Impact of drivers and challenges

Impact of drivers and challenges in 2025 and 2030

13.4 Market opportunities

Institutionalization of private-label premiumization and tiered retail strategies
Advancement of plant-based innovation and rise of flexitarian morning rituals
Expansion of DTC subscription models and e-commerce cold chain integration

14. Competitive Landscape

14.1 Overview

14.2

Overview on criticality of inputs and factors of differentiation

14.3 Landscape disruption

Overview on factors of disruption

14.4 Industry risks

Impact of key risks on business

15. Competitive Analysis

15.1 Companies profiled

Companies covered

15.2 Company ranking index

15.3 Market positioning of companies

Matrix on companies position and classification

15.4 Ajinomoto Co. Inc.

Ajinomoto Co. Inc. - Overview
Ajinomoto Co. Inc. - Business segments
Ajinomoto Co. Inc. - Key news
Ajinomoto Co. Inc. - Key offerings
Ajinomoto Co. Inc. - Segment focus
SWOT

15.5 Conagra Brands Inc.

Conagra Brands Inc. - Overview
Conagra Brands Inc. - Business segments
Conagra Brands Inc. - Key news
Conagra Brands Inc. - Key offerings
Conagra Brands Inc. - Segment focus
SWOT

15.6 Corporativo Bimbo SA de CV

Corporativo Bimbo SA de CV - Overview
Corporativo Bimbo SA de CV - Business segments
Corporativo Bimbo SA de CV - Key news
Corporativo Bimbo SA de CV - Key offerings
Corporativo Bimbo SA de CV - Segment focus
SWOT

15.7 General Mills Inc.

General Mills Inc. - Overview
General Mills Inc. - Business segments
General Mills Inc. - Key news
General Mills Inc. - Key offerings
General Mills Inc. - Segment focus
SWOT

15.8 Gujarat Co. Milk Ltd.

Gujarat Co. Milk Ltd. - Overview
Gujarat Co. Milk Ltd. - Product / Service
Gujarat Co. Milk Ltd. - Key offerings
SWOT

15.9 Hormel Foods Corp.

Hormel Foods Corp. - Overview
Hormel Foods Corp. - Business segments
Hormel Foods Corp. - Key news
Hormel Foods Corp. - Key offerings
Hormel Foods Corp. - Segment focus
SWOT

15.10 ITC Ltd.

ITC Ltd. - Overview
ITC Ltd. - Business segments
ITC Ltd. - Key news
ITC Ltd. - Key offerings
ITC Ltd. - Segment focus
SWOT

15.11 Kellanova

Kellanova - Overview
Kellanova - Business segments
Kellanova - Key offerings
Kellanova - Segment focus
SWOT

15.12 McCain Foods Ltd.

McCain Foods Ltd. - Overview
McCain Foods Ltd. - Product / Service
McCain Foods Ltd. - Key offerings
SWOT

15.13 Nestle SA

Nestle SA - Overview
Nestle SA - Business segments
Nestle SA - Key news
Nestle SA - Key offerings
Nestle SA - Segment focus
SWOT

15.14 Nomad Foods Ltd.

Nomad Foods Ltd. - Overview
Nomad Foods Ltd. - Product / Service
Nomad Foods Ltd. - Key offerings
SWOT

15.15 Rich Products Corp.

Rich Products Corp. - Overview
Rich Products Corp. - Product / Service
Rich Products Corp. - Key offerings
SWOT

15.16 The Kraft Heinz Co.

The Kraft Heinz Co. - Overview
The Kraft Heinz Co. - Business segments
The Kraft Heinz Co. - Key news
The Kraft Heinz Co. - Key offerings
The Kraft Heinz Co. - Segment focus
SWOT

15.17 Tyson Foods Inc.

Tyson Foods Inc. - Overview
Tyson Foods Inc. - Business segments
Tyson Foods Inc. - Key offerings
Tyson Foods Inc. - Segment focus
SWOT

15.18 Unilever PLC

Unilever PLC - Overview
Unilever PLC - Business segments
Unilever PLC - Key offerings
Unilever PLC - Segment focus
SWOT

16. Appendix

16.1 Scope of the report

Market definition
Objectives
Notes and caveats

16.2 Inclusions and exclusions checklist

Inclusions checklist
Exclusions checklist

16.3 Currency conversion rates for US$

16.4 Research methodology

16.5 Data procurement

Information sources

16.6 Data validation

16.7 Validation techniques employed for market sizing

16.8 Data synthesis

16.9 360 degree market analysis

16.10 List of abbreviations

Research Methodology

Technavio presents a detailed picture of the market by way of study, synthesis, and summation of data from multiple sources. The analysts have presented the various facets of the market with a particular focus on identifying the key industry influencers. The data thus presented is comprehensive, reliable, and the result of extensive research, both primary and secondary.

INFORMATION SOURCES

Primary sources

  • Manufacturers and suppliers
  • Channel partners
  • Industry experts
  • Strategic decision makers

Secondary sources

  • Industry journals and periodicals
  • Government data
  • Financial reports of key industry players
  • Historical data
  • Press releases

DATA ANALYSIS

Data Synthesis

  • Collation of data
  • Estimation of key figures
  • Analysis of derived insights

Data Validation

  • Triangulation with data models
  • Reference against proprietary databases
  • Corroboration with industry experts

REPORT WRITING

Qualitative

  • Market drivers
  • Market challenges
  • Market trends
  • Five forces analysis

Quantitative

  • Market size and forecast
  • Market segmentation
  • Geographical insights
  • Competitive landscape

Interested in this report?

Get your sample now to see our research methodology and insights!

Download Now

Frequently Asked Questions

Frozen Breakfast Foods market growth will increase by USD 2985.6 million during 2026-2030.

The Frozen Breakfast Foods market is expected to grow at a CAGR of 8.8% during 2026-2030.

Frozen Breakfast Foods market is segmented by Product type (Bakery products, Ready meals, Cereals, Snack bars, Others) Distribution channel (Offline, Online) Flavor (Sweet, Savory, Plain)

Ajinomoto Co. Inc., Al Kabeer Group, Conagra Brands Inc., Corporativo Bimbo SA de CV, Dr August Oetker KG, General Mills Inc., Gujarat Co. Milk Ltd., Hormel Foods Corp., iD Fresh Food India Pvt. Ltd, ITC Ltd., Kellanova, McCain Foods Ltd., Nestle SA, Nomad Foods Ltd., Quirch Foods LLC, Rich Products Corp., The Kraft Heinz Co., Turano Baking Co., Tyson Foods Inc., Unilever PLC are a few of the key vendors in the Frozen Breakfast Foods market.

Europe will register the highest growth rate of 39.7% among the other regions. Therefore, the Frozen Breakfast Foods market in Europe is expected to garner significant business opportunities for the vendors during the forecast period.

Germany, UK, France, Italy, Spain, The Netherlands, US, Canada, Mexico, China, Japan, South Korea, India, Australia, Indonesia, Saudi Arabia, UAE, Turkey, South Africa, Israel, Brazil, Argentina, Chile

  • Expansion of all-day breakfast consumption and handheld portability is the driving factor this market.

The Frozen Breakfast Foods market vendors should focus on grabbing business opportunities from the Product type segment as it accounted for the largest market share in the base year.
RIA - Research AI Assistant
Ask RIA