
Functional Chewing Gum Market Size and Forecast 2025-2029
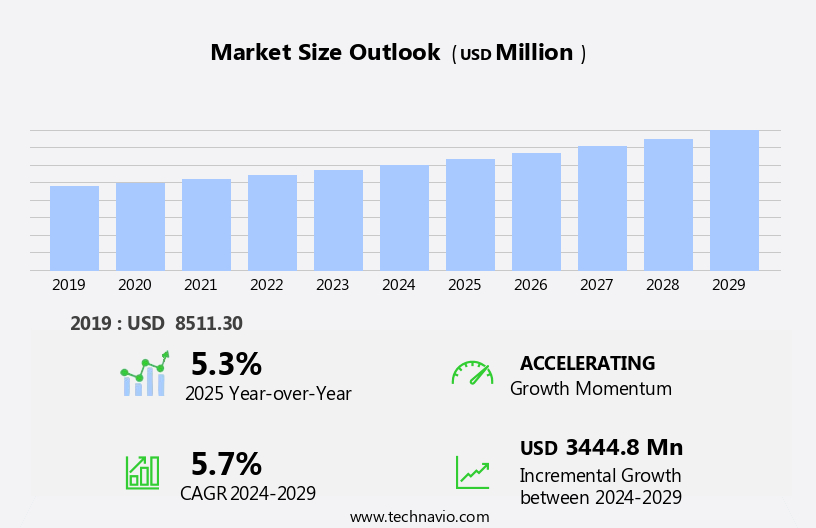
The functional chewing gum market size estimates the market to reach by USD 3.44 billion, at a CAGR of 5.7% between 2024 and 2029.APAC is expected to account for 55% of the growth contribution to the global market during this period. In 2019 the oral health gum segment was valued at USD 3.27 billion and has demonstrated steady growth since then.
|
Report Coverage |
Details |
|
Base year |
2024 |
|
Historic period |
2019-2023 |
|
Forecast period |
2025-2029 |
| Market structure | Fragmented |
|
Market growth 2025-2029 |
USD 3444.8 million |
- The market is experiencing significant growth, driven primarily by the rising demand for nicotine gum in smoking cessation therapy. This trend is fueled by increasing health consciousness and government regulations limiting tobacco use. Another key driver is the expanding online presence of functional chewing gum companies, enabling wider reach and accessibility to consumers. However, challenges persist in the form of inefficient chewing gum disposal techniques. As consumers become more environmentally conscious, companies must address this issue to maintain market competitiveness and meet evolving consumer demands. To capitalize on opportunities and navigate challenges effectively, market participants should focus on developing innovative, eco-friendly disposal solutions while continuing to cater to the growing demand for functional chewing gum in health and wellness applications.
What will be the Size of the Functional Chewing Gum Market during the forecast period?
The market continues to evolve, driven by consumer demand for products that offer both breath freshening agents and oral health benefits. The rheological properties of gum play a crucial role in its chewability assessment and sensory attributes, which are essential for consumer satisfaction. Xylitol content, a natural sweetener, is a popular choice for sugar-free formulations, contributing to the market's growth. Manufacturers are focusing on ingredient interactions, starch-based thickeners, and emulsifier selection to enhance gum film formation and improve texture modification. Release kinetics and shelf life stability are critical factors in the development of polyol blends and low-calorie sweetener systems.
Sensory perception and flavor delivery systems are also essential considerations, with natural flavoring agents and mouthfeel evaluation playing a significant role in consumer preference. Oral hydration and calcium supplementation are emerging trends, with texture profile analysis and coating technology being used to optimize these functionalities. Artificial sweeteners and cavities prevention through fluoride incorporation are other key areas of research and development. The market is expected to grow at a robust rate, with industry experts projecting a 6% annual expansion in the coming years. For instance, a leading chewing gum manufacturer reported a 12% increase in sales due to the introduction of a new sugar-free, low-calorie gum with enhanced oral health benefits.
How is this Functional Chewing Gum Industry segmented?
The functional chewing gum industry research report provides comprehensive data (region-wise segment analysis), with forecasts and estimates in "USD million" for the period 2025-2029, as well as historical data from 2019-2023 for the following segments.
- Product
- Oral health gum
- Nicotine gum
- Weight gum
- Lifestyle gum
- Distribution Channel
- Convenience stores
- Hypermarkets and supermarkets
- Online
- Flavor
- Mint
- Fruit
- Chocolate
- Cinnamon
- Others
- Geography
- North America
- US
- Canada
- Europe
- France
- Germany
- UK
- APAC
- Australia
- China
- India
- Japan
- South Korea
- Rest of World (ROW)
- North America
By Product Insights
The oral health gum segment is estimated to witness significant growth during the forecast period.
The market is witnessing significant growth due to the increasing consumer focus on oral health. Sugar-free oral health gums, in particular, are gaining popularity as they offer both breath freshening and oral health benefits. These gums stimulate saliva production, which helps neutralize plaque acid and reduce cavities, plaque, and gingivitis. The American Dental Association endorses chewing sugar-free gum for 20 minutes after meals as an effective way to maintain oral hygiene. The rheological properties of chewing gum play a crucial role in its texture and chewability. Natural gums and starch-based thickeners are commonly used to enhance these properties.
Xylitol content, a natural sweetener, is another key factor driving the market's growth due to its dental health benefits. Sensory attributes, such as taste, texture, and mouthfeel, are essential considerations in the development of functional chewing gums. Release kinetics, ingredient interactions, and gum film formation are critical aspects of gum production that require careful attention. Low-calorie sweeteners and sweetener systems are used to create a desirable taste profile without adding calories. Natural flavoring agents and coating technology are also important in enhancing the sensory experience of chewing gum. Oral hydration, calcium supplementation, and cavities prevention are additional benefits offered by functional chewing gums.
The market's evolution is characterized by a focus on improving texture modification, fluoride incorporation, and flavor delivery systems. Polyol blends and emulsifier selection are essential in achieving the desired texture and mouthfeel. Shelf life stability is another critical factor that manufacturers must consider to ensure product quality and consumer satisfaction.
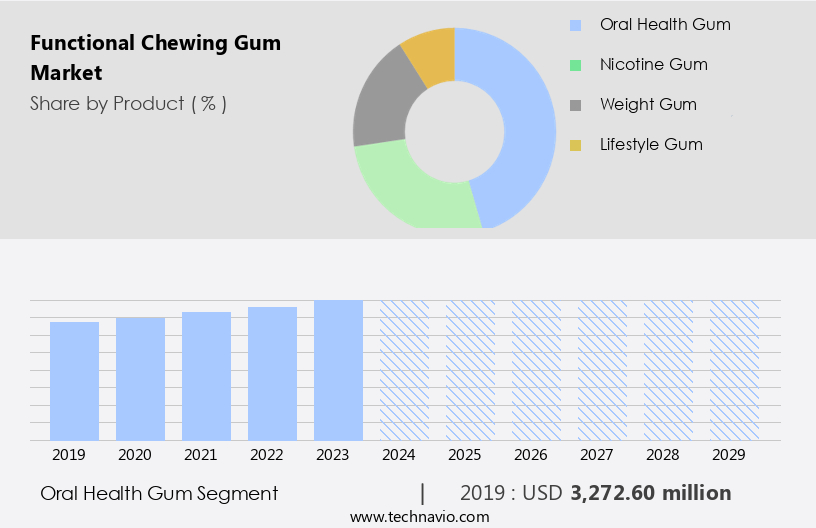
As of 2019 the Oral health gum segment estimated at USD 3.27 billion, and it is forecast to see a moderate upward trend through the forecast period.
Regional Analysis
During the forecast period, APAC is projected to contribute 55% to the overall growth of the global market. Technavio's analysts have elaborately explained the regional trends and drivers that shape the market during the forecast period.
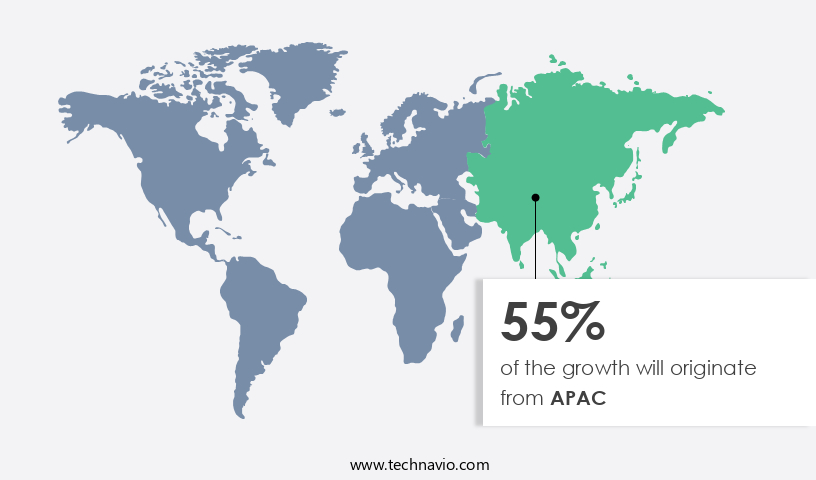
Functional chewing gum, a type of gum offering additional health benefits beyond simple freshening, experiences significant demand in Asia Pacific markets, including China, Japan, and India. Consumers in these regions value the memory enhancement, stress reduction, focus improvement, weight management, and oral health advantages that functional chewing gum provides. In China and Japan, strong consumer awareness and acceptance of these benefits drive high sales volumes. In contrast, India's the market is still emerging. Rheological properties, such as chewability and texture, play a crucial role in the market's success. Natural gums, xylitol content, and sensory attributes are essential factors in formulating functional chewing gum.
Release kinetics and ingredient interactions are also vital for optimizing the gum's health benefits. Starch-based thickeners ensure shelf life stability, while polyol blends and emulsifier selection contribute to gum film formation. Low-calorie sweeteners and sweetener systems cater to consumers seeking sugar-free options. Sensory perception is essential for delivering the desired taste and mouthfeel. Flavor delivery systems and oral hydration are other essential aspects of functional chewing gum. Calcium supplementation and cavities prevention are additional health benefits that appeal to consumers. Functional chewing gum manufacturers must consider various factors, including texture modification, fluoride incorporation, and coating technology, to create high-quality products. Natural flavoring agents are essential for enhancing the gum's taste and appeal. Mastication properties and gum base formulation are also critical elements in the production process.
Market Dynamics
Our researchers analyzed the data with 2024 as the base year, along with the key drivers, trends, and challenges. A holistic analysis of drivers will help companies refine their marketing strategies to gain a competitive advantage.
The chewing gum market is evolving with increasing focus on chewing gum sweetener interaction effects and the impact of gum base on flavor release. Researchers are studying the relationship between texture and chewing experience and the impact of emulsifiers on stability to enhance product performance. Innovations include the effect of coating materials on sensory attributes and evaluation of chewing gum shelf-life. Critical to formulation is the analysis of ingredient interactions on physical properties and assessing the oral disintegration of gum. Functional gums require measuring the mastication properties of chewing gum and sensory evaluation of functional chewing gum, alongside determination of gum base composition. Advances support the optimization of the chewing gum manufacturing process and controlled release of functional ingredients in chewing gum, while improving the shelf life of functional chewing gum and investigating the bioavailability of chewing gum ingredients. Other considerations include the impact of polyol blends on gum texture, effect of gum base on salivary stimulation, evaluation of chewing gum sensory properties, assessment of chewing gum digestive health benefits, and investigation of chewing gum oral health effects.
What are the key market drivers leading to the rise in the adoption of Functional Chewing Gum Industry?
- The significant surge in demand for nicotine gum as an effective tool in smoking cessation therapy is the primary market driver. Nicotine replacement therapy, a proven method for smoking cessation, has gained significant traction in the market due to its effectiveness in helping individuals manage nicotine addiction. One component of this therapy is the use of nicotine gum, which provides a substitute for cigarettes and allows smokers to gradually reduce their nicotine intake. This therapy not only aids in the cessation process but also mitigates the potential weight gain often associated with quitting smoking. According to a study, smokers using nicotine gum experienced a 28% reduction in weight gain compared to those not using it during the first year of smoking cessation.
- Furthermore, the nicotine gum market is projected to grow at a robust rate, with industry analysts estimating a 5% annual expansion in the coming years. The convenience and effectiveness of nicotine gum make it an attractive option for those seeking to quit smoking and maintain a healthier lifestyle.
What are the market trends shaping the Functional Chewing Gum Industry?
- Functional chewing gums are gaining significant online presence, reflecting the current market trend. This digital growth is a mandatory development for companies in the industry to remain competitive.
- In the expanding e-commerce landscape, the preference for online shopping continues to surge, with the market participants experiencing significant growth as a result. According to recent studies, online sales are expected to account for over 14% of global retail sales by 2024. In mature markets, e-commerce penetration is already robust, driving substantial sales for functional chewing gum manufacturers. Conversely, emerging markets exhibit lower e-commerce penetration, presenting a lucrative opportunity for market expansion.
- The market's growth is fueled by the convenience and accessibility offered by online retail channels, which cater to the increasing demand for functional chewing gums. Despite the prominence of brick-and-mortar stores, online sales are projected to witness a rapid increase during the forecast period.
What challenges does the Functional Chewing Gum Industry face during its growth?
- The inadequacy of effective disposal methods for chewing gum represents a significant challenge to the industry's growth trajectory. The market faces a notable challenge with the inefficient and unsustainable disposal of used gum, particularly in public spaces. Traditional chewing gum, composed of non-biodegradable synthetic polymers, contributes significantly to this issue. The prevalence of functional chewing gums, which offer additional health benefits, further intensifies this concern due to increased usage. Governments worldwide are responding to this challenge by implementing initiatives to mitigate gum litter.
- For example, Amsterdam, in the Netherlands, launched the "Gumshoe" campaign, which includes the installation of sidewalks made from Gum-Tec, a rubber-like material containing recycled chewing gum. The market is expected to experience robust growth, with industry analysts projecting a 6% annual expansion over the next several years.
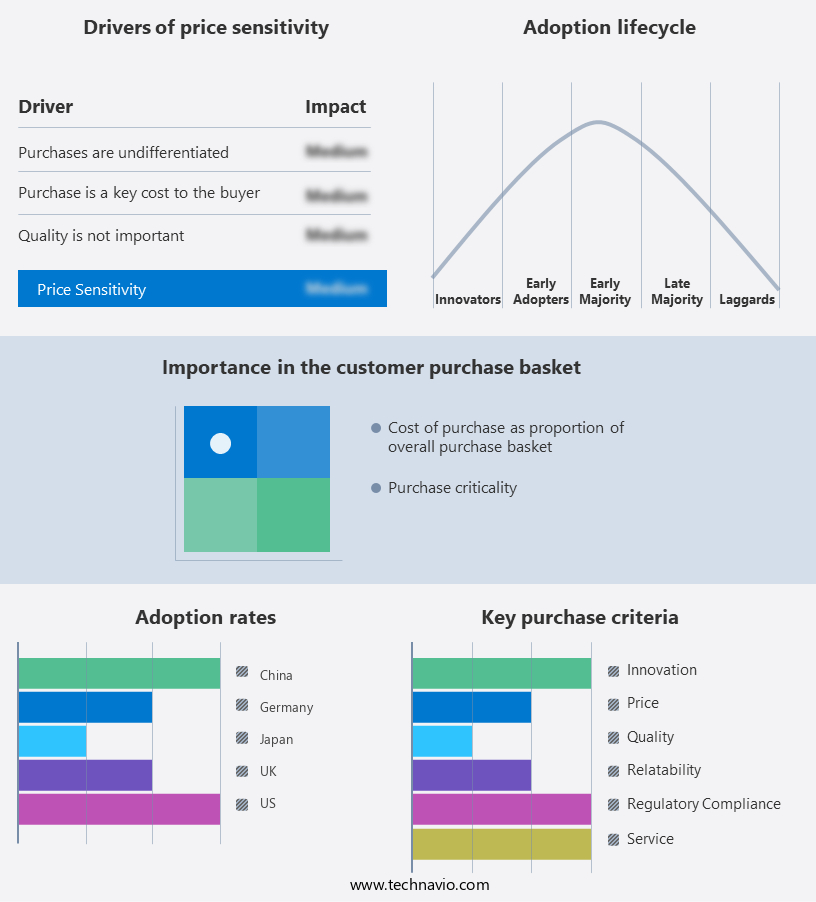
Exclusive Customer Landscape
The functional chewing gum market forecasting report includes the adoption lifecycle of the market, covering from the innovator's stage to the laggard's stage. It focuses on adoption rates in different regions based on penetration. Furthermore, the functional chewing gum market report also includes key purchase criteria and drivers of price sensitivity to help companies evaluate and develop their market growth analysis strategies.
Customer Landscape
Key Companies & Market Insights
Companies are implementing various strategies, such as strategic alliances, functional chewing gum market forecast, partnerships, mergers and acquisitions, geographical expansion, and product/service launches, to enhance their presence in the industry.
AB Natural Base SA CV - This company specializes in producing functional chewing gums, including the PW-060 variant with a Chicle gum base. The gum base provides unique benefits, enhancing consumer experience beyond traditional confectionery items. The company's commitment to innovation sets it apart in the market, offering consumers functional alternatives to common gum products.
The industry research and growth report includes detailed analyses of the competitive landscape of the market and information about key companies, including:
- AB Natural Base SA CV
- Blockhead HQ Ltd
- Cipla Inc.
- Cloetta AB
- Federation of Migros Cooperatives
- Ford Gum Inc.
- Gumlink Confectionery Company AS
- Hager and Werken GmbH and Co. KG
- Johnson and Johnson Services Inc.
- Lotte India Corporation
- Mars Inc.
- MD E GUM SRL
- Med CBDX
- Mondelez International Inc.
- Per Os Biosciences LLC
- Perfetti Van Melle Group BV
- Simply Gum Inc.
- The Hershey Co.
- Think Gum LLC
- WUG Functional Gums SL
Qualitative and quantitative analysis of companies has been conducted to help clients understand the wider business environment as well as the strengths and weaknesses of key industry players. Data is qualitatively analyzed to categorize companies as pure play, category-focused, industry-focused, and diversified; it is quantitatively analyzed to categorize companies as dominant, leading, strong, tentative, and weak.
Recent Development and News in Functional Chewing Gum Market
- In January 2024, Wrigley, a leading confectionery company, introduced a new line of functional chewing gums under the Extra brand. The new product range, named Extra Dual Action, combines traditional chewing gum benefits with added vitamins and minerals, according to Wrigley's press release.
- In March 2024, Mondelez International, the parent company of Cadbury, announced a strategic partnership with a leading biotech firm to develop functional chewing gums with probiotics. The collaboration aims to expand Mondelez's product portfolio and cater to the growing demand for health-conscious snacks, as stated in Mondelez's Q1 2024 earnings call.
- In May 2025, Perfetti Van Melle, a global confectionery company, acquired a significant stake in a start-up specializing in functional chewing gums infused with CBD. The investment, as reported in Reuters, will help Perfetti Van Melle enter the emerging CBD market and expand its product offerings.
- In the same month, the European Food Safety Authority (EFSA) approved the health claims for several functional ingredients used in chewing gums, as stated in the EFSA journal. The approved ingredients include vitamins, minerals, and amino acids, which can now be marketed as providing specific health benefits, boosting the growth potential for the market.
Research Analyst Overview
- The market continues to evolve, driven by consumer preferences for innovative and health-conscious products. Flavor intensity and aftertaste profile are key considerations, with manufacturers employing taste masking and flavor encapsulation techniques to enhance consumer experience. Mouth coating and moisture content play crucial roles in oral comfort, while gum viscosity and stickiness impact chew duration. Functional ingredients, such as xylitol for plaque reduction and salivary stimulation, are increasingly incorporated into gum formulations. Packaging materials and additive compatibility are essential for maintaining gum freshness and ensuring ingredient dispersion. Gum elasticity and coating uniformity are critical for optimal sensory testing and consumer satisfaction.
- The functional chewing gum market is growing due to innovations in gum softening agents, mouthfeel enhancement, and advanced oral delivery system designs. Manufacturers prioritize ingredient stability, ethical ingredient sourcing, and strict quality assurance protocols. Continuous process optimization supported by modern analytical techniques ensures consistency in mechanical properties and flavor stability. Emphasis is placed on ingredient functionality, product safety, and full regulatory compliance. The integration of material science and food technology plays a key role in developing gums with efficient film formation, repeated across various applications. Features like controlled release, taste masking, and optimized sensory perception enhance user experience. Through research in film formation, sensory perception, and film formation, brands aim to deliver scientifically backed, consumer-friendly functional gum products.
- Industry growth is expected to reach 5% annually, with ongoing formulation optimization and the incorporation of slow release agents contributing to this expansion. For instance, a leading manufacturer reported a 3% increase in sales due to the introduction of a new gum variant with improved mouth dryness reduction. The continuous exploration of color stability, ingredient solubility, gum strength, and chew duration will further shape the dynamic landscape of the market.
Dive into Technavio's robust research methodology, blending expert interviews, extensive data synthesis, and validated models for unparalleled Functional Chewing Gum Market insights. See full methodology.
Functional Chewing Gum Market Market Scope |
|
|
Report Coverage |
Details |
|
Page number |
230 |
|
Base year |
2024 |
|
Historic period |
2019-2023 |
|
Forecast period |
2025-2029 |
|
Growth momentum & CAGR |
Accelerate at a CAGR of 5.7% |
|
Market growth 2025-2029 |
USD 3444.8 million |
|
Market structure |
Fragmented |
|
YoY growth 2024-2025(%) |
5.3 |
|
Key countries |
China, US, Japan, Germany, India, UK, South Korea, Canada, Australia, and France |
|
Competitive landscape |
Leading Companies, Market Positioning of Companies, Competitive Strategies, and Industry Risks |
What are the Key Data Covered in this Functional Chewing Gum Market Research and Growth Report?
- CAGR of the Functional Chewing Gum industry during the forecast period
- Detailed information on factors that will drive the growth and forecasting between 2025 and 2029
- Precise estimation of the size of the market and its contribution of the industry in focus to the parent market
- Accurate predictions about upcoming growth and trends and changes in consumer behaviour
- Growth of the market across APAC, Europe, North America, Middle East and Africa, and South America
- Thorough analysis of the market's competitive landscape and detailed information about companies
- Comprehensive analysis of factors that will challenge the functional chewing gum market growth of industry companies
We can help! Our analysts can customize this functional chewing gum market research report to meet your requirements.
 RIA -
RIA - 
