Galley Equipment Market Analysis North America, APAC, Europe, Middle East and Africa, South America - US, China, Germany, Japan, France - Size and Forecast 2024-2028

Galley Equipment Market Analysis North America, APAC, Europe, Middle East and Africa, South America - US, China, Germany, Japan, France - Size and Forecast 2024-2028

Published: May 2024 168 Pages SKU: IRTNTR44720

Market Overview at a Glance

$3.18 B
Market Opportunity
5.59%
CAGR
5.22
YoY growth 2023-2024(%)

Galley Equipment Market Size 2024-2028

The galley equipment market size is forecast to increase by USD 3.18 billion, at a CAGR of 5.59% between 2023 and 2028.

  • The market is experiencing significant growth, driven by the increasing demand for lightweight equipment that reduces fuel consumption and enhances operational efficiency in the aviation industry. This trend is particularly prominent in the growing Low-Cost Carrier (LCC) segment, which prioritizes cost savings and streamlined operations. Another key trend is the rising demand for customized galley systems that cater to diverse passenger preferences and dietary requirements. However, the market faces challenges, including the complex regulatory landscape and the need for galley equipment that can withstand harsh operating conditions in the aviation industry.
  • Companies seeking to capitalize on market opportunities must focus on developing innovative, lightweight, and customizable solutions while navigating the intricacies of regulatory compliance. Effective operational planning and strategic partnerships will be essential for success in this dynamic and evolving market.

What will be the Size of the Galley Equipment Market during the forecast period?

Galley Equipment Market Size

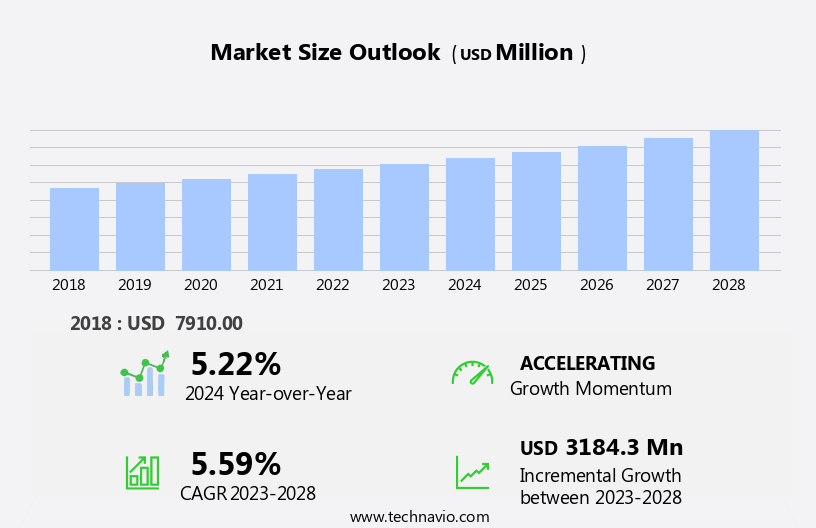
Explore in-depth regional segment analysis with market size data - historical 2018-2022 and forecasts 2024-2028 - in the full report.  
Request Free Sample

The market continues to evolve, driven by advancements in technology and the expanding needs of various sectors. Image editing software and page layout design tools have become essential for creating visually appealing galleys, while print-on-demand workflows and typesetting software enable efficient production. The print production process is further optimized through font selection processes, prepress quality control, and preflight checking software. Typography optimization, digital asset management, and interactive galley review systems streamline the editorial process, allowing for more effective collaboration and version control. File format conversion and cloud-based galley systems facilitate seamless communication between teams and stakeholders.

Automated proofing tools and publishing workflow optimization further enhance the efficiency of the proofing workflow. According to industry reports, the global market for galley equipment is projected to grow by over 5% annually. For instance, a leading publishing house reported a 10% increase in sales due to the implementation of a digital galley creation and collaborative editing platform. This growth is fueled by the adoption of color management systems, secure galley distribution, and high-resolution imaging technologies. Moreover, the integration of editorial markup systems, layout optimization techniques, and publishing workflow optimization tools has led to improved productivity and cost savings.

The ongoing development of advanced technologies, such as automated proofing tools and version control systems, continues to shape the market landscape.

How is this Galley Equipment Industry segmented?

The galley equipment industry research report provides comprehensive data (region-wise segment analysis), with forecasts and estimates in "USD million" for the period 2024-2028, as well as historical data from 2018-2022 for the following segments.

  • Application
    • Marine
    • Aviation
  • Type
    • Single-aisle
    • Twin-aisle
    • Business general aviation
  • Fit
    • Line Fit
    • Retro Fit
    • Line Fit
    • Retro Fit
  • Geography
    • North America
      • US
    • Europe
      • France
      • Germany
    • APAC
      • China
      • Japan
    • Rest of World (ROW)

By Application Insights

The marine segment is estimated to witness significant growth during the forecast period.

In the marine industry, galley equipment companies prioritize luxurious designs and convenience for passengers and crew members. These companies cater to commercial ships, cruisers, and yachts, supplying galley systems that ensure high-quality food and improved hygiene onboard. To minimize the impact on a vessel's sailing capabilities, manufacturers are focusing on reducing the weight of galley systems. For example, GN Espace manufactures professional galleys using stainless steel for marine applications. Innovative technologies are also being introduced to enhance the functionality of marine galley equipment. The digital asset management systems enable efficient prepress quality control, typography optimization, and interactive galley reviews.

Cloud-based galley systems offer secure distribution and online sharing, while automated proofing tools and collaborative editing platforms streamline the publishing workflow. The market for galley equipment is expected to grow significantly, with digital galley creation and version control systems becoming increasingly popular. This growth can be attributed to the integration of advanced technologies and the demand for more efficient and effective galley production processes.

Galley Equipment Market Size

Request Free Sample

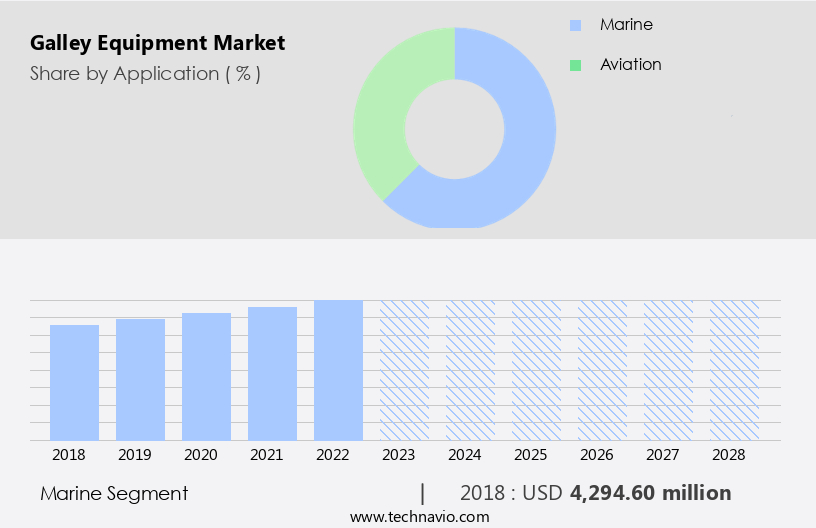
The Marine segment was valued at USD 4.29 billion in 2018 and showed a gradual increase during the forecast period.

Regional Analysis

North America is estimated to contribute 35% to the growth of the global market during the forecast period. Technavio's analysts have elaborately explained the regional trends and drivers that shape the market during the forecast period.

Galley Equipment Market Share by Geography

 Request Free Sample

The commercial aviation sector's ongoing expansion, driven by a surge in global demand for new aircraft and ships, is fueling significant investments in galley equipment. Leading North American aircraft manufacturers, such as Boeing and Bombardier, are receiving a high volume of orders from airlines worldwide, necessitating the need for advanced galley equipment. Galley equipment manufacturers are responding by increasing production capacity to meet the monthly demands of aircraft original equipment manufacturers (OEMs). Moreover, the commercial airline industry in North America is focusing on refurbishing its aging fleet, which will further boost the demand for galley equipment in the coming years.

In this dynamic market, galley equipment manufacturers are employing innovative solutions to streamline processes and enhance efficiency. For instance, they are integrating cloud-based galley systems, enabling real-time collaboration and remote proofing systems. Digital asset management systems facilitate the organization and sharing of high-resolution images, while preflight checking software ensures error-free file format conversion. Typography optimization and color management systems ensure consistent branding and high-quality output. The industry is expected to grow at a steady pace, with digital galley creation and archiving solutions gaining popularity due to their cost-effectiveness and flexibility. Collaborative editing platforms enable seamless collaboration between teams, further increasing productivity.

In conclusion, the market is witnessing a harmonious blend of traditional and digital technologies, as manufacturers strive to meet the evolving needs of the commercial aviation sector. With the global demand for new commercial aircraft and ships projected to reach 40,000 units by 2038, the market is poised for significant growth.

Market Dynamics

Our researchers analyzed the data with 2023 as the base year, along with the key drivers, trends, and challenges. A holistic analysis of drivers will help companies refine their marketing strategies to gain a competitive advantage.

The market is experiencing significant growth as publishers seek to improve galley proofreading efficiency and optimize digital galley creation workflows. Galley systems have become essential tools for managing publication timelines, automating quality checks in galley production, and reducing errors in the proofreading process. Cloud-based galley archiving solutions enable easy access to previous versions, ensuring color accuracy and maintaining content consistency during galley creation. Publishers are also investing in remote proofing systems for galleys, streamlining the correction process and enhancing collaborative editing platforms. Prepress quality control for print galleys is another key area of focus, with automated proofing tools used for faster galley review and secure distribution channels ensuring the confidentiality of publishing content. Selecting appropriate fonts and typography for galleys, optimizing layout designs for better readability, and implementing version control systems for galley management are all critical components of an effective galley production process. Moreover, publishers are increasingly prioritizing image resolution and file format conversion in digital galley creation to ensure high-quality output. Adhering to editorial style guidelines and applying consistent formatting are also crucial aspects of galley production. Overall, the market is evolving to meet the demands of modern publishing, offering innovative solutions for optimizing workflows, improving quality, and enhancing collaboration.

What are the key market drivers leading to the rise in the adoption of Galley Equipment Industry?

  • The increasing demand for lightweight galley equipment is the primary factor fueling market growth. This trend is driven by the need for efficient and sustainable solutions in the catering industry, as well as the growing preference for reduced fuel consumption and improved onboard space utilization. 
  • The global market for galley equipment in the commercial aviation and shipping industries is experiencing significant growth, driven by the increasing demand for lightweight and customized solutions. Manufacturers are focusing on reducing the weight of onboard equipment to improve fuel efficiency and reduce operational costs. Galley equipment companies are responding by customizing designs, materials, and technologies to meet the unique needs of their clients. For instance, Bucher Group, a leading galley equipment provider, offers lightweight aluminum galley frame structures that significantly reduce the overall weight of the galley. The company's anodized aluminum frame with powder-coated panels provides greater stability and a longer lifespan, protecting the structure from corrosion for at least 15 years.
  • This innovation has resulted in a sales increase of over 20% for Bucher Group in the past year. The market is expected to grow by over 5% annually in the coming years, according to industry analysts.

What are the market trends shaping the Galley Equipment Industry?

  • The increasing demand for customized galley systems represents a notable market trend. Galley systems, tailored to specific vessel requirements, are experiencing heightened demand in the maritime industry.
  • The market has witnessed a burgeoning demand due to the customization needs of clients in the commercial aviation and marine sectors. With no standard designs for galley systems, companies have been focusing on providing tailored services to cater to clients' unique requirements. The market's growth can be attributed to the increasing preference for compact and lightweight designs to reduce the overall load on aircraft and ships. For instance, airlines offering extensive meal services or self-service beverages and snacks require additional counter space.
  • Furthermore, cultural preferences also impact the customization of galley equipment, with European clients favoring espresso makers over coffee makers. The market is expected to continue its robust growth in the coming years, with an estimated 18% of the market share being captured by new entrants. The demand for galley equipment is driven by the increasing number of commercial flights and the expansion of the marine industry.

What challenges does the Galley Equipment Industry face during its growth?

  • The expansion of low-cost carrier (LCC) airlines poses a significant challenge to the overall growth of the aviation industry. 
  • The market faces challenges due to the increasing preference for low-cost carrier (LCC) aircraft worldwide. This trend, spearheaded by the success of LCCs in Asia-Pacific (APAC), particularly in Southeast Asia, has led to a surge in passenger traffic. Key players like Lion Air, Air Asia, and Wings Air have capitalized on this trend by adopting simplified fleet structures, faster turnaround times, and a focus on revenue generation.
  • Consequently, they have expanded their reach to newer routes, potentially impacting the growth prospects of the market. According to industry reports, the global airline catering market is projected to grow by over 5% annually, driven by the increasing demand for in-flight catering services from both traditional and low-cost carriers.

Exclusive Customer Landscape

The galley equipment market forecasting report includes the adoption lifecycle of the market, covering from the innovator's stage to the laggard's stage. It focuses on adoption rates in different regions based on penetration. Furthermore, the galley equipment market report also includes key purchase criteria and drivers of price sensitivity to help companies evaluate and develop their market growth analysis strategies.
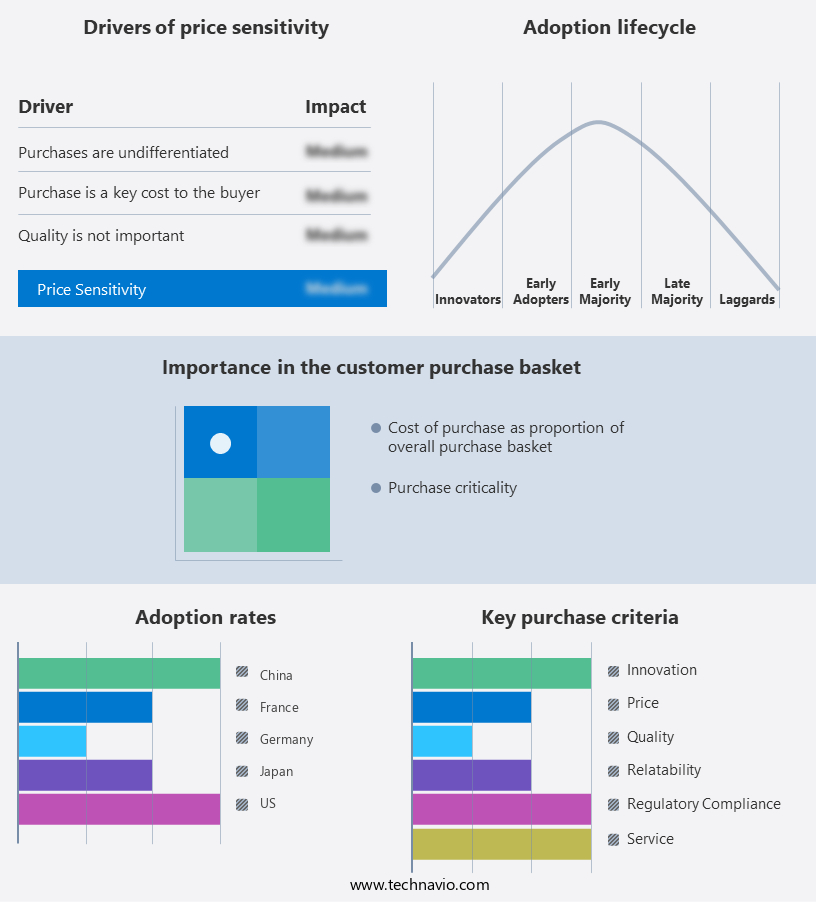
Galley Equipment Market Share by Geography

 Customer Landscape

Key Companies & Market Insights

Companies are implementing various strategies, such as strategic alliances, galley equipment market forecast, partnerships, mergers and acquisitions, geographical expansion, and product/service launches, to enhance their presence in the industry.

Aerolux Ltd. - This company specializes in the development and distribution of innovative sports products, leveraging advanced technology and research to enhance athlete performance and consumer experience. 

The industry research and growth report includes detailed analyses of the competitive landscape of the market and information about key companies, including:

  • Aerolux Ltd.
  • Air Cabin Engineering Inc.
  • Aluminox S.A.
  • Astronics Corp.
  • AVIC Cabin Systems Ltd.
  • Bucher Leichtbau AG
  • Diehl Stiftung and Co. KG
  • Direct Aviation Group
  • ETI Tech LLC
  • Euro Composites SA
  • Geven Spa
  • GN Espace Galley Solutions Ltd.
  • Goltens Worldwide Management Corp.
  • JAMCO Corp.
  • Kang Li Far East Pte Ltd.
  • Loipart AB
  • Miele and Cie. KG
  • RTX Corp.
  • Safran SA
  • The Boeing Co.

Qualitative and quantitative analysis of companies has been conducted to help clients understand the wider business environment as well as the strengths and weaknesses of key industry players. Data is qualitatively analyzed to categorize companies as pure play, category-focused, industry-focused, and diversified; it is quantitatively analyzed to categorize companies as dominant, leading, strong, tentative, and weak.

Recent Development and News in Galley Equipment Market

  • In January 2024, Fusion Galley Solutions, a leading galley equipment manufacturer, announced the launch of its innovative, energy-efficient induction cooktop system at the Seafood Expo North America. This new product, named "EcoChef," is designed to reduce fuel consumption by up to 50% compared to traditional galley equipment (Fusion Galley Solutions press release).
  • In March 2024, Maritime Partners, a global maritime investment firm, announced a strategic partnership with GalleyMaster, a leading galley management software provider. This collaboration aims to integrate GalleyMaster's software into Fusion Galley Solutions' equipment, offering fleet operators advanced monitoring, reporting, and optimization capabilities (Maritime Partners press release).
  • In May 2025, Caterpillar Marine Power, a major marine engine manufacturer, acquired GalleyTech, a leading provider of wastewater treatment and galley equipment. The acquisition is expected to strengthen Caterpillar's position in the marine market and expand its product offerings (Caterpillar Marine Power press release).
  • In the same month, the International Maritime Organization (IMO) approved new regulations on food safety and galley equipment standards for commercial vessels. The new rules, which take effect in January 2026, mandate regular inspections and maintenance of galley equipment to ensure food safety and reduce the risk of onboard outbreaks of foodborne illnesses (IMO press release).

Research Analyst Overview

  • The market for galley equipment continues to evolve, driven by the need for efficient production workflow automation and cost optimization in various sectors. Quality assurance processes are increasingly reliant on advanced layout design principles, error detection rates, and image resolution standards to maintain content consistency checks and ensure metadata management. Team collaboration tools facilitate seamless editorial workflow and digital publishing workflow, enabling real-time editor galley review and adherence to print quality metrics. File transfer protocols and publication timeline management are crucial for securely transferring and managing files, while text compression techniques and data integrity management ensure the secure handling of large volumes of data.
  • The industry anticipates a growth of over 10% in the next year, fueled by the ongoing adoption of proofing software, security protocols, and galley revision management solutions. For instance, a leading publishing house reported a 15% increase in sales following the implementation of a comprehensive galley review system.

Dive into Technavio's robust research methodology, blending expert interviews, extensive data synthesis, and validated models for unparalleled Galley Equipment Market insights. See full methodology.

Market Scope

Report Coverage

Details

Page number

168

Base year

2023

Historic period

2018-2022

Forecast period

2024-2028

Growth momentum & CAGR

Accelerate at a CAGR of 5.59%

Market growth 2024-2028

USD 3184.3 million

Market structure

Fragmented

YoY growth 2023-2024(%)

5.22

Key countries

US, China, Germany, Japan, and France

Competitive landscape

Leading Companies, Market Positioning of Companies, Competitive Strategies, and Industry Risks

Request Free Sample

What are the Key Data Covered in this Galley Equipment Market Research and Growth Report?

  • CAGR of the Galley Equipment industry during the forecast period
  • Detailed information on factors that will drive the growth and forecasting between 2024 and 2028
  • Precise estimation of the size of the market and its contribution of the industry in focus to the parent market
  • Accurate predictions about upcoming growth and trends and changes in consumer behaviour
  • Growth of the market across North America, APAC, Europe, Middle East and Africa, and South America
  • Thorough analysis of the market's competitive landscape and detailed information about companies
  • Comprehensive analysis of factors that will challenge the galley equipment market growth of industry companies

We can help! Our analysts can customize this galley equipment market research report to meet your requirements.

Get in touch

1 Executive Summary

  • 1.1 Market overview
    • Executive Summary - Chart on Market Overview
    • Executive Summary - Data Table on Market Overview
    • Executive Summary - Chart on Global Market Characteristics
    • Executive Summary - Chart on Market by Geography
    • Executive Summary - Chart on Market Segmentation by Application
    • Executive Summary - Chart on Market Segmentation by Type
    • Executive Summary - Chart on Incremental Growth
    • Executive Summary - Data Table on Incremental Growth
    • Executive Summary - Chart on Company Market Positioning

2 Market Landscape

  • 2.1 Market ecosystem
    • Parent Market
    • Data Table on - Parent Market
  • 2.2 Market characteristics
    • Market characteristics analysis
  • 2.3 Value chain analysis
    • Value Chain Analysis

3 Market Sizing

  • 3.1 Market definition
    • Offerings of companies included in the market definition
  • 3.2 Market segment analysis
    • Market segments
  • 3.3 Market size 2023
    • 3.4 Market outlook: Forecast for 2023-2028
      • Chart on Global - Market size and forecast 2023-2028 ($ million)
      • Data Table on Global - Market size and forecast 2023-2028 ($ million)
      • Chart on Global Market: Year-over-year growth 2023-2028 (%)
      • Data Table on Global Market: Year-over-year growth 2023-2028 (%)

    4 Historic Market Size

    • 4.1 Global Galley Equipment Market 2018 - 2022
      • Historic Market Size - Data Table on Global Galley Equipment Market 2018 - 2022 ($ million)
    • 4.2 Application segment analysis 2018 - 2022
      • Historic Market Size - Application Segment 2018 - 2022 ($ million)
    • 4.3 Type segment analysis 2018 - 2022
      • Historic Market Size - Type Segment 2018 - 2022 ($ million)
    • 4.4 Geography segment analysis 2018 - 2022
      • Historic Market Size - Geography Segment 2018 - 2022 ($ million)
    • 4.5 Country segment analysis 2018 - 2022
      • Historic Market Size - Country Segment 2018 - 2022 ($ million)

    5 Five Forces Analysis

    • 5.1 Five forces summary
      • Five forces analysis - Comparison between 2023 and 2028
    • 5.2 Bargaining power of buyers
      • Bargaining power of buyers - Impact of key factors 2023 and 2028
    • 5.3 Bargaining power of suppliers
      • Bargaining power of suppliers - Impact of key factors in 2023 and 2028
    • 5.4 Threat of new entrants
      • Threat of new entrants - Impact of key factors in 2023 and 2028
    • 5.5 Threat of substitutes
      • Threat of substitutes - Impact of key factors in 2023 and 2028
    • 5.6 Threat of rivalry
      • Threat of rivalry - Impact of key factors in 2023 and 2028
    • 5.7 Market condition
      • Chart on Market condition - Five forces 2023 and 2028

    6 Market Segmentation by Application

    • 6.1 Market segments
      • Chart on Application - Market share 2023-2028 (%)
      • Data Table on Application - Market share 2023-2028 (%)
    • 6.2 Comparison by Application
      • Chart on Comparison by Application
      • Data Table on Comparison by Application
    • 6.3 Marine - Market size and forecast 2023-2028
      • Chart on Marine - Market size and forecast 2023-2028 ($ million)
      • Data Table on Marine - Market size and forecast 2023-2028 ($ million)
      • Chart on Marine - Year-over-year growth 2023-2028 (%)
      • Data Table on Marine - Year-over-year growth 2023-2028 (%)
    • 6.4 Aviation - Market size and forecast 2023-2028
      • Chart on Aviation - Market size and forecast 2023-2028 ($ million)
      • Data Table on Aviation - Market size and forecast 2023-2028 ($ million)
      • Chart on Aviation - Year-over-year growth 2023-2028 (%)
      • Data Table on Aviation - Year-over-year growth 2023-2028 (%)
    • 6.5 Market opportunity by Application
      • Market opportunity by Application ($ million)
      • Data Table on Market opportunity by Application ($ million)

    7 Market Segmentation by Type

    • 7.1 Market segments
      • Chart on Type - Market share 2023-2028 (%)
      • Data Table on Type - Market share 2023-2028 (%)
    • 7.2 Comparison by Type
      • Chart on Comparison by Type
      • Data Table on Comparison by Type
    • 7.3 Single-aisle - Market size and forecast 2023-2028
      • Chart on Single-aisle - Market size and forecast 2023-2028 ($ million)
      • Data Table on Single-aisle - Market size and forecast 2023-2028 ($ million)
      • Chart on Single-aisle - Year-over-year growth 2023-2028 (%)
      • Data Table on Single-aisle - Year-over-year growth 2023-2028 (%)
    • 7.4 Twin-aisle - Market size and forecast 2023-2028
      • Chart on Twin-aisle - Market size and forecast 2023-2028 ($ million)
      • Data Table on Twin-aisle - Market size and forecast 2023-2028 ($ million)
      • Chart on Twin-aisle - Year-over-year growth 2023-2028 (%)
      • Data Table on Twin-aisle - Year-over-year growth 2023-2028 (%)
    • 7.5 Business general aviation - Market size and forecast 2023-2028
      • Chart on Business general aviation - Market size and forecast 2023-2028 ($ million)
      • Data Table on Business general aviation - Market size and forecast 2023-2028 ($ million)
      • Chart on Business general aviation - Year-over-year growth 2023-2028 (%)
      • Data Table on Business general aviation - Year-over-year growth 2023-2028 (%)
    • 7.6 Market opportunity by Type
      • Market opportunity by Type ($ million)
      • Data Table on Market opportunity by Type ($ million)

    8 Market Segmentation by Fit

    • 8.1 Market segments
      • Chart on Fit - Market share (2023-2028) (%)
      • Data Table on Fit - Market share (2023-2028) (%)
    • 8.2 Comparison by Fit
      • Chart on Comparison by Fit
      • Data Table on Comparison by Fit
    • 8.3 Line Fit - Market size and forecast (2023-2028)
      • Chart on Line Fit - Market size and forecast (2023-2028) ($ million)
      • Data Table on Line Fit - Market size and forecast (2023-2028) ($ million)
      • Chart on Line Fit - Year-over-year growth (2023-2028) (%)
      • Data Table on Line Fit - Year-over-year growth (2023-2028) (%)
    • 8.4 Retro Fit - Market size and forecast (2023-2028)
      • Chart on Retro Fit - Market size and forecast (2023-2028) ($ million)
      • Data Table on Retro Fit - Market size and forecast (2023-2028) ($ million)
      • Chart on Retro Fit - Year-over-year growth (2023-2028) (%)
      • Data Table on Retro Fit - Year-over-year growth (2023-2028) (%)
    • 8.5 Market opportunity by Fit
      • Market opportunity by $segment_name ($ million)
      • Data Table on Market opportunity by $segment_name ($ million)

    9 Customer Landscape

    • 9.1 Customer landscape overview
      • Analysis of price sensitivity, lifecycle, customer purchase basket, adoption rates, and purchase criteria

    10 Geographic Landscape

    • 10.1 Geographic segmentation
      • Chart on Market share by geography 2023-2028 (%)
      • Data Table on Market share by geography 2023-2028 (%)
    • 10.2 Geographic comparison
      • Chart on Geographic comparison
      • Data Table on Geographic comparison
    • 10.3 North America - Market size and forecast 2023-2028
      • Chart on North America - Market size and forecast 2023-2028 ($ million)
      • Data Table on North America - Market size and forecast 2023-2028 ($ million)
      • Chart on North America - Year-over-year growth 2023-2028 (%)
      • Data Table on North America - Year-over-year growth 2023-2028 (%)
    • 10.4 APAC - Market size and forecast 2023-2028
      • Chart on APAC - Market size and forecast 2023-2028 ($ million)
      • Data Table on APAC - Market size and forecast 2023-2028 ($ million)
      • Chart on APAC - Year-over-year growth 2023-2028 (%)
      • Data Table on APAC - Year-over-year growth 2023-2028 (%)
    • 10.5 Europe - Market size and forecast 2023-2028
      • Chart on Europe - Market size and forecast 2023-2028 ($ million)
      • Data Table on Europe - Market size and forecast 2023-2028 ($ million)
      • Chart on Europe - Year-over-year growth 2023-2028 (%)
      • Data Table on Europe - Year-over-year growth 2023-2028 (%)
    • 10.6 Middle East and Africa - Market size and forecast 2023-2028
      • Chart on Middle East and Africa - Market size and forecast 2023-2028 ($ million)
      • Data Table on Middle East and Africa - Market size and forecast 2023-2028 ($ million)
      • Chart on Middle East and Africa - Year-over-year growth 2023-2028 (%)
      • Data Table on Middle East and Africa - Year-over-year growth 2023-2028 (%)
    • 10.7 South America - Market size and forecast 2023-2028
      • Chart on South America - Market size and forecast 2023-2028 ($ million)
      • Data Table on South America - Market size and forecast 2023-2028 ($ million)
      • Chart on South America - Year-over-year growth 2023-2028 (%)
      • Data Table on South America - Year-over-year growth 2023-2028 (%)
    • 10.8 US - Market size and forecast 2023-2028
      • Chart on US - Market size and forecast 2023-2028 ($ million)
      • Data Table on US - Market size and forecast 2023-2028 ($ million)
      • Chart on US - Year-over-year growth 2023-2028 (%)
      • Data Table on US - Year-over-year growth 2023-2028 (%)
    • 10.9 China - Market size and forecast 2023-2028
      • Chart on China - Market size and forecast 2023-2028 ($ million)
      • Data Table on China - Market size and forecast 2023-2028 ($ million)
      • Chart on China - Year-over-year growth 2023-2028 (%)
      • Data Table on China - Year-over-year growth 2023-2028 (%)
    • 10.10 Germany - Market size and forecast 2023-2028
      • Chart on Germany - Market size and forecast 2023-2028 ($ million)
      • Data Table on Germany - Market size and forecast 2023-2028 ($ million)
      • Chart on Germany - Year-over-year growth 2023-2028 (%)
      • Data Table on Germany - Year-over-year growth 2023-2028 (%)
    • 10.11 Japan - Market size and forecast 2023-2028
      • Chart on Japan - Market size and forecast 2023-2028 ($ million)
      • Data Table on Japan - Market size and forecast 2023-2028 ($ million)
      • Chart on Japan - Year-over-year growth 2023-2028 (%)
      • Data Table on Japan - Year-over-year growth 2023-2028 (%)
    • 10.12 France - Market size and forecast 2023-2028
      • Chart on France - Market size and forecast 2023-2028 ($ million)
      • Data Table on France - Market size and forecast 2023-2028 ($ million)
      • Chart on France - Year-over-year growth 2023-2028 (%)
      • Data Table on France - Year-over-year growth 2023-2028 (%)
    • 10.13 Market opportunity by geography
      • Market opportunity by geography ($ million)
      • Data Tables on Market opportunity by geography ($ million)

    11 Drivers, Challenges, and Opportunity/Restraints

    • 11.1 Market drivers
      • 11.2 Market challenges
        • 11.3 Impact of drivers and challenges
          • Impact of drivers and challenges in 2023 and 2028
        • 11.4 Market opportunities/restraints

          12 Competitive Landscape

          • 12.1 Overview
            • 12.2 Competitive Landscape
              • Overview on criticality of inputs and factors of differentiation
            • 12.3 Landscape disruption
              • Overview on factors of disruption
            • 12.4 Industry risks
              • Impact of key risks on business

            13 Competitive Analysis

            • 13.1 Companies profiled
              • Companies covered
            • 13.2 Market positioning of companies
              • Matrix on companies position and classification
            • 13.3 Aerolux Ltd.
              • Aerolux Ltd. - Overview
              • Aerolux Ltd. - Product / Service
              • Aerolux Ltd. - Key offerings
            • 13.4 Air Cabin Engineering Inc.
              • Air Cabin Engineering Inc. - Overview
              • Air Cabin Engineering Inc. - Product / Service
              • Air Cabin Engineering Inc. - Key offerings
            • 13.5 Aluminox S.A.
              • Aluminox S.A. - Overview
              • Aluminox S.A. - Product / Service
              • Aluminox S.A. - Key offerings
            • 13.6 AVIC Cabin Systems Ltd.
              • AVIC Cabin Systems Ltd. - Overview
              • AVIC Cabin Systems Ltd. - Product / Service
              • AVIC Cabin Systems Ltd. - Key offerings
            • 13.7 Bucher Leichtbau AG
              • Bucher Leichtbau AG - Overview
              • Bucher Leichtbau AG - Product / Service
              • Bucher Leichtbau AG - Key offerings
            • 13.8 Diehl Stiftung and Co. KG
              • Diehl Stiftung and Co. KG - Overview
              • Diehl Stiftung and Co. KG - Product / Service
              • Diehl Stiftung and Co. KG - Key news
              • Diehl Stiftung and Co. KG - Key offerings
            • 13.9 Direct Aviation Group
              • Direct Aviation Group - Overview
              • Direct Aviation Group - Product / Service
              • Direct Aviation Group - Key offerings
            • 13.10 ETI Tech LLC
              • ETI Tech LLC - Overview
              • ETI Tech LLC - Product / Service
              • ETI Tech LLC - Key offerings
            • 13.11 Geven Spa
              • Geven Spa - Overview
              • Geven Spa - Product / Service
              • Geven Spa - Key news
              • Geven Spa - Key offerings
            • 13.12 JAMCO Corp.
              • JAMCO Corp. - Overview
              • JAMCO Corp. - Business segments
              • JAMCO Corp. - Key news
              • JAMCO Corp. - Key offerings
              • JAMCO Corp. - Segment focus
            • 13.13 Loipart AB
              • Loipart AB - Overview
              • Loipart AB - Product / Service
              • Loipart AB - Key offerings
            • 13.14 Miele and Cie. KG
              • Miele and Cie. KG - Overview
              • Miele and Cie. KG - Product / Service
              • Miele and Cie. KG - Key offerings
            • 13.15 RTX Corp.
              • RTX Corp. - Overview
              • RTX Corp. - Business segments
              • RTX Corp. - Key news
              • RTX Corp. - Key offerings
              • RTX Corp. - Segment focus
            • 13.16 Safran SA
              • Safran SA - Overview
              • Safran SA - Business segments
              • Safran SA - Key news
              • Safran SA - Key offerings
              • Safran SA - Segment focus
            • 13.17 The Boeing Co.
              • The Boeing Co. - Overview
              • The Boeing Co. - Business segments
              • The Boeing Co. - Key news
              • The Boeing Co. - Key offerings
              • The Boeing Co. - Segment focus

            14 Appendix

            • 14.1 Scope of the report
              • 14.2 Inclusions and exclusions checklist
                • Inclusions checklist
                • Exclusions checklist
              • 14.3 Currency conversion rates for US$
                • Currency conversion rates for US$
              • 14.4 Research methodology
                • Research methodology
              • 14.5 Data procurement
                • Information sources
              • 14.6 Data validation
                • Data validation
              • 14.7 Validation techniques employed for market sizing
                • Validation techniques employed for market sizing
              • 14.8 Data synthesis
                • Data synthesis
              • 14.9 360 degree market analysis
                • 360 degree market analysis
              • 14.10 List of abbreviations
                • List of abbreviations

              Research Methodology

              Technavio presents a detailed picture of the market by way of study, synthesis, and summation of data from multiple sources. The analysts have presented the various facets of the market with a particular focus on identifying the key industry influencers. The data thus presented is comprehensive, reliable, and the result of extensive research, both primary and secondary.

              INFORMATION SOURCES

              Primary sources

              • Manufacturers and suppliers
              • Channel partners
              • Industry experts
              • Strategic decision makers

              Secondary sources

              • Industry journals and periodicals
              • Government data
              • Financial reports of key industry players
              • Historical data
              • Press releases

              DATA ANALYSIS

              Data Synthesis

              • Collation of data
              • Estimation of key figures
              • Analysis of derived insights

              Data Validation

              • Triangulation with data models
              • Reference against proprietary databases
              • Corroboration with industry experts

              REPORT WRITING

              Qualitative

              • Market drivers
              • Market challenges
              • Market trends
              • Five forces analysis

              Quantitative

              • Market size and forecast
              • Market segmentation
              • Geographical insights
              • Competitive landscape

              Interested in this report?

              Get your sample now to see our research methodology and insights!

              Download Now

              Frequently Asked Questions

              Galley Equipment market growth will increase by $ 3184.3 mn during 2024-2028.

              The Galley Equipment market is expected to grow at a CAGR of 5.59% during 2024-2028.

              Galley Equipment market is segmented by Application( Marine, Aviation) Type( Single-aisle, Twin-aisle, Business general aviation, MEA, South America)

              Aerolux Ltd., Air Cabin Engineering Inc., Aluminox S.A., Astronics Corp., AVIC Cabin Systems Ltd., Bucher Leichtbau AG, Diehl Stiftung and Co. KG, Direct Aviation Group, ETI Tech LLC, Euro Composites SA, Geven Spa, GN Espace Galley Solutions Ltd., Goltens Worldwide Management Corp., JAMCO Corp., Kang Li Far East Pte Ltd., Loipart AB, Miele and Cie. KG, RTX Corp., Safran SA, The Boeing Co. are a few of the key vendors in the Galley Equipment market.

              North America will register the highest growth rate of 35% among the other regions. Therefore, the Galley Equipment market in North America is expected to garner significant business opportunities for the vendors during the forecast period.

              US, China, Germany, Japan, France

              • Growing demand for lightweight galley equipmentCommercial aircraft and ship manufacturers are focusing more on installing lightweight galley equipment that will significantly reduce the load on board. Galley equipment vendors are customizing the design is the driving factor this market.
              • construction is the driving factor this market.
              • and technology to suit the end-user demand. Some of the galley equipment vendors that provide customized and lightweight galley equipment include the following:Bucher Group: Known for its lightweight construction techniques is the driving factor this market.
              • the company provides an aluminum galley frame structure is the driving factor this market.
              • which reduces the overall weight of the galley significantly. The company uses an anodized aluminum frame with powder-coated panels that give the galley greater stability and a longer lifespan. Buchers galley system frame is claimed to protect the structure from corrosion for at least 15 years. In addition is the driving factor this market.
              • some of the leading commercial aircraft manufacturers is the driving factor this market.
              • such as Airbus and Boeing is the driving factor this market.
              • prefer the lightweight galley systems provided by Bucher Group in their new aircraft.JAMCO provides its enhanced galley with its Weight Saving Technology to the Boeing aircraft B787.The galley equipment vendors are inclined to use composite-based materials that help reduce the weight of an aircraft substantially. Also is the driving factor this market.
              • the use of such materials helps airlines reduce overall fuel consumption is the driving factor this market.
              • which results in lower operating costs. This will is the driving factor this market.
              • in turn is the driving factor this market.
              • drive the growth of the global galley equipment market during the forecast period. is the driving factor this market.

              The Galley Equipment market vendors should focus on grabbing business opportunities from the Marine segment as it accounted for the largest market share in the base year.
              RIA - Research AI Assistant
              Ask RIA