Game Development Software Market Analysis, Size, and Forecast 2026-2030: North America (US, Canada, and Mexico), APAC (China, Japan, and South Korea), Europe (UK, Germany, and France), South America (Brazil, Argentina, and Colombia), Middle East and Africa (UAE, Saudi Arabia, and South Africa), and Rest of World (ROW)

Game Development Software Market Analysis, Size, and Forecast 2026-2030:
North America (US, Canada, and Mexico), APAC (China, Japan, and South Korea), Europe (UK, Germany, and France), South America (Brazil, Argentina, and Colombia), Middle East and Africa (UAE, Saudi Arabia, and South Africa), and Rest of World (ROW)

Published: Mar 2026 284 Pages SKU: IRTNTR40408

Market Overview at a Glance

$71.17 B
Market Opportunity
5.5%
CAGR 2025 - 2030
39%
North America Growth
$169.66 B
Game engine segment 2024

Game Development Software Market Size 2026-2030

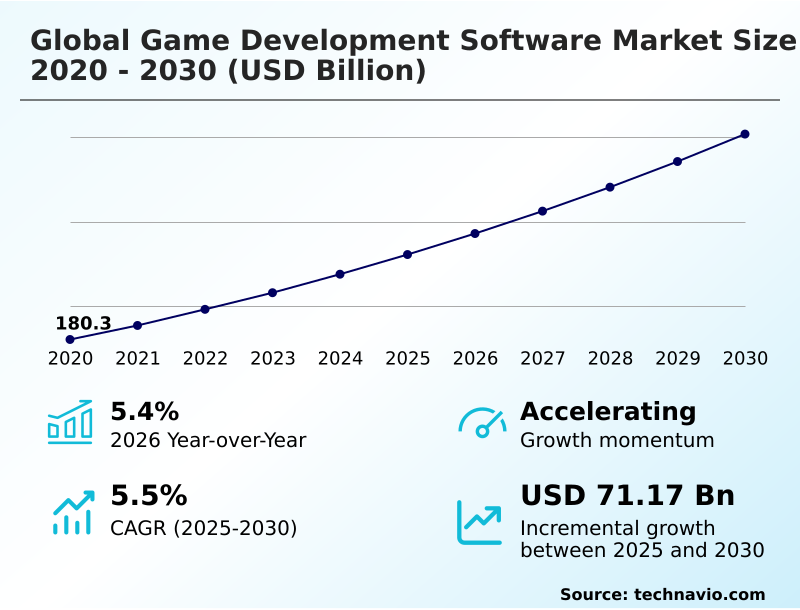
The game development software market size is valued to increase by USD 71.17 billion, at a CAGR of 5.5% from 2025 to 2030. Rapid growth of global gaming industry and expanding player base will drive the game development software market.

Major Market Trends & Insights

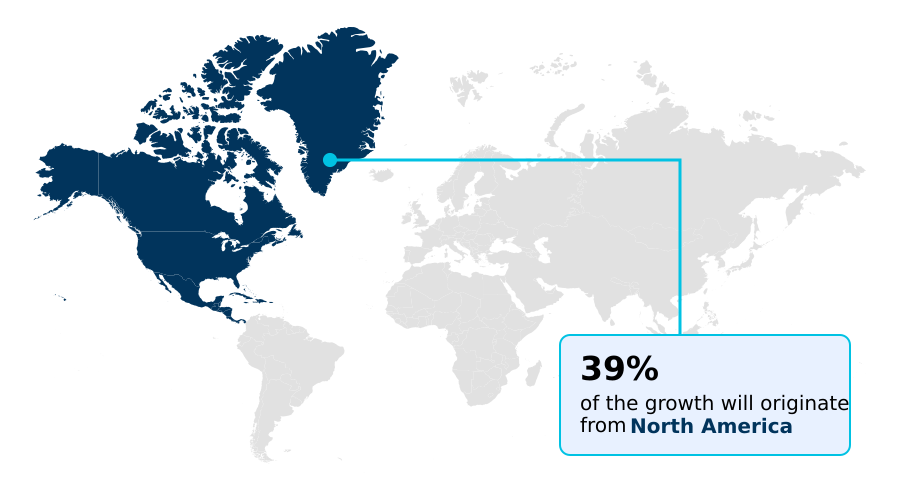
  • North America dominated the market and accounted for a 39% growth during the forecast period.
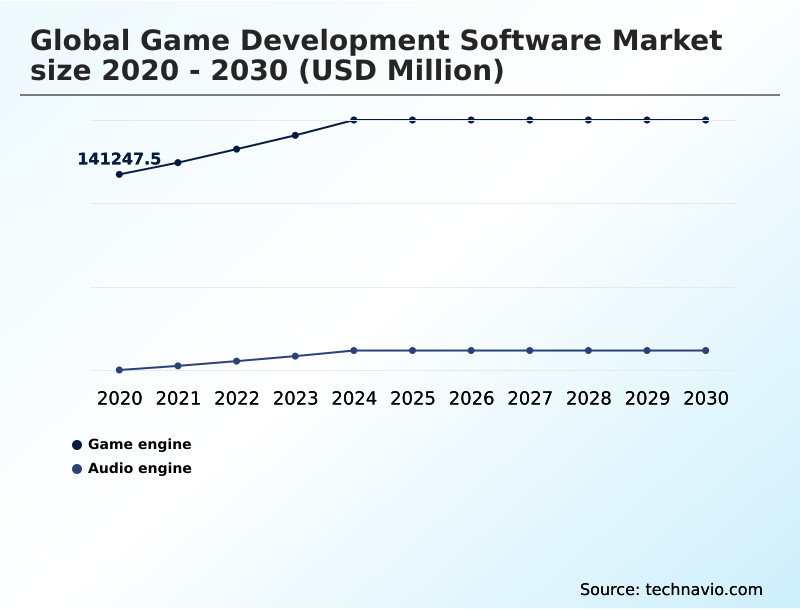
  • By Component - Game engine segment was valued at USD 169.66 billion in 2024
  • By End-user - Enterprises segment accounted for the largest market revenue share in 2024

Market Size & Forecast

  • Market Opportunities: USD 121.38 billion
  • Market Future Opportunities: USD 71.17 billion
  • CAGR from 2025 to 2030 : 5.5%

Market Summary

  • The game development software market is undergoing a significant transformation, driven by the escalating demand for immersive, high-fidelity interactive entertainment across a broadening spectrum of platforms. The core of this market consists of sophisticated toolsets, from the foundational cross-platform game engine to specialized applications for animation and audio.
  • Growth is propelled by the expanding global player base and the extension of game technologies into non-gaming sectors like architectural visualization and automotive design. Key trends shaping the landscape include the integration of artificial intelligence to streamline content creation, such as procedural generation of environments, and the shift toward cloud-based development environments that facilitate remote collaboration for globally distributed teams.
  • For instance, a large studio can leverage a cloud-based pipeline to coordinate hundreds of artists and engineers, significantly reducing asset integration time. However, this progress is met with challenges, including the steep learning curve of advanced tools and the immense cost and complexity associated with developing top-tier, 'AAA' titles, which can inhibit smaller studios and independent creators from competing effectively.
  • The industry's trajectory is toward greater accessibility and automation, aiming to democratize high-end production capabilities.

What will be the Size of the Game Development Software Market during the forecast period?

Get Key Insights on Market Forecast (PDF) Request Free Sample

How is the Game Development Software Market Segmented?

The game development software industry research report provides comprehensive data (region-wise segment analysis), with forecasts and estimates in "USD million" for the period 2026-2030, as well as historical data from 2020-2024 for the following segments.

  • Component
    • Game engine
    • Audio engine
  • End-user
    • Enterprises
    • Individual
  • Deployment
    • Cloud-based
    • On-premises
  • Geography
    • North America
      • US
      • Canada
      • Mexico
    • APAC
      • China
      • Japan
      • South Korea
    • Europe
      • UK
      • Germany
      • France
    • South America
      • Brazil
      • Argentina
      • Colombia
    • Middle East and Africa
      • UAE
      • Saudi Arabia
      • South Africa
    • Rest of World (ROW)

By Component Insights

The game engine segment is estimated to witness significant growth during the forecast period.

The game engine segment is the core of the market, providing the architectural framework for digital content creation tools.

A modern cross-platform game engine integrates a sophisticated real-time rendering engine with tools for physics-based rendering, enabling the creation of a compelling interactive 3d experience.

This evolution supports an interactive development workflow, where studios can achieve up to 40% faster iteration on design elements.

The use of a flexible gameplay scripting language and robust asset creation tools is critical for both the demanding aaa game production pipeline and more accessible indie game developer tools.

Beyond entertainment, these platforms are increasingly used as an architectural visualization engine and for complex simulation and training applications, driving demand for advanced mobile game optimization and streamlined real-time 3d creation.

Request Free Sample

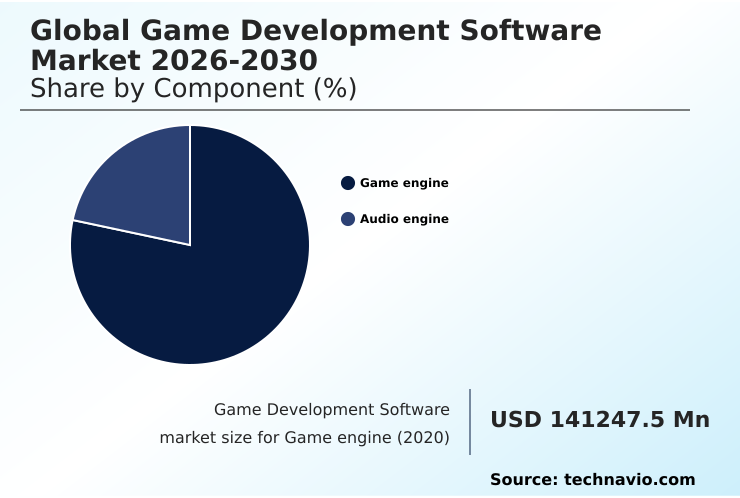
The Game engine segment was valued at USD 169.66 billion in 2024 and showed a gradual increase during the forecast period.

Request Free Sample

Regional Analysis

North America is estimated to contribute 39% to the growth of the global market during the forecast period.Technavio’s analysts have elaborately explained the regional trends and drivers that shape the market during the forecast period.

See How Game Development Software Market Demand is Rising in North America Request Free Sample

Regional dynamics are defined by distinct specializations and investment priorities. North America leads in creating the aaa game production pipeline, heavily utilizing advanced 3d modeling software and virtual production software for cinematic sequences.

The region's focus on high-fidelity visuals drives innovation in the cinematic sequence editor and particle effects editor.

In APAC, where market expansion outpaces North America, the focus is on mobile and online games, requiring strong non-player character AI and procedural animation techniques.

Europe excels in simulation and training applications and digital twin simulation, leveraging the physics simulation library and spatial audio engine for realism.

Emerging hubs are contributing to the decentralized asset marketplace, using advanced level design software to create unique interactive content for a global audience.

Market Dynamics

Our researchers analyzed the data with 2025 as the base year, along with the key drivers, trends, and challenges. A holistic analysis of drivers will help companies refine their marketing strategies to gain a competitive advantage.

  • Developer focus is increasingly specialized, driving demand for tailored toolsets across diverse applications. Studios exploring game development software for vr are prioritizing spatial audio for immersive experiences, while those targeting mass-market adoption seek the best game engine for mobile. A key decision point involves a cross-platform development tools comparison, weighing efficiency against platform-specific performance.
  • The use of ai in procedural content generation is becoming a standard practice for managing assets in large projects, automating tasks that were previously resource-intensive. Beyond entertainment, real-time rendering for architectural visualization is a rapidly growing segment.
  • The shift to remote work has amplified the need for cloud collaboration tools for developers, while live-service titles require robust live ops management for service games and backend services for user authentication. For high-end productions, optimizing game performance on consoles and mastering the character rigging and animation pipeline remain critical skills.
  • Developers are building multiplayer games with unreal and using visual scripting for prototyping to accelerate iteration. Success also depends on integrating monetization sdk in unity, creating cinematic sequences in-engine, and using effective tools for indie game marketing.
  • As the industry evolves, expertise in automated testing for mobile games, developing games for the metaverse, and utilizing low-code platforms for 2d games will become even more crucial, especially as growth in regions like APAC outpaces North America, creating new market dynamics.

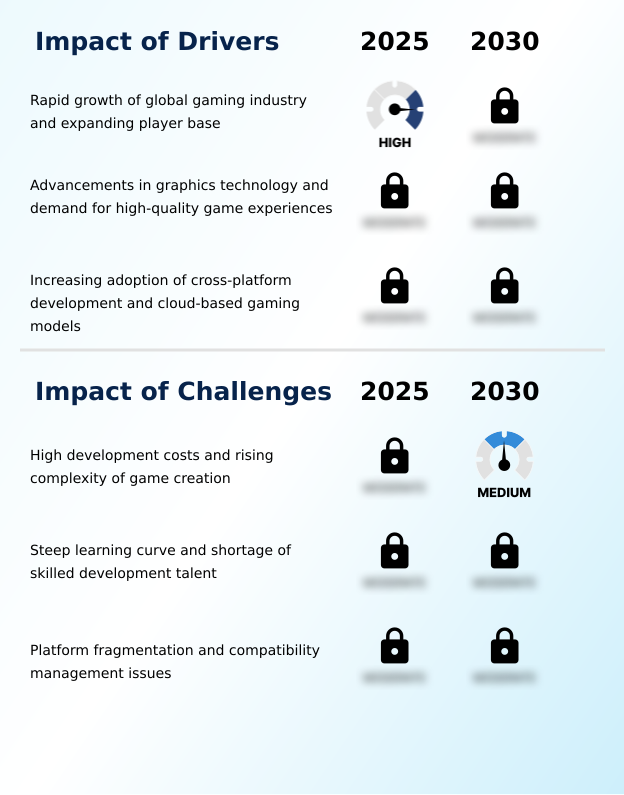
What are the key market drivers leading to the rise in the adoption of Game Development Software Industry?

  • The rapid growth of the global gaming industry, coupled with an expanding player base, is a key driver for the game development software market.

  • Key market drivers are centered on live services and the creator economy, which demand robust backend infrastructure and continuous engagement.
  • The need for seamless cross-platform multiplayer experiences is fueling demand for a sophisticated multiplayer networking framework and scalable game server hosting.
  • A comprehensive live operations backend, integrated with a game analytics platform, is critical for success, as live service titles demonstrate a 30% higher player retention rate.
  • Effective monetization sdk integration and in-game economy management are essential, with player data analytics correlating to a 20% uplift in revenue.
  • The push for graphical fidelity is supported by real-time ray tracing, while low-latency game streaming and esports broadcasting tools expand audience reach, all powered by backend as a service for games.

What are the market trends shaping the Game Development Software Industry?

  • The rising adoption of real-time game engines is a prominent trend. This shift enables more interactive and efficient development workflows across the industry.

  • Market trends are increasingly shaped by intelligent automation and immersive technologies. The adoption of a visual scripting interface is accelerating low-code game development, making complex creation more accessible. AI-driven game design is now central, with ai-driven animation and procedural content generation automating repetitive tasks.
  • Studios are leveraging a cloud-based development environment to enable collaborative game development across global teams, improving project efficiency by over 25%. For building the next generation of interactive media, a dedicated virtual reality sdk and augmented reality toolkit are essential for immersive experience design.
  • Furthermore, the rise of the creator economy tools is empowering a user-generated content platform, which is foundational to the emerging metaverse development platform, where user engagement is paramount.

What challenges does the Game Development Software Industry face during its growth?

  • High development costs and the rising complexity of game creation present a key challenge affecting industry growth.

  • Significant market challenges stem from rising production complexity and the high cost of quality assurance. The intricate character animation system and the resources required for photogrammetry asset creation increase development overhead. Crafting advanced visuals requires specialized shader development tools, while managing large projects necessitates robust version control integration.
  • The process of console game porting can extend project timelines by up to 35%, complicated by the need for extensive game performance profiling using in-engine profiling tools. Ensuring quality across platforms requires comprehensive automated testing tools and effective game localization tools.
  • Moreover, developers face pressure from rising costs for game security solutions and content delivery network for games, alongside competition on every asset store marketplace while working on procedural world building.

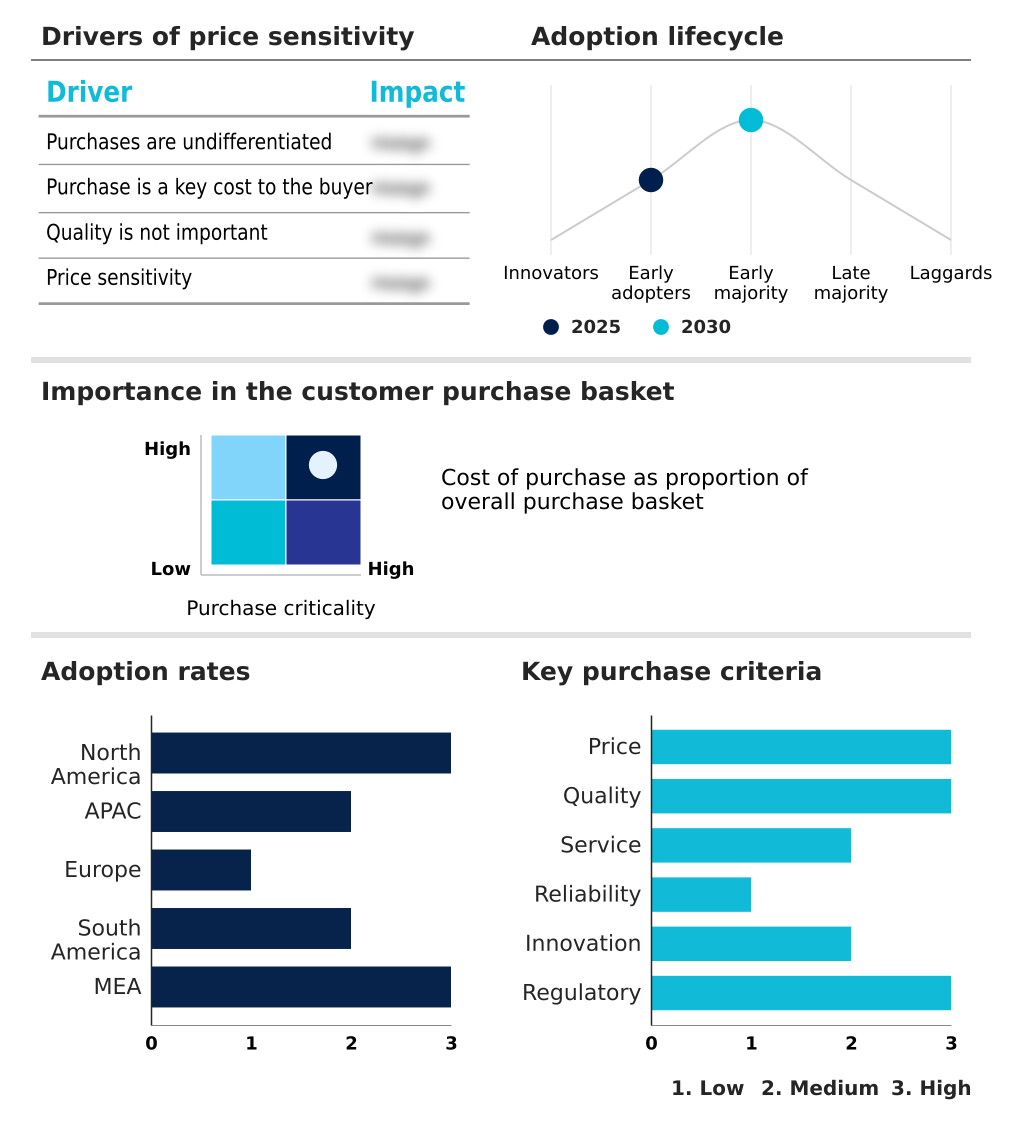
Exclusive Technavio Analysis on Customer Landscape

The game development software market forecasting report includes the adoption lifecycle of the market, covering from the innovator’s stage to the laggard’s stage. It focuses on adoption rates in different regions based on penetration. Furthermore, the game development software market report also includes key purchase criteria and drivers of price sensitivity to help companies evaluate and develop their market growth analysis strategies.

Customer Landscape of Game Development Software Industry

Competitive Landscape

Companies are implementing various strategies, such as strategic alliances, game development software market forecast, partnerships, mergers and acquisitions, geographical expansion, and product/service launches, to enhance their presence in the industry.

Amazon Web Services Inc. - Foundational offerings include real-time engines, cloud services, and specialized tools for modeling, animation, and live operations that power cross-platform interactive content development.

The industry research and growth report includes detailed analyses of the competitive landscape of the market and information about key companies, including:

  • Amazon Web Services Inc.
  • Autodesk Inc.
  • Cocos
  • Crytek GmbH
  • Defold Foundation
  • Electronic Arts Inc.
  • Epic Games Inc.
  • Meta Platforms Inc.
  • Microsoft Corp.
  • NVIDIA Corp.
  • Perforce Software Inc.
  • Roblox Corp.
  • Scirra Ltd.
  • Side Effects Software Inc.
  • Solar2D LLC
  • Unity Technologies Inc.

Qualitative and quantitative analysis of companies has been conducted to help clients understand the wider business environment as well as the strengths and weaknesses of key industry players. Data is qualitatively analyzed to categorize companies as pure play, category-focused, industry-focused, and diversified; it is quantitatively analyzed to categorize companies as dominant, leading, strong, tentative, and weak.

Recent Development and News in Game development software market

  • In August 2024, the Godot Engine project launched version 4.3, which featured significant enhancements to its web export pipeline and tools for creating browser-based interactive content.
  • In September 2024, Unity Technologies announced a major overhaul of its pricing model, canceling its proposed runtime fee in favor of an updated seat-based structure to provide stability for developers.
  • In October 2024, Unity Technologies globally launched Unity 6, its next-generation platform, delivering major performance boosts through GPU-based workloads and introducing end-to-end multiplayer development workflows.
  • In March 2025, NVIDIA expanded its Omniverse platform with a new suite of generative artificial intelligence tools designed to automate the creation of complex 3D environments using advanced neural rendering techniques.

Dive into Technavio’s robust research methodology, blending expert interviews, extensive data synthesis, and validated models for unparalleled Game Development Software Market insights. See full methodology.

Market Scope
Page number 284
Base year 2025
Historic period 2020-2024
Forecast period 2026-2030
Growth momentum & CAGR Accelerate at a CAGR of 5.5%
Market growth 2026-2030 USD 71173.1 million
Market structure Fragmented
YoY growth 2025-2026(%) 5.4%
Key countries US, Canada, Mexico, China, Japan, South Korea, India, Australia, Indonesia, UK, Germany, France, Italy, Spain, The Netherlands, Brazil, Argentina, Colombia, UAE, Saudi Arabia, South Africa, Israel and Turkey
Competitive landscape Leading Companies, Market Positioning of Companies, Competitive Strategies, and Industry Risks

Request Free Sample

Research Analyst Overview

  • The creative pipeline integrates specialized technologies, starting with digital content creation tools like 3d modeling software and photogrammetry asset creation. These assets are managed within a cross-platform game engine, a real-time rendering engine enhanced with real-time ray tracing and physics-based rendering. This engine uses a physics simulation library and a gameplay scripting language to build an interactive 3d experience.
  • A visual scripting interface and procedural world building accelerate development, while artists use a particle effects editor, shader development tools, and level design software. The character animation system benefits from ai-driven animation, and a spatial audio engine enhances immersion alongside a virtual reality sdk or augmented reality toolkit. A cinematic sequence editor crafts narratives.
  • For live titles, a multiplayer networking framework, live operations backend, and game backend services are vital, supported by a game analytics platform and monetization sdk integration.
  • A cloud-based development environment with version control integration, in-engine profiling tools, and automated testing tools can reduce bug-related rework by over 20%, critical for projects using a user-generated content platform or decentralized asset marketplace for low-latency game streaming.

What are the Key Data Covered in this Game Development Software Market Research and Growth Report?

  • What is the expected growth of the Game Development Software Market between 2026 and 2030?

    • USD 71.17 billion, at a CAGR of 5.5%

  • What segmentation does the market report cover?

    • The report is segmented by Component (Game engine, and Audio engine), End-user (Enterprises, and Individual), Deployment (Cloud-based, and On-premises) and Geography (North America, APAC, Europe, South America, Middle East and Africa)

  • Which regions are analyzed in the report?

    • North America, APAC, Europe, South America and Middle East and Africa

  • What are the key growth drivers and market challenges?

    • Rapid growth of global gaming industry and expanding player base, High development costs and rising complexity of game creation

  • Who are the major players in the Game Development Software Market?

    • Amazon Web Services Inc., Autodesk Inc., Cocos, Crytek GmbH, Defold Foundation, Electronic Arts Inc., Epic Games Inc., Meta Platforms Inc., Microsoft Corp., NVIDIA Corp., Perforce Software Inc., Roblox Corp., Scirra Ltd., Side Effects Software Inc., Solar2D LLC and Unity Technologies Inc.

Market Research Insights

  • Market dynamics are shaped by a confluence of technological innovation and evolving business models. An interactive development workflow, enabled by real-time 3d creation, is now standard in the aaa game production pipeline, improving asset iteration speeds by over 30%.
  • The push for collaborative game development is supported by game server hosting and a robust backend as a service for games, essential for cross-platform multiplayer functionality. AI-driven game design and non-player character AI are transforming content creation, with procedural animation techniques reducing manual effort.
  • For creators, indie game developer tools and low-code game development platforms democratize access, feeding the asset store marketplace and creator economy tools. The industry also extends into virtual production software, architectural visualization engine, digital twin simulation, and simulation and training applications.
  • Monetization is driven by in-game economy management and player data analytics, with mobile game optimization and console game porting being critical for reach.
  • Ensuring quality requires game performance profiling, game security solutions, a content delivery network for games, and robust game localization tools for a global audience, while esports broadcasting tools and the metaverse development platform represent new frontiers for immersive experience design and a dynamic lighting system.

We can help! Our analysts can customize this game development software market research report to meet your requirements.

Get in touch

1. Executive Summary

1.1 Market overview

Executive Summary - Chart on Market Overview
Executive Summary - Data Table on Market Overview
Executive Summary - Chart on Global Market Characteristics
Executive Summary - Chart on Market by Geography
Executive Summary - Chart on Market Segmentation by Component
Executive Summary - Chart on Market Segmentation by End-user
Executive Summary - Chart on Market Segmentation by Deployment
Executive Summary - Chart on Incremental Growth
Executive Summary - Data Table on Incremental Growth
Executive Summary - Chart on Company Market Positioning

2. Technavio Analysis

2.1 Analysis of price sensitivity, lifecycle, customer purchase basket, adoption rates, and purchase criteria

2.2 Criticality of inputs and Factors of differentiation

Chart on Overview on criticality of inputs and factors of differentiation

2.3 Factors of disruption

Chart on Overview on factors of disruption

2.4 Impact of drivers and challenges

Chart on Impact of drivers and challenges in 2025 and 2030

3. Market Landscape

3.1 Market ecosystem

Chart on Parent Market
Data Table on - Parent Market

3.2 Market characteristics

Chart on Market characteristics analysis

3.3 Value chain analysis

Chart on Value chain analysis

4. Market Sizing

4.1 Market definition

Data Table on Offerings of companies included in the market definition

4.2 Market segment analysis

Market segments

4.3 Market size 2025

4.4 Market outlook: Forecast for 2025-2030

Chart on Global - Market size and forecast 2025-2030 ($ million)
Data Table on Global - Market size and forecast 2025-2030 ($ million)
Chart on Global Market: Year-over-year growth 2025-2030 (%)
Data Table on Global Market: Year-over-year growth 2025-2030 (%)

5. Historic Market Size

5.1 Global Game Development Software Market 2020 - 2024

Historic Market Size - Data Table on Global Game Development Software Market 2020 - 2024 ($ million)

5.2 Component segment analysis 2020 - 2024

Historic Market Size - Component Segment 2020 - 2024 ($ million)

5.3 End-user segment analysis 2020 - 2024

Historic Market Size - End-user Segment 2020 - 2024 ($ million)

5.4 Deployment segment analysis 2020 - 2024

Historic Market Size - Deployment Segment 2020 - 2024 ($ million)

5.5 Geography segment analysis 2020 - 2024

Historic Market Size - Geography Segment 2020 - 2024 ($ million)

5.6 Country segment analysis 2020 - 2024

Historic Market Size - Country Segment 2020 - 2024 ($ million)

6. Qualitative Analysis

6.1 The AI impact on Global Game Development Software Market

7. Five Forces Analysis

7.1 Five forces summary

Five forces analysis - Comparison between 2025 and 2030

7.2 Bargaining power of buyers

Bargaining power of buyers - Impact of key factors 2025 and 2030

7.3 Bargaining power of suppliers

Bargaining power of suppliers - Impact of key factors in 2025 and 2030

7.4 Threat of new entrants

Threat of new entrants - Impact of key factors in 2025 and 2030

7.5 Threat of substitutes

Threat of substitutes - Impact of key factors in 2025 and 2030

7.6 Threat of rivalry

Threat of rivalry - Impact of key factors in 2025 and 2030

7.7 Market condition

Chart on Market condition - Five forces 2025 and 2030

8. Market Segmentation by Component

8.1 Market segments

Chart on Component - Market share 2025-2030 (%)
Data Table on Component - Market share 2025-2030 (%)

8.2 Comparison by Component

Chart on Comparison by Component
Data Table on Comparison by Component

8.3 Game engine - Market size and forecast 2025-2030

Chart on Game engine - Market size and forecast 2025-2030 ($ million)
Data Table on Game engine - Market size and forecast 2025-2030 ($ million)
Chart on Game engine - Year-over-year growth 2025-2030 (%)
Data Table on Game engine - Year-over-year growth 2025-2030 (%)

8.4 Audio engine - Market size and forecast 2025-2030

Chart on Audio engine - Market size and forecast 2025-2030 ($ million)
Data Table on Audio engine - Market size and forecast 2025-2030 ($ million)
Chart on Audio engine - Year-over-year growth 2025-2030 (%)
Data Table on Audio engine - Year-over-year growth 2025-2030 (%)

8.5 Market opportunity by Component

Market opportunity by Component ($ million)
Data Table on Market opportunity by Component ($ million)

9. Market Segmentation by End-user

9.1 Market segments

Chart on End-user - Market share 2025-2030 (%)
Data Table on End-user - Market share 2025-2030 (%)

9.2 Comparison by End-user

Chart on Comparison by End-user
Data Table on Comparison by End-user

9.3 Enterprises - Market size and forecast 2025-2030

Chart on Enterprises - Market size and forecast 2025-2030 ($ million)
Data Table on Enterprises - Market size and forecast 2025-2030 ($ million)
Chart on Enterprises - Year-over-year growth 2025-2030 (%)
Data Table on Enterprises - Year-over-year growth 2025-2030 (%)

9.4 Individual - Market size and forecast 2025-2030

Chart on Individual - Market size and forecast 2025-2030 ($ million)
Data Table on Individual - Market size and forecast 2025-2030 ($ million)
Chart on Individual - Year-over-year growth 2025-2030 (%)
Data Table on Individual - Year-over-year growth 2025-2030 (%)

9.5 Market opportunity by End-user

Market opportunity by End-user ($ million)
Data Table on Market opportunity by End-user ($ million)

10. Market Segmentation by Deployment

10.1 Market segments

Chart on Deployment - Market share 2025-2030 (%)
Data Table on Deployment - Market share 2025-2030 (%)

10.2 Comparison by Deployment

Chart on Comparison by Deployment
Data Table on Comparison by Deployment

10.3 Cloud-based - Market size and forecast 2025-2030

Chart on Cloud-based - Market size and forecast 2025-2030 ($ million)
Data Table on Cloud-based - Market size and forecast 2025-2030 ($ million)
Chart on Cloud-based - Year-over-year growth 2025-2030 (%)
Data Table on Cloud-based - Year-over-year growth 2025-2030 (%)

10.4 On-premises - Market size and forecast 2025-2030

Chart on On-premises - Market size and forecast 2025-2030 ($ million)
Data Table on On-premises - Market size and forecast 2025-2030 ($ million)
Chart on On-premises - Year-over-year growth 2025-2030 (%)
Data Table on On-premises - Year-over-year growth 2025-2030 (%)

10.5 Market opportunity by Deployment

Market opportunity by Deployment ($ million)
Data Table on Market opportunity by Deployment ($ million)

11. Customer Landscape

11.1 Customer landscape overview

Analysis of price sensitivity, lifecycle, customer purchase basket, adoption rates, and purchase criteria

12. Geographic Landscape

12.1 Geographic segmentation

Chart on Market share by geography 2025-2030 (%)
Data Table on Market share by geography 2025-2030 (%)

12.2 Geographic comparison

Chart on Geographic comparison
Data Table on Geographic comparison

12.3 North America - Market size and forecast 2025-2030

Chart on North America - Market size and forecast 2025-2030 ($ million)
Data Table on North America - Market size and forecast 2025-2030 ($ million)
Chart on North America - Year-over-year growth 2025-2030 (%)
Data Table on North America - Year-over-year growth 2025-2030 (%)
Chart on Regional Comparison - North America
Data Table on Regional Comparison - North America

12.3.1 US - Market size and forecast 2025-2030

Chart on US - Market size and forecast 2025-2030 ($ million)
Data Table on US - Market size and forecast 2025-2030 ($ million)
Chart on US - Year-over-year growth 2025-2030 (%)
Data Table on US - Year-over-year growth 2025-2030 (%)

12.3.2 Canada - Market size and forecast 2025-2030

Chart on Canada - Market size and forecast 2025-2030 ($ million)
Data Table on Canada - Market size and forecast 2025-2030 ($ million)
Chart on Canada - Year-over-year growth 2025-2030 (%)
Data Table on Canada - Year-over-year growth 2025-2030 (%)

12.3.3 Mexico - Market size and forecast 2025-2030

Chart on Mexico - Market size and forecast 2025-2030 ($ million)
Data Table on Mexico - Market size and forecast 2025-2030 ($ million)
Chart on Mexico - Year-over-year growth 2025-2030 (%)
Data Table on Mexico - Year-over-year growth 2025-2030 (%)

12.4 APAC - Market size and forecast 2025-2030

Chart on APAC - Market size and forecast 2025-2030 ($ million)
Data Table on APAC - Market size and forecast 2025-2030 ($ million)
Chart on APAC - Year-over-year growth 2025-2030 (%)
Data Table on APAC - Year-over-year growth 2025-2030 (%)
Chart on Regional Comparison - APAC
Data Table on Regional Comparison - APAC

12.4.1 China - Market size and forecast 2025-2030

Chart on China - Market size and forecast 2025-2030 ($ million)
Data Table on China - Market size and forecast 2025-2030 ($ million)
Chart on China - Year-over-year growth 2025-2030 (%)
Data Table on China - Year-over-year growth 2025-2030 (%)

12.4.2 Japan - Market size and forecast 2025-2030

Chart on Japan - Market size and forecast 2025-2030 ($ million)
Data Table on Japan - Market size and forecast 2025-2030 ($ million)
Chart on Japan - Year-over-year growth 2025-2030 (%)
Data Table on Japan - Year-over-year growth 2025-2030 (%)

12.4.3 South Korea - Market size and forecast 2025-2030

Chart on South Korea - Market size and forecast 2025-2030 ($ million)
Data Table on South Korea - Market size and forecast 2025-2030 ($ million)
Chart on South Korea - Year-over-year growth 2025-2030 (%)
Data Table on South Korea - Year-over-year growth 2025-2030 (%)

12.4.4 India - Market size and forecast 2025-2030

Chart on India - Market size and forecast 2025-2030 ($ million)
Data Table on India - Market size and forecast 2025-2030 ($ million)
Chart on India - Year-over-year growth 2025-2030 (%)
Data Table on India - Year-over-year growth 2025-2030 (%)

12.4.5 Australia - Market size and forecast 2025-2030

Chart on Australia - Market size and forecast 2025-2030 ($ million)
Data Table on Australia - Market size and forecast 2025-2030 ($ million)
Chart on Australia - Year-over-year growth 2025-2030 (%)
Data Table on Australia - Year-over-year growth 2025-2030 (%)

12.4.6 Indonesia - Market size and forecast 2025-2030

Chart on Indonesia - Market size and forecast 2025-2030 ($ million)
Data Table on Indonesia - Market size and forecast 2025-2030 ($ million)
Chart on Indonesia - Year-over-year growth 2025-2030 (%)
Data Table on Indonesia - Year-over-year growth 2025-2030 (%)

12.5 Europe - Market size and forecast 2025-2030

Chart on Europe - Market size and forecast 2025-2030 ($ million)
Data Table on Europe - Market size and forecast 2025-2030 ($ million)
Chart on Europe - Year-over-year growth 2025-2030 (%)
Data Table on Europe - Year-over-year growth 2025-2030 (%)
Chart on Regional Comparison - Europe
Data Table on Regional Comparison - Europe

12.5.1 UK - Market size and forecast 2025-2030

Chart on UK - Market size and forecast 2025-2030 ($ million)
Data Table on UK - Market size and forecast 2025-2030 ($ million)
Chart on UK - Year-over-year growth 2025-2030 (%)
Data Table on UK - Year-over-year growth 2025-2030 (%)

12.5.2 Germany - Market size and forecast 2025-2030

Chart on Germany - Market size and forecast 2025-2030 ($ million)
Data Table on Germany - Market size and forecast 2025-2030 ($ million)
Chart on Germany - Year-over-year growth 2025-2030 (%)
Data Table on Germany - Year-over-year growth 2025-2030 (%)

12.5.3 France - Market size and forecast 2025-2030

Chart on France - Market size and forecast 2025-2030 ($ million)
Data Table on France - Market size and forecast 2025-2030 ($ million)
Chart on France - Year-over-year growth 2025-2030 (%)
Data Table on France - Year-over-year growth 2025-2030 (%)

12.5.4 Italy - Market size and forecast 2025-2030

Chart on Italy - Market size and forecast 2025-2030 ($ million)
Data Table on Italy - Market size and forecast 2025-2030 ($ million)
Chart on Italy - Year-over-year growth 2025-2030 (%)
Data Table on Italy - Year-over-year growth 2025-2030 (%)

12.5.5 Spain - Market size and forecast 2025-2030

Chart on Spain - Market size and forecast 2025-2030 ($ million)
Data Table on Spain - Market size and forecast 2025-2030 ($ million)
Chart on Spain - Year-over-year growth 2025-2030 (%)
Data Table on Spain - Year-over-year growth 2025-2030 (%)

12.5.6 The Netherlands - Market size and forecast 2025-2030

Chart on The Netherlands - Market size and forecast 2025-2030 ($ million)
Data Table on The Netherlands - Market size and forecast 2025-2030 ($ million)
Chart on The Netherlands - Year-over-year growth 2025-2030 (%)
Data Table on The Netherlands - Year-over-year growth 2025-2030 (%)

12.6 South America - Market size and forecast 2025-2030

Chart on South America - Market size and forecast 2025-2030 ($ million)
Data Table on South America - Market size and forecast 2025-2030 ($ million)
Chart on South America - Year-over-year growth 2025-2030 (%)
Data Table on South America - Year-over-year growth 2025-2030 (%)
Chart on Regional Comparison - South America
Data Table on Regional Comparison - South America

12.6.1 Brazil - Market size and forecast 2025-2030

Chart on Brazil - Market size and forecast 2025-2030 ($ million)
Data Table on Brazil - Market size and forecast 2025-2030 ($ million)
Chart on Brazil - Year-over-year growth 2025-2030 (%)
Data Table on Brazil - Year-over-year growth 2025-2030 (%)

12.6.2 Argentina - Market size and forecast 2025-2030

Chart on Argentina - Market size and forecast 2025-2030 ($ million)
Data Table on Argentina - Market size and forecast 2025-2030 ($ million)
Chart on Argentina - Year-over-year growth 2025-2030 (%)
Data Table on Argentina - Year-over-year growth 2025-2030 (%)

12.6.3 Colombia - Market size and forecast 2025-2030

Chart on Colombia - Market size and forecast 2025-2030 ($ million)
Data Table on Colombia - Market size and forecast 2025-2030 ($ million)
Chart on Colombia - Year-over-year growth 2025-2030 (%)
Data Table on Colombia - Year-over-year growth 2025-2030 (%)

12.7 Middle East and Africa - Market size and forecast 2025-2030

Chart on Middle East and Africa - Market size and forecast 2025-2030 ($ million)
Data Table on Middle East and Africa - Market size and forecast 2025-2030 ($ million)
Chart on Middle East and Africa - Year-over-year growth 2025-2030 (%)
Data Table on Middle East and Africa - Year-over-year growth 2025-2030 (%)
Chart on Regional Comparison - Middle East and Africa
Data Table on Regional Comparison - Middle East and Africa

12.7.1 UAE - Market size and forecast 2025-2030

Chart on UAE - Market size and forecast 2025-2030 ($ million)
Data Table on UAE - Market size and forecast 2025-2030 ($ million)
Chart on UAE - Year-over-year growth 2025-2030 (%)
Data Table on UAE - Year-over-year growth 2025-2030 (%)

12.7.2 Saudi Arabia - Market size and forecast 2025-2030

Chart on Saudi Arabia - Market size and forecast 2025-2030 ($ million)
Data Table on Saudi Arabia - Market size and forecast 2025-2030 ($ million)
Chart on Saudi Arabia - Year-over-year growth 2025-2030 (%)
Data Table on Saudi Arabia - Year-over-year growth 2025-2030 (%)

12.7.3 South Africa - Market size and forecast 2025-2030

Chart on South Africa - Market size and forecast 2025-2030 ($ million)
Data Table on South Africa - Market size and forecast 2025-2030 ($ million)
Chart on South Africa - Year-over-year growth 2025-2030 (%)
Data Table on South Africa - Year-over-year growth 2025-2030 (%)

12.7.4 Israel - Market size and forecast 2025-2030

Chart on Israel - Market size and forecast 2025-2030 ($ million)
Data Table on Israel - Market size and forecast 2025-2030 ($ million)
Chart on Israel - Year-over-year growth 2025-2030 (%)
Data Table on Israel - Year-over-year growth 2025-2030 (%)

12.7.5 Turkey - Market size and forecast 2025-2030

Chart on Turkey - Market size and forecast 2025-2030 ($ million)
Data Table on Turkey - Market size and forecast 2025-2030 ($ million)
Chart on Turkey - Year-over-year growth 2025-2030 (%)
Data Table on Turkey - Year-over-year growth 2025-2030 (%)

12.8 Market opportunity by geography

Market opportunity by geography ($ million)
Data Tables on Market opportunity by geography ($ million)

13. Drivers, Challenges, and Opportunity

13.1 Market drivers

Rapid growth of global gaming industry and expanding player base
Advancements in graphics technology and demand for high-quality game experiences
Increasing adoption of cross-platform development and cloud-based gaming models

13.2 Market challenges

High development costs and rising complexity of game creation
Steep learning curve and shortage of skilled development talent
Platform fragmentation and compatibility management issues

13.3 Impact of drivers and challenges

Impact of drivers and challenges in 2025 and 2030

13.4 Market opportunities

Rising adoption of real-time game engines and interactive development workflows
Increasing use of AI for game design and development automation
Growth of collaborative and cloud-based development environments

14. Competitive Landscape

14.1 Overview

14.2

Overview on criticality of inputs and factors of differentiation

14.3 Landscape disruption

Overview on factors of disruption

14.4 Industry risks

Impact of key risks on business

15. Competitive Analysis

15.1 Companies profiled

Companies covered

15.2 Company ranking index

15.3 Market positioning of companies

Matrix on companies position and classification

15.4 Amazon Web Services Inc.

Amazon Web Services Inc. - Overview
Amazon Web Services Inc. - Product / Service
Amazon Web Services Inc. - Key news
Amazon Web Services Inc. - Key offerings
SWOT

15.5 Autodesk Inc.

Autodesk Inc. - Overview
Autodesk Inc. - Business segments
Autodesk Inc. - Key news
Autodesk Inc. - Key offerings
Autodesk Inc. - Segment focus
SWOT

15.6 Cocos

Cocos - Overview
Cocos - Product / Service
Cocos - Key offerings
SWOT

15.7 Crytek GmbH

Crytek GmbH - Overview
Crytek GmbH - Product / Service
Crytek GmbH - Key offerings
SWOT

15.8 Defold Foundation

Defold Foundation - Overview
Defold Foundation - Product / Service
Defold Foundation - Key offerings
SWOT

15.9 Electronic Arts Inc.

Electronic Arts Inc. - Overview
Electronic Arts Inc. - Product / Service
Electronic Arts Inc. - Key offerings
SWOT

15.10 Epic Games Inc.

Epic Games Inc. - Overview
Epic Games Inc. - Product / Service
Epic Games Inc. - Key offerings
SWOT

15.11 Meta Platforms Inc.

Meta Platforms Inc. - Overview
Meta Platforms Inc. - Business segments
Meta Platforms Inc. - Key offerings
Meta Platforms Inc. - Segment focus
SWOT

15.12 Microsoft Corp.

Microsoft Corp. - Overview
Microsoft Corp. - Business segments
Microsoft Corp. - Key news
Microsoft Corp. - Key offerings
Microsoft Corp. - Segment focus
SWOT

15.13 NVIDIA Corp.

NVIDIA Corp. - Overview
NVIDIA Corp. - Business segments
NVIDIA Corp. - Key news
NVIDIA Corp. - Key offerings
NVIDIA Corp. - Segment focus
SWOT

15.14 Perforce Software Inc.

Perforce Software Inc. - Overview
Perforce Software Inc. - Product / Service
Perforce Software Inc. - Key offerings
SWOT

15.15 Roblox Corp.

Roblox Corp. - Overview
Roblox Corp. - Product / Service
Roblox Corp. - Key offerings
SWOT

15.16 Side Effects Software Inc.

Side Effects Software Inc. - Overview
Side Effects Software Inc. - Product / Service
Side Effects Software Inc. - Key offerings
SWOT

15.17 Solar2D LLC

Solar2D LLC - Overview
Solar2D LLC - Product / Service
Solar2D LLC - Key offerings
SWOT

15.18 Unity Technologies Inc.

Unity Technologies Inc. - Overview
Unity Technologies Inc. - Business segments
Unity Technologies Inc. - Key news
Unity Technologies Inc. - Key offerings
Unity Technologies Inc. - Segment focus
SWOT

16. Appendix

16.1 Scope of the report

Market definition
Objectives
Notes and caveats

16.2 Inclusions and exclusions checklist

Inclusions checklist
Exclusions checklist

16.3 Currency conversion rates for US$

16.4 Research methodology

16.5 Data procurement

Information sources

16.6 Data validation

16.7 Validation techniques employed for market sizing

16.8 Data synthesis

16.9 360 degree market analysis

16.10 List of abbreviations

Research Methodology

Technavio presents a detailed picture of the market by way of study, synthesis, and summation of data from multiple sources. The analysts have presented the various facets of the market with a particular focus on identifying the key industry influencers. The data thus presented is comprehensive, reliable, and the result of extensive research, both primary and secondary.

INFORMATION SOURCES

Primary sources

  • Manufacturers and suppliers
  • Channel partners
  • Industry experts
  • Strategic decision makers

Secondary sources

  • Industry journals and periodicals
  • Government data
  • Financial reports of key industry players
  • Historical data
  • Press releases

DATA ANALYSIS

Data Synthesis

  • Collation of data
  • Estimation of key figures
  • Analysis of derived insights

Data Validation

  • Triangulation with data models
  • Reference against proprietary databases
  • Corroboration with industry experts

REPORT WRITING

Qualitative

  • Market drivers
  • Market challenges
  • Market trends
  • Five forces analysis

Quantitative

  • Market size and forecast
  • Market segmentation
  • Geographical insights
  • Competitive landscape

Interested in this report?

Get your sample now to see our research methodology and insights!

Download Now

Frequently Asked Questions

Game Development Software market growth will increase by USD 71173.1 million during 2026-2030.

The Game Development Software market is expected to grow at a CAGR of 5.5% during 2026-2030.

Game Development Software market is segmented by Component (Game engine, Audio engine) End-user (Enterprises, Individual) Deployment (Cloud-based, On-premises)

Amazon Web Services Inc., Autodesk Inc., Cocos, Crytek GmbH, Defold Foundation, Electronic Arts Inc., Epic Games Inc., Meta Platforms Inc., Microsoft Corp., NVIDIA Corp., Perforce Software Inc., Roblox Corp., Scirra Ltd., Side Effects Software Inc., Solar2D LLC, Unity Technologies Inc. are a few of the key vendors in the Game Development Software market.

North America will register the highest growth rate of 39% among the other regions. Therefore, the Game Development Software market in North America is expected to garner significant business opportunities for the vendors during the forecast period.

US, Canada, Mexico, China, Japan, South Korea, India, Australia, Indonesia, UK, Germany, France, Italy, Spain, The Netherlands, Brazil, Argentina, Colombia, UAE, Saudi Arabia, South Africa, Israel, Turkey

  • Rapid growth of global gaming industry and expanding player base is the driving factor this market.

The Game Development Software market vendors should focus on grabbing business opportunities from the Component segment as it accounted for the largest market share in the base year.