Gas Insulated Transformer Market Analysis APAC, North America, Europe, South America, Middle East and Africa - China, US, India, Germany, UK - Size and Forecast 2024-2028

Gas Insulated Transformer Market Analysis APAC, North America, Europe, South America, Middle East and Africa - China, US, India, Germany, UK - Size and Forecast 2024-2028

Published: Aug 2024 168 Pages SKU: IRTNTR75790

Market Overview at a Glance

$895.2 Mn
Market Opportunity
4.36%
CAGR
4.11
YoY growth 2023-2024(%)

Gas Insulated Transformer Market Size 2024-2028 

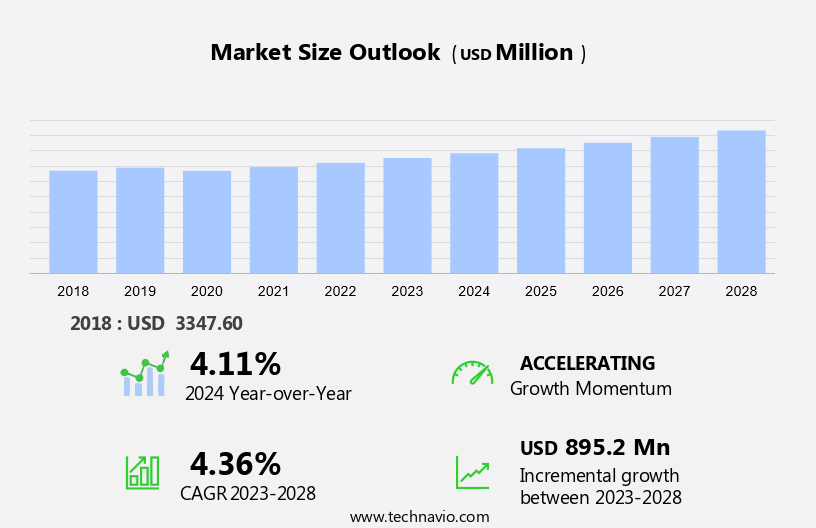
The gas insulated transformer market size is forecast to increase by USD 895.2 billion at a CAGR of 4.36% between 2023 and 2028. The Global Gas Insulated Transformer (GIT) market is experiencing significant growth due to industrialization and urbanization driving the need for reliable and efficient power infrastructure. Renewable energy sources, such as solar photovoltaic and wind power, are increasingly integrated into the electricity market, leading to grid stability challenges. Grid connection projects for renewable energy are on the rise, necessitating the adoption of advanced power transmission solutions like GITs. Fossil fuels continue to dominate the energy landscape, but the focus on reducing carbon emissions is pushing the market for GITs. companies are forming strategic alliances to expand their reach and offer competitive pricing. However, the price volatility of raw materials and the risk of oil leakage pose challenges to market growth. In summary, the GIT market is witnessing growth due to the increasing demand for grid stability, renewable energy integration, and power infrastructure development, while facing challenges from raw material price fluctuations and safety concerns.

Gas Insulated Transformer Market Size

 Request Free Sample

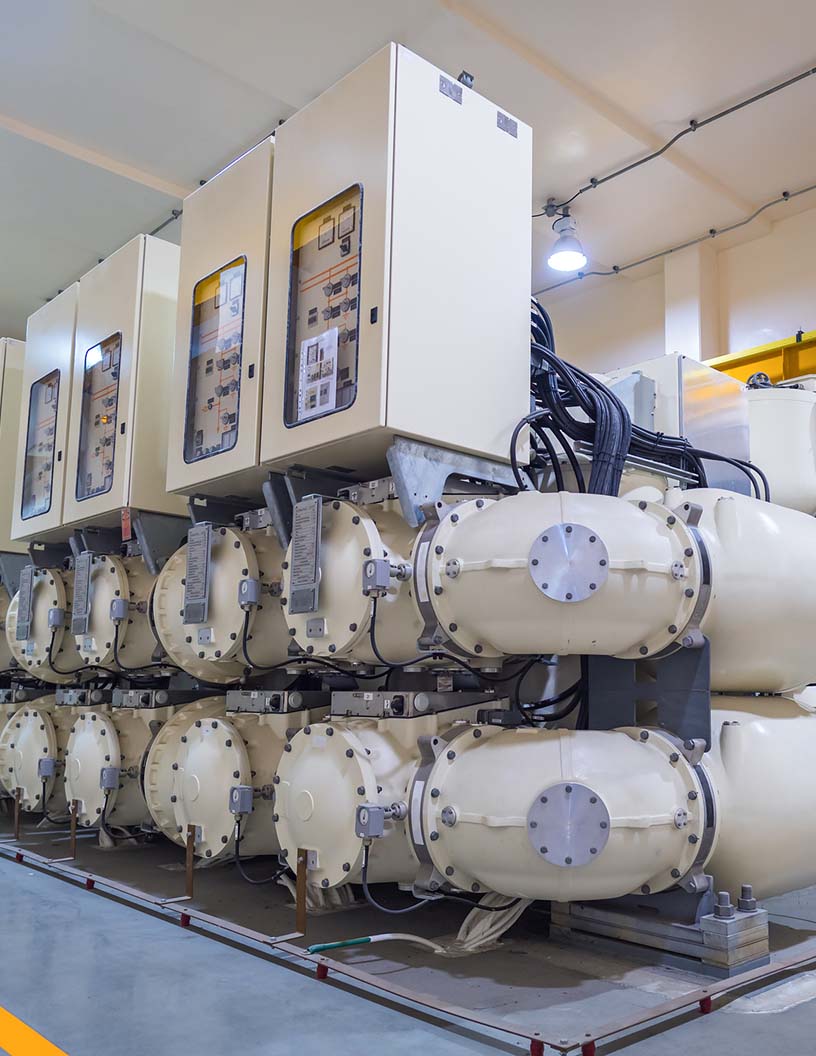
Gas insulated transformers (GITs) have gained significant traction in the power transmission industry due to their advantages over conventional transformers. These transformers are utilized extensively in various applications, including hydropower, urban areas, infrastructure substations, and offshore substations. Hydropower projects require reliable and efficient power transmission solutions to transport electricity generated from water sources. GITs offer an ideal solution due to their compact size, high voltage capacity, and minimal environmental impact. Infrastructure substations in urban areas also benefit from the installation of GITs due to their indoor installation capabilities, which help reduce the footprint and improve safety.

Offshore substations, which are essential for transmitting power from wind and solar energy sources, also rely on GITs for their high voltage capacity and compact size. The use of GITs in offshore substations reduces the need for frequent oil checks and oil replacement, minimizing the risk of oil leaks and associated environmental hazards. Conventional transformers, which use oil as insulation, require regular oil checks and replacement, leading to increased electrical network expenditure. GITs, on the other hand, use a gas insulation system, eliminating the need for oil and reducing the risk of oil leakage. The shift towards renewable energy generation from solar and wind sources has led to increased investments in smart grid technologies.

GITs play a crucial role in smart grid infrastructure by enabling the integration of renewable energy sources into the electrical network. They also support smart metering technology and instrument transformers, which are essential components of a smart grid. Equipment manufacturing companies specializing in GITs have optimized their supply chain to cater to the growing demand for these transformers. Medium voltage, high voltage, and extra high voltage GITs are available in the market to cater to various power transmission requirements. In conclusion, gas insulated transformers have become an indispensable component in power transmission infrastructure, particularly in hydropower, urban areas, infrastructure substations, and offshore substations.

Market Segmentation

The market research report provides comprehensive data (region-wise segment analysis), with forecasts and estimates in "USD million" for the period 2024-2028, as well as historical data from 2018-2022 for the following segments.

  • Installation Sites
    • Indoor
    • Outdoor
  • End-user
    • Utility
    • Industrial
    • Commercial
  • Geography
    • APAC
      • China
      • India
    • North America
      • US
    • Europe
      • Germany
      • UK
    • South America
    • Middle East and Africa

By Installation Sites Insights

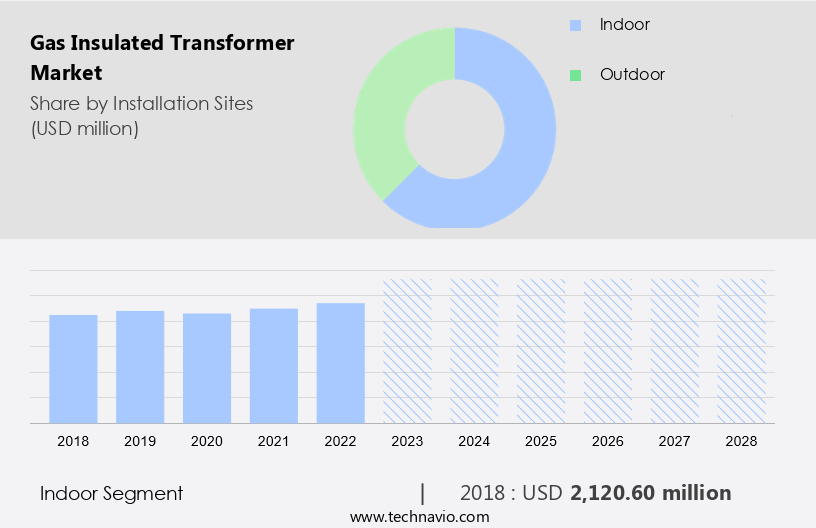
The indoor segment is estimated to witness significant growth during the forecast period. Transformers play a vital role in ensuring a continuous and dependable power supply in the electricity network. Among various types of transformers, gas insulated transformers (GITs) have gained popularity due to their fire safety and environmental benefits. The market for GITs is witnessing significant growth, particularly in emerging economies in Asia Pacific, the Middle East, and Africa.

Further, the expansion of new grid networks in these regions, driven by increasing populations and economic growth, is fueling the demand for power and distribution transformers, including GITs. Utilities and commercial and industrial end-users, such as hydropower substations, are installing these transformers for indoor and outdoor applications to meet their energy needs. Smart grid investments, renewable energy generation, and the integration of smart metering technology are also contributing to the growth of the GIT market. Key equipment manufacturing companies are focusing on innovation and technology to cater to the increasing demand for these transformers.

Gas Insulated Transformer Market Size

Get a glance at the market share of various segments Request Free Sample

The indoor segment accounted for USD 2.12 billion in 2018 and showed a gradual increase during the forecast period.

Regional Insights

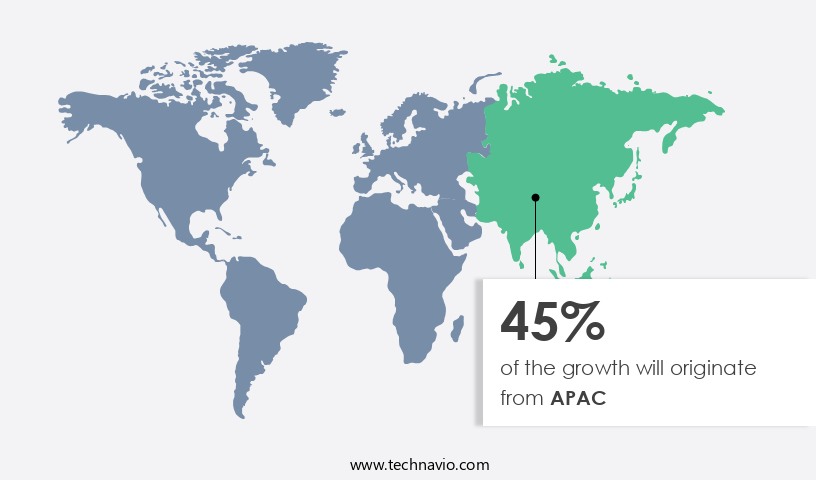
APAC is estimated to contribute 45% to the growth of the global market during the forecast period. Technavio's analysts have elaborately explained the regional trends and drivers that shape the market during the forecast period.

Gas Insulated Transformer Market Share by Geography

For more insights on the market share of various regions Request Free Sample

The Gas Insulated Transformer (GIT) market in Asia Pacific (APAC) is witnessing significant growth due to the increasing electricity demand in the region. The rapid urbanization and enhancement of living standards in major countries like China and India are driving up electricity consumption. To meet this demand, private players are entering the utility sector, leading to increased competition and lower electricity prices. This continuous power supply is essential for the region's improving economic conditions. Technological advancements in GITs, such as the use of Sodium Hexafluoride (SF6) as an insulating gas, contribute to safety improvements and higher power density. However, concerns regarding the environmental impact of SF6, a toxic compound, remain.

Additionally, the global warming problem is another environmental issue that the power sector must address. Coal and natural gas remain the primary energy sources for electricity generation in APAC. The availability of cheap labor and raw materials in the region further boosts the power generation sector's growth. In the context of single-phase circuits and wiring, safety is a critical concern. Therefore, GITs' adoption is increasing due to their compact size, high voltage capacity, and reduced environmental footprint.

Our researchers analyzed the data with 2023 as the base year, along with the key drivers, trends, and challenges. A holistic analysis of drivers will help companies refine their marketing strategies to gain a competitive advantage.

Market Driver

The growth of transmission and distribution (T&D) of power is the key driver of the market. In the global energy sector, Gas Insulated Transformers (GITs) are gaining significant traction due to their advantages over conventional transformers. These non-combustible, non-explosive, non-flammable, and non-polluting transformers are increasingly being adopted in various applications, including hydropower, infrastructure substations, and offshore substations.

The Asia Pacific region, particularly countries like China, Thailand, the Philippines, Vietnam, India, Japan, and Australia, is witnessing substantial economic growth and industrial development, leading to a wave in demand for power. Urbanization, driven by population growth and rising disposable incomes, is resulting in increased construction activities in the residential and commercial sectors. India, with one of the fastest urbanization rates, and China, experiencing a similar trend, are major contributors to this growth.

Market Trends

Increasing strategic alliances between companies is the upcoming trend in the market. The market is experiencing significant growth due to the ongoing industrialization and urbanization worldwide. With the increasing focus on renewable energy sources such as solar photovoltaic and wind power, the need for grid stability and electricity market restructuring is becoming increasingly important. companies in this market are responding by collaborating on innovative solutions to reduce carbon emissions and improve power infrastructure. For instance, Toshiba and Meidensha Corp. Have been working together since 2020 to develop gas-insulated switchgear for 72kV/84kV using a natural-origin gas that does not contain SF6. Due to the rising demand for environmentally friendly products, they have accelerated the development and commercialization of this technology.

Similarly, Siemens and Mitsubishi signed an MoU in June 2021 to explore the feasibility of developing high voltage switching systems with low global warming potential, using clean air instead of greenhouse gases for insulation. The increasing number of grid connection projects and the shift towards solar and wind energy are driving up electrical network expenditure, making it essential for companies to provide eco-friendly and cost-effective solutions.

Market Challenge

The price volatility of raw materials is a key challenge affecting the market growth. In densely populated areas, power consumption continues to rise, necessitating the need for reliable and efficient power solutions from power companies. Reforms in the energy sector have led to a focus on reducing power losses and promoting the use of environmentally friendly equipment. Insulation plays a crucial role in this regard, with gas-insulated transformers (GITs) gaining popularity due to their superior insulation properties. GITs use sulfur hexafluoride (SF6) gas as an insulating medium, which is non-toxic, non-flammable, and has a low global warming potential. However, SF6 leaks can contribute to greenhouse gas emissions, with each kilogram of SF6 having a CO2 equivalent of around 23,500 kg.

Therefore, efforts are being made to minimize SF6 leaks and recycle the gas. Power plants are a significant consumer of transformers, and the prices of raw materials used in their production, such as steel, copper, and aluminum, can significantly impact the cost of transformers. These materials are used in various forms, including extrusions, castings, powder metal, metal sheets and strips, forging billets, bar stock, and plastic pellets. The prices of these raw materials can fluctuate due to macroeconomic factors and geopolitical reasons, making it essential for power companies to closely monitor these trends. Given the importance of transformers in the power sector, it is crucial for power companies to ensure their procurement processes are efficient and cost-effective.

Exclusive Customer Landscape

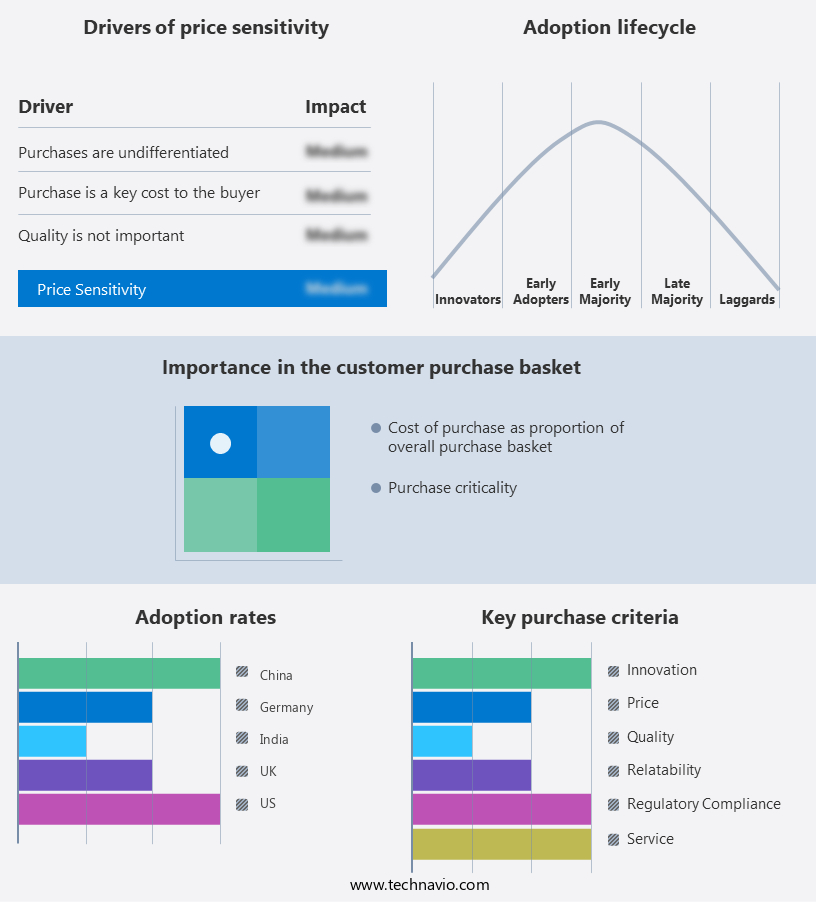
The market forecasting report includes the adoption lifecycle of the market, covering from the innovator's stage to the laggard's stage. It focuses on adoption rates in different regions based on penetration. Furthermore, the report also includes key purchase criteria and drivers of price sensitivity to help companies evaluate and develop their market growth analysis strategies.

Gas Insulated Transformer Market Share by Geography

 Customer Landscape

Key Companies & Market Insights

Companies are implementing various strategies, such as strategic alliances, partnerships, mergers and acquisitions, geographical expansion, and product/service launches, to enhance their presence in the market.

ABB Ltd. - The company offers gas insulated transformers such as ELK transformers.

The market research and growth report includes detailed analyses of the competitive landscape of the market and information about key companies, including:

  • Arteche Lantegi Elkartea SA
  • China XD Group Co. Ltd.
  • Fuji Electric Co. Ltd.
  • General Electric Co.
  • Hyosung Heavy Industries Corp.
  • Kanohar Electricals Ltd.
  • KharkovEnergoPribor Ltd.
  • Kirloskar Electric Co. Ltd.
  • Meidensha Corp.
  • Mitsubishi Electric Corp.
  • NISSIN ELECTRIC Co. Ltd.
  • Schneider Electric SE
  • Shihlin Electric and Engineering Corp.
  • Siemens AG
  • Takaoka Toko Co. Ltd
  • Tatung Co.
  • Toshiba Corp.
  • Yangzhou Xinyuan Electric Co. Ltd
  • Zhejiang CHINT Electrics Co. Ltd.

Qualitative and quantitative analysis of companies has been conducted to help clients understand the wider business environment as well as the strengths and weaknesses of key market players. Data is qualitatively analyzed to categorize companies as pure play, category-focused, industry-focused, and diversified; it is quantitatively analyzed to categorize companies as dominant, leading, strong, tentative, and weak.

Research Analyst Overview

Gas Insulated Transformers (GITs) have gained significant attention in the power industry due to their advantages over conventional transformers. These transformers are particularly suitable for hydropower, infrastructure substations, and offshore substations, as they offer several benefits over their oil-filled counterparts. GITs are non-combustible, non-explosive, and non-flammable, making them ideal for use in densely populated areas and near buildings, lakes, and rivers. They are also non-polluting, eliminating the need for oil checks and replacement, and reducing the risk of oil leaks and associated environmental issues. Power companies are increasingly investing in GITs due to their role in grid stability and the growing demand for renewable energy. The electricity market is undergoing restructuring, with a focus on clean energy projects, smart grid investments, and reducing greenhouse gas emissions. GITs are an essential component of this transition, with their compact design, ease of operation, and assurance of safety. GITs are suitable for various applications, including indoor and outdoor installations, medium voltage, high voltage, and extra-high voltage applications.

Additionally, GITs play a vital role in this transition, with their ability to reduce power losses, improve safety, and minimize the carbon footprint of power generation and transmission. Technological developments in GIT manufacturing and design have led to improvements in power density, ease of maintenance, and rapid urbanization. However, the high initial cost and the availability of raw materials and cheap labor in some regions remain challenges for the market. In conclusion, Gas Insulated Transformers are a critical component of the power industry's transition towards a cleaner, more sustainable, and efficient electrical energy supply. Their advantages, including non-polluting, non-flammable, and non-explosive properties, make them an ideal solution for various applications, from hydropower and infrastructure substations to offshore wind farms and data centers. With the growing demand for renewable energy and the need to reduce greenhouse gas emissions, the market for Gas Insulated Transformers is expected to continue its growth trajectory.

Market Scope

Report Coverage

Details

Page number

168

Base year

2023

Historic period

2018-2022

Forecast period

2024-2028

Growth momentum & CAGR

Accelerate at a CAGR of 4.36%

Market Growth 2024-2028

USD 895.2 million

Market structure

Fragmented

YoY growth 2023-2024(%)

4.11

Regional analysis

APAC, North America, Europe, South America, and Middle East and Africa

Performing market contribution

APAC at 45%

Key countries

China, US, India, Germany, and UK

Competitive landscape

Leading Companies, Market Positioning of Companies, Competitive Strategies, and Industry Risks

Key companies profiled

ABB Ltd., Arteche Lantegi Elkartea SA, China XD Group Co. Ltd., Fuji Electric Co. Ltd., General Electric Co., Hyosung Heavy Industries Corp., Kanohar Electricals Ltd., KharkovEnergoPribor Ltd., Kirloskar Electric Co. Ltd., Meidensha Corp., Mitsubishi Electric Corp., NISSIN ELECTRIC Co. Ltd., Schneider Electric SE, Shihlin Electric and Engineering Corp., Siemens AG, Takaoka Toko Co. Ltd, Tatung Co., Toshiba Corp., Yangzhou Xinyuan Electric Co. Ltd, and Zhejiang CHINT Electrics Co. Ltd.

Market dynamics

Parent market analysis, market growth inducers and obstacles, market forecast, fast-growing and slow-growing segment analysis, COVID-19 impact and recovery analysis and future consumer dynamics, market condition analysis for the forecast period

Customization purview

If our market report has not included the data that you are looking for, you can reach out to our analysts and get segments customized.

Request Free Sample

What are the Key Data Covered in this Market Research and Growth Report?

  • CAGR of the market during the forecast period
  • Detailed information on factors that will drive the market growth and forecasting between 2024 and 2028
  • Precise estimation of the size of the market  and its contribution of the market in focus to the parent market
  • Accurate predictions about upcoming market growth and trends and changes in consumer behaviour
  • Growth of the market across APAC, North America, Europe, South America, and Middle East and Africa
  • Thorough analysis of the market's competitive landscape and detailed information about companies
  • Comprehensive analysis of factors that will challenge the growth of market companies

We can help! Our analysts can customize this market research report to meet your requirements. Get in touch

1 Executive Summary

  • 1.1 Market overview
    • Executive Summary - Chart on Market Overview
    • Executive Summary - Data Table on Market Overview
    • Executive Summary - Chart on Global Market Characteristics
    • Executive Summary - Chart on Market by Geography
    • Executive Summary - Chart on Market Segmentation by Installation Sites
    • Executive Summary - Chart on Market Segmentation by End-user
    • Executive Summary - Chart on Incremental Growth
    • Executive Summary - Data Table on Incremental Growth
    • Executive Summary - Chart on Company Market Positioning

2 Market Landscape

  • 2.1 Market ecosystem
    • Parent Market
    • Data Table on - Parent Market
  • 2.2 Market characteristics
    • Market characteristics analysis
  • 2.3 Value chain analysis
    • Value Chain Analysis

3 Market Sizing

  • 3.1 Market definition
    • Offerings of companies included in the market definition
  • 3.2 Market segment analysis
    • Market segments
  • 3.3 Market size 2023
    • 3.4 Market outlook: Forecast for 2023-2028
      • Chart on Global - Market size and forecast 2023-2028 ($ million)
      • Data Table on Global - Market size and forecast 2023-2028 ($ million)
      • Chart on Global Market: Year-over-year growth 2023-2028 (%)
      • Data Table on Global Market: Year-over-year growth 2023-2028 (%)

    4 Historic Market Size

    • 4.1 Global Gas Insulated Transformer Market 2018 - 2022
      • Historic Market Size - Data Table on Global Gas Insulated Transformer Market 2018 - 2022 ($ million)
    • 4.2 Installation Sites segment analysis 2018 - 2022
      • Historic Market Size - Installation Sites Segment 2018 - 2022 ($ million)
    • 4.3 End-user segment analysis 2018 - 2022
      • Historic Market Size - End-user Segment 2018 - 2022 ($ million)
    • 4.4 Geography segment analysis 2018 - 2022
      • Historic Market Size - Geography Segment 2018 - 2022 ($ million)
    • 4.5 Country segment analysis 2018 - 2022
      • Historic Market Size - Country Segment 2018 - 2022 ($ million)

    5 Five Forces Analysis

    • 5.1 Five forces summary
      • Five forces analysis - Comparison between 2023 and 2028
    • 5.2 Bargaining power of buyers
      • Bargaining power of buyers - Impact of key factors 2023 and 2028
    • 5.3 Bargaining power of suppliers
      • Bargaining power of suppliers - Impact of key factors in 2023 and 2028
    • 5.4 Threat of new entrants
      • Threat of new entrants - Impact of key factors in 2023 and 2028
    • 5.5 Threat of substitutes
      • Threat of substitutes - Impact of key factors in 2023 and 2028
    • 5.6 Threat of rivalry
      • Threat of rivalry - Impact of key factors in 2023 and 2028
    • 5.7 Market condition
      • Chart on Market condition - Five forces 2023 and 2028

    6 Market Segmentation by Installation Sites

    • 6.1 Market segments
      • Chart on Installation Sites - Market share 2023-2028 (%)
      • Data Table on Installation Sites - Market share 2023-2028 (%)
    • 6.2 Comparison by Installation Sites
      • Chart on Comparison by Installation Sites
      • Data Table on Comparison by Installation Sites
    • 6.3 Indoor - Market size and forecast 2023-2028
      • Chart on Indoor - Market size and forecast 2023-2028 ($ million)
      • Data Table on Indoor - Market size and forecast 2023-2028 ($ million)
      • Chart on Indoor - Year-over-year growth 2023-2028 (%)
      • Data Table on Indoor - Year-over-year growth 2023-2028 (%)
    • 6.4 Outdoor - Market size and forecast 2023-2028
      • Chart on Outdoor - Market size and forecast 2023-2028 ($ million)
      • Data Table on Outdoor - Market size and forecast 2023-2028 ($ million)
      • Chart on Outdoor - Year-over-year growth 2023-2028 (%)
      • Data Table on Outdoor - Year-over-year growth 2023-2028 (%)
    • 6.5 Market opportunity by Installation Sites
      • Market opportunity by Installation Sites ($ million)
      • Data Table on Market opportunity by Installation Sites ($ million)

    7 Market Segmentation by End-user

    • 7.1 Market segments
      • Chart on End-user - Market share 2023-2028 (%)
      • Data Table on End-user - Market share 2023-2028 (%)
    • 7.2 Comparison by End-user
      • Chart on Comparison by End-user
      • Data Table on Comparison by End-user
    • 7.3 Utility - Market size and forecast 2023-2028
      • Chart on Utility - Market size and forecast 2023-2028 ($ million)
      • Data Table on Utility - Market size and forecast 2023-2028 ($ million)
      • Chart on Utility - Year-over-year growth 2023-2028 (%)
      • Data Table on Utility - Year-over-year growth 2023-2028 (%)
    • 7.4 Industrial - Market size and forecast 2023-2028
      • Chart on Industrial - Market size and forecast 2023-2028 ($ million)
      • Data Table on Industrial - Market size and forecast 2023-2028 ($ million)
      • Chart on Industrial - Year-over-year growth 2023-2028 (%)
      • Data Table on Industrial - Year-over-year growth 2023-2028 (%)
    • 7.5 Commercial - Market size and forecast 2023-2028
      • Chart on Commercial - Market size and forecast 2023-2028 ($ million)
      • Data Table on Commercial - Market size and forecast 2023-2028 ($ million)
      • Chart on Commercial - Year-over-year growth 2023-2028 (%)
      • Data Table on Commercial - Year-over-year growth 2023-2028 (%)
    • 7.6 Market opportunity by End-user
      • Market opportunity by End-user ($ million)
      • Data Table on Market opportunity by End-user ($ million)

    8 Customer Landscape

    • 8.1 Customer landscape overview
      • Analysis of price sensitivity, lifecycle, customer purchase basket, adoption rates, and purchase criteria

    9 Geographic Landscape

    • 9.1 Geographic segmentation
      • Chart on Market share by geography 2023-2028 (%)
      • Data Table on Market share by geography 2023-2028 (%)
    • 9.2 Geographic comparison
      • Chart on Geographic comparison
      • Data Table on Geographic comparison
    • 9.3 APAC - Market size and forecast 2023-2028
      • Chart on APAC - Market size and forecast 2023-2028 ($ million)
      • Data Table on APAC - Market size and forecast 2023-2028 ($ million)
      • Chart on APAC - Year-over-year growth 2023-2028 (%)
      • Data Table on APAC - Year-over-year growth 2023-2028 (%)
    • 9.4 North America - Market size and forecast 2023-2028
      • Chart on North America - Market size and forecast 2023-2028 ($ million)
      • Data Table on North America - Market size and forecast 2023-2028 ($ million)
      • Chart on North America - Year-over-year growth 2023-2028 (%)
      • Data Table on North America - Year-over-year growth 2023-2028 (%)
    • 9.5 Europe - Market size and forecast 2023-2028
      • Chart on Europe - Market size and forecast 2023-2028 ($ million)
      • Data Table on Europe - Market size and forecast 2023-2028 ($ million)
      • Chart on Europe - Year-over-year growth 2023-2028 (%)
      • Data Table on Europe - Year-over-year growth 2023-2028 (%)
    • 9.6 South America - Market size and forecast 2023-2028
      • Chart on South America - Market size and forecast 2023-2028 ($ million)
      • Data Table on South America - Market size and forecast 2023-2028 ($ million)
      • Chart on South America - Year-over-year growth 2023-2028 (%)
      • Data Table on South America - Year-over-year growth 2023-2028 (%)
    • 9.7 Middle East and Africa - Market size and forecast 2023-2028
      • Chart on Middle East and Africa - Market size and forecast 2023-2028 ($ million)
      • Data Table on Middle East and Africa - Market size and forecast 2023-2028 ($ million)
      • Chart on Middle East and Africa - Year-over-year growth 2023-2028 (%)
      • Data Table on Middle East and Africa - Year-over-year growth 2023-2028 (%)
    • 9.8 China - Market size and forecast 2023-2028
      • Chart on China - Market size and forecast 2023-2028 ($ million)
      • Data Table on China - Market size and forecast 2023-2028 ($ million)
      • Chart on China - Year-over-year growth 2023-2028 (%)
      • Data Table on China - Year-over-year growth 2023-2028 (%)
    • 9.9 US - Market size and forecast 2023-2028
      • Chart on US - Market size and forecast 2023-2028 ($ million)
      • Data Table on US - Market size and forecast 2023-2028 ($ million)
      • Chart on US - Year-over-year growth 2023-2028 (%)
      • Data Table on US - Year-over-year growth 2023-2028 (%)
    • 9.10 India - Market size and forecast 2023-2028
      • Chart on India - Market size and forecast 2023-2028 ($ million)
      • Data Table on India - Market size and forecast 2023-2028 ($ million)
      • Chart on India - Year-over-year growth 2023-2028 (%)
      • Data Table on India - Year-over-year growth 2023-2028 (%)
    • 9.11 Germany - Market size and forecast 2023-2028
      • Chart on Germany - Market size and forecast 2023-2028 ($ million)
      • Data Table on Germany - Market size and forecast 2023-2028 ($ million)
      • Chart on Germany - Year-over-year growth 2023-2028 (%)
      • Data Table on Germany - Year-over-year growth 2023-2028 (%)
    • 9.12 UK - Market size and forecast 2023-2028
      • Chart on UK - Market size and forecast 2023-2028 ($ million)
      • Data Table on UK - Market size and forecast 2023-2028 ($ million)
      • Chart on UK - Year-over-year growth 2023-2028 (%)
      • Data Table on UK - Year-over-year growth 2023-2028 (%)
    • 9.13 Market opportunity by geography
      • Market opportunity by geography ($ million)
      • Data Tables on Market opportunity by geography ($ million)

    10 Drivers, Challenges, and Opportunity/Restraints

    • 10.1 Market drivers
      • 10.2 Market challenges
        • 10.3 Impact of drivers and challenges
          • Impact of drivers and challenges in 2023 and 2028
        • 10.4 Market opportunities/restraints

          11 Competitive Landscape

          • 11.1 Overview
            • 11.2 Competitive Landscape
              • Overview on criticality of inputs and factors of differentiation
            • 11.3 Landscape disruption
              • Overview on factors of disruption
            • 11.4 Industry risks
              • Impact of key risks on business

            12 Competitive Analysis

            • 12.1 Companies profiled
              • Companies covered
            • 12.2 Market positioning of companies
              • Matrix on companies position and classification
            • 12.3 ABB Ltd.
              • ABB Ltd. - Overview
              • ABB Ltd. - Business segments
              • ABB Ltd. - Key news
              • ABB Ltd. - Key offerings
              • ABB Ltd. - Segment focus
            • 12.4 Arteche Lantegi Elkartea SA
              • Arteche Lantegi Elkartea SA - Overview
              • Arteche Lantegi Elkartea SA - Product / Service
              • Arteche Lantegi Elkartea SA - Key offerings
            • 12.5 China XD Group Co. Ltd.
              • China XD Group Co. Ltd. - Overview
              • China XD Group Co. Ltd. - Product / Service
              • China XD Group Co. Ltd. - Key offerings
            • 12.6 Fuji Electric Co. Ltd.
              • Fuji Electric Co. Ltd. - Overview
              • Fuji Electric Co. Ltd. - Business segments
              • Fuji Electric Co. Ltd. - Key news
              • Fuji Electric Co. Ltd. - Key offerings
              • Fuji Electric Co. Ltd. - Segment focus
            • 12.7 General Electric Co.
              • General Electric Co. - Overview
              • General Electric Co. - Business segments
              • General Electric Co. - Key news
              • General Electric Co. - Key offerings
              • General Electric Co. - Segment focus
            • 12.8 Hyosung Heavy Industries Corp.
              • Hyosung Heavy Industries Corp. - Overview
              • Hyosung Heavy Industries Corp. - Product / Service
              • Hyosung Heavy Industries Corp. - Key offerings
            • 12.9 Meidensha Corp.
              • Meidensha Corp. - Overview
              • Meidensha Corp. - Business segments
              • Meidensha Corp. - Key news
              • Meidensha Corp. - Key offerings
              • Meidensha Corp. - Segment focus
            • 12.10 Mitsubishi Electric Corp.
              • Mitsubishi Electric Corp. - Overview
              • Mitsubishi Electric Corp. - Business segments
              • Mitsubishi Electric Corp. - Key news
              • Mitsubishi Electric Corp. - Key offerings
              • Mitsubishi Electric Corp. - Segment focus
            • 12.11 NISSIN ELECTRIC Co. Ltd.
              • NISSIN ELECTRIC Co. Ltd. - Overview
              • NISSIN ELECTRIC Co. Ltd. - Business segments
              • NISSIN ELECTRIC Co. Ltd. - Key offerings
              • NISSIN ELECTRIC Co. Ltd. - Segment focus
            • 12.12 Schneider Electric SE
              • Schneider Electric SE - Overview
              • Schneider Electric SE - Business segments
              • Schneider Electric SE - Key news
              • Schneider Electric SE - Key offerings
              • Schneider Electric SE - Segment focus
            • 12.13 Shihlin Electric and Engineering Corp.
              • Shihlin Electric and Engineering Corp. - Overview
              • Shihlin Electric and Engineering Corp. - Business segments
              • Shihlin Electric and Engineering Corp. - Key offerings
              • Shihlin Electric and Engineering Corp. - Segment focus
            • 12.14 Siemens AG
              • Siemens AG - Overview
              • Siemens AG - Business segments
              • Siemens AG - Key news
              • Siemens AG - Key offerings
              • Siemens AG - Segment focus
            • 12.15 Takaoka Toko Co. Ltd
              • Takaoka Toko Co. Ltd - Overview
              • Takaoka Toko Co. Ltd - Product / Service
              • Takaoka Toko Co. Ltd - Key offerings
            • 12.16 Toshiba Corp.
              • Toshiba Corp. - Overview
              • Toshiba Corp. - Business segments
              • Toshiba Corp. - Key news
              • Toshiba Corp. - Key offerings
              • Toshiba Corp. - Segment focus
            • 12.17 Zhejiang CHINT Electrics Co. Ltd.
              • Zhejiang CHINT Electrics Co. Ltd. - Overview
              • Zhejiang CHINT Electrics Co. Ltd. - Product / Service
              • Zhejiang CHINT Electrics Co. Ltd. - Key offerings

            13 Appendix

            • 13.1 Scope of the report
              • 13.2 Inclusions and exclusions checklist
                • Inclusions checklist
                • Exclusions checklist
              • 13.3 Currency conversion rates for US$
                • Currency conversion rates for US$
              • 13.4 Research methodology
                • Research methodology
              • 13.5 Data procurement
                • Information sources
              • 13.6 Data validation
                • Data validation
              • 13.7 Validation techniques employed for market sizing
                • Validation techniques employed for market sizing
              • 13.8 Data synthesis
                • Data synthesis
              • 13.9 360 degree market analysis
                • 360 degree market analysis
              • 13.10 List of abbreviations
                • List of abbreviations

              Research Methodology

              Technavio presents a detailed picture of the market by way of study, synthesis, and summation of data from multiple sources. The analysts have presented the various facets of the market with a particular focus on identifying the key industry influencers. The data thus presented is comprehensive, reliable, and the result of extensive research, both primary and secondary.

              INFORMATION SOURCES

              Primary sources

              • Manufacturers and suppliers
              • Channel partners
              • Industry experts
              • Strategic decision makers

              Secondary sources

              • Industry journals and periodicals
              • Government data
              • Financial reports of key industry players
              • Historical data
              • Press releases

              DATA ANALYSIS

              Data Synthesis

              • Collation of data
              • Estimation of key figures
              • Analysis of derived insights

              Data Validation

              • Triangulation with data models
              • Reference against proprietary databases
              • Corroboration with industry experts

              REPORT WRITING

              Qualitative

              • Market drivers
              • Market challenges
              • Market trends
              • Five forces analysis

              Quantitative

              • Market size and forecast
              • Market segmentation
              • Geographical insights
              • Competitive landscape

              Interested in this report?

              Get your sample now to see our research methodology and insights!

              Download Now

              Frequently Asked Questions

              Gas Insulated Transformer market growth will increase by $ 895.2 mn during 2024-2028.

              The Gas Insulated Transformer market is expected to grow at a CAGR of 4.36% during 2024-2028.

              Gas Insulated Transformer market is segmented by Installation Sites( Indoor, Outdoor) End-user( Utility, Industrial, Commercial)

              ABB Ltd., Arteche Lantegi Elkartea SA, China XD Group Co. Ltd., Fuji Electric Co. Ltd., General Electric Co., Hyosung Heavy Industries Corp., Kanohar Electricals Ltd., KharkovEnergoPribor Ltd., Kirloskar Electric Co. Ltd., Meidensha Corp., Mitsubishi Electric Corp., NISSIN ELECTRIC Co. Ltd., Schneider Electric SE, Shihlin Electric and Engineering Corp., Siemens AG, Takaoka Toko Co. Ltd, Tatung Co., Toshiba Corp., Yangzhou Xinyuan Electric Co. Ltd, Zhejiang CHINT Electrics Co. Ltd. are a few of the key vendors in the Gas Insulated Transformer market.

              APAC will register the highest growth rate of 45% among the other regions. Therefore, the Gas Insulated Transformer market in APAC is expected to garner significant business opportunities for the vendors during the forecast period.

              China, US, India, Germany, UK

              • Growth of transmission and distribution (T and D) of powerAPAC is one of the key regions undergoing several changes in the market in focus. Countries is the driving factor this market.
              • including China is the driving factor this market.
              • Thailand is the driving factor this market.
              • the Philippines is the driving factor this market.
              • Vietnam is the driving factor this market.
              • India is the driving factor this market.
              • Japan is the driving factor this market.
              • and Australia is the driving factor this market.
              • are experiencing substantial economic growth is the driving factor this market.
              • along with industrial development and commercialization. Therefore is the driving factor this market.
              • the demand for power in these countries is also increasing. Industrial development has a direct impact on urbanization is the driving factor this market.
              • which results in increased construction activities in the residential and commercial sectors. India has one of the fastest rates of urban development worldwide due to rapid population growth and rising disposable incomes. China is also experiencing a similar urbanization trend.Among the other world regions is the driving factor this market.
              • South America is experiencing major economic changes is the driving factor this market.
              • especially in Brazil is the driving factor this market.
              • which is among the top developing nations globally. In addition to industrial development and rapid urbanization is the driving factor this market.
              • the manufacturing sector in these regions is exhibiting considerable potential for growth. Thus is the driving factor this market.
              • these countries will become hubs for the major manufacturing industries for automotive and others is the driving factor this market.
              • which will lead to high demand for electricity. This has spurred activity among private and public power sector companies in many regions to commence projects of planned network capacity expansion. These projects show that there is a significant increase in electricity demand. As these projects entail the setting up of several power stations is the driving factor this market.
              • substations is the driving factor this market.
              • and distribution stations is the driving factor this market.
              • they will result in the need for more step-up and step-down power transformers. In addition is the driving factor this market.
              • the high safety features of gas-insulated transformers due to the presence of Sulfur hexafluoride (SF 6) increases its adoption in power distribution. Such factors will boost the growth of the global insulated transformer market during the forecast period. is the driving factor this market.

              The Gas Insulated Transformer market vendors should focus on grabbing business opportunities from the Indoor segment as it accounted for the largest market share in the base year.