Gel Packs Market Analysis, Size, and Forecast 2026-2030: North America (US, Canada, and Mexico), Europe (Germany, UK, and France), APAC (China, Japan, and India), South America (Brazil), Middle East and Africa (South Africa, UAE, and Saudi Arabia), Asia, Rest of World (ROW)

Gel Packs Market Analysis, Size, and Forecast 2026-2030:
North America (US, Canada, and Mexico), Europe (Germany, UK, and France), APAC (China, Japan, and India), South America (Brazil), Middle East and Africa (South Africa, UAE, and Saudi Arabia), Asia, Rest of World (ROW)

Published: Apr 2026 293 Pages SKU: IRTNTR81415

Market Overview at a Glance

$141.23 Mn
Market Opportunity
5.9%
CAGR 2025 - 2030
29.7%
Asia Growth
$248.44 Mn
Reusable gel packs segment 2024

Gel Packs Market Size 2026-2030

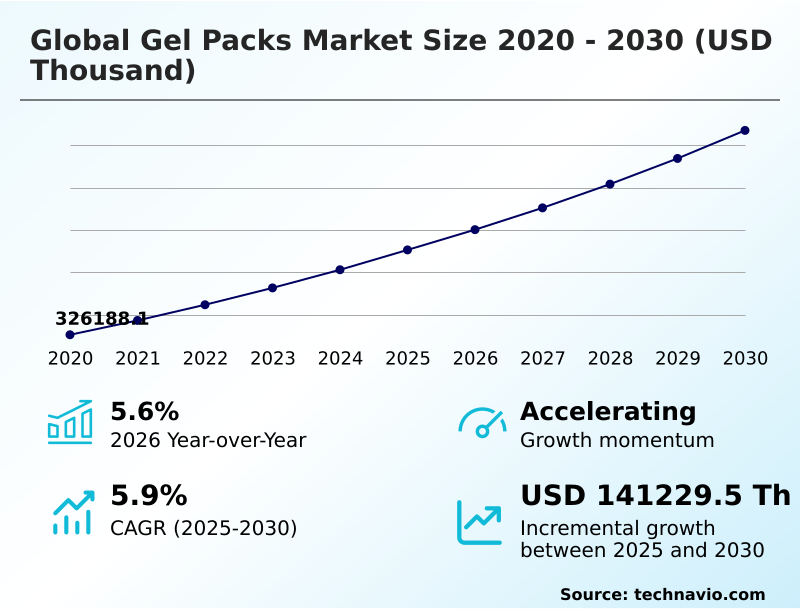
The gel packs market size is valued to increase by USD 141.23 million, at a CAGR of 5.9% from 2025 to 2030. Exponential expansion of global cold chain logistics network will drive the gel packs market.

Major Market Trends & Insights

  • Asia dominated the market and accounted for a 29.7% growth during the forecast period.
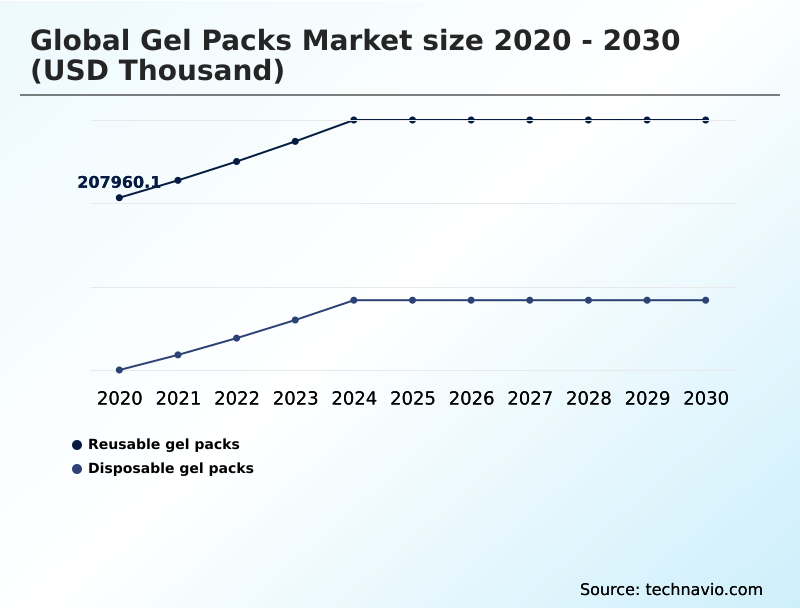
  • By Product - Reusable gel packs segment was valued at USD 248.44 million in 2024
  • By End-user - Hospitals and clinics segment accounted for the largest market revenue share in 2024

Market Size & Forecast

  • Market Opportunities:
  • Market Future Opportunities: USD 141.23 million
  • CAGR from 2025 to 2030 : 5.9%

Market Summary

  • The Gel Packs Market is expanding, driven by the critical need for reliable thermal management solution options in global supply chains. The growth of cold chain logistics for biopharmaceutical transport and perishable goods shipment is a primary catalyst.
  • In a typical business scenario, a pharmaceutical distributor uses temperature controlled packaging with a passive cooling system to ensure a vaccine's efficacy during last mile delivery cooling. The rise of e-commerce, especially online grocery and meal kits, has further amplified demand.
  • However, the market faces challenges from the environmental impact of disposable products, leading to a strong push for eco friendly coolant materials and the adoption of the reusable cold pack. Innovations in phase change material and biodegradable gel pack technology are crucial for navigating regulatory pressures and meeting consumer expectations for sustainability.
  • Ensuring thermal excursion prevention remains the core value proposition, balancing performance with environmental responsibility. The industry's evolution is shaped by the need for advanced solutions like the non toxic gel formulation to ensure safety and compliance.

What will be the Size of the Gel Packs Market during the forecast period?

Get Key Insights on Market Forecast (PDF) Request Free Sample

How is the Gel Packs Market Segmented?

The gel packs industry research report provides comprehensive data (region-wise segment analysis), with forecasts and estimates in "USD thousand" for the period 2026-2030, as well as historical data from 2020-2024 for the following segments.

  • Product
    • Reusable gel packs
    • Disposable gel packs
  • End-user
    • Hospitals and clinics
    • Households
    • Pharmaceutical companies
    • Food processing companies
    • Sports organizations
  • Type
    • Water-based
    • Polymer-based
    • Phase change materials
  • Geography
    • North America
      • US
      • Canada
      • Mexico
    • Europe
      • Germany
      • UK
      • France
    • Asia
    • Rest of World (ROW)

By Product Insights

The reusable gel packs segment is estimated to witness significant growth during the forecast period.

The reusable gel packs segment is driven by sustainability and cost-reduction goals. Organizations are adopting reusable gel pack models within closed loop supply chain systems. These high performance thermal packaging solutions feature a puncture resistant pouch designed for durability.

The reverse logistics framework is essential for collecting, cleaning, and redeploying these assets. Strict thermal sanitization protocols ensure hygiene for reuse in industrial thermal packaging. Formulations often use sodium polyacrylate for enhanced thermal properties.

This commitment to reusable systems, now accounting for nearly 59% of B2B deployments, reduces waste and long-term costs, requiring robust thermal packaging validation to ensure consistent performance over multiple cycles.

The reusable cold pack is central to this circular economy model.

Request Free Sample

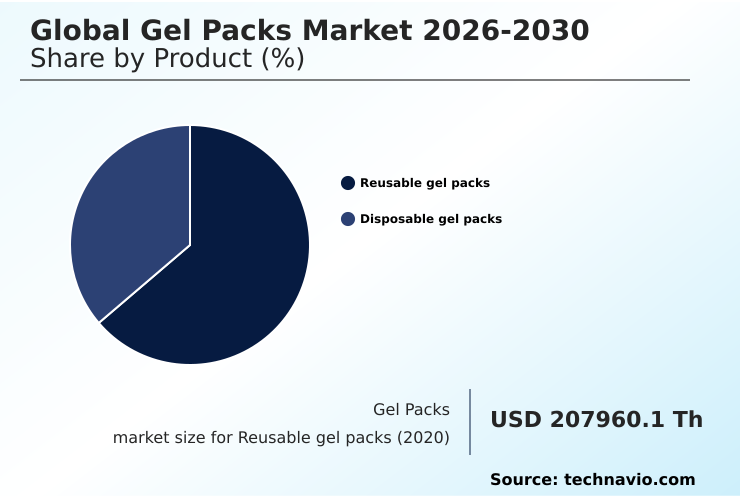
The Reusable gel packs segment was valued at USD 248.44 million in 2024 and showed a gradual increase during the forecast period.

Request Free Sample

Regional Analysis

Asia is estimated to contribute 29.7% to the growth of the global market during the forecast period.Technavio’s analysts have elaborately explained the regional trends and drivers that shape the market during the forecast period.

See How Gel Packs Market Demand is Rising in Asia Request Free Sample

Geographically, the market presents a tale of varied maturity and growth. While North America remains a significant market, its expansion rate of 4.7% is surpassed by Asia's dynamic growth at 7.4%.

Asia is projected to contribute nearly 30% of the market's incremental growth, driven by rapid industrialization and infrastructure modernization. In this region, the demand for an effective passive cooling system for perishable goods shipment is immense.

A reliable thermal management solution is essential for both domestic consumption and exports. The integrity of biopharmaceutical transport and clinical trial logistics across vast distances relies on high-performance temperature controlled packaging and insulated shipping container configurations.

The use of a medical grade cold pack and food grade refrigerant is standard, with post-harvest cooling becoming a critical application.

Logistics providers are increasingly using insulated shipping liners and flexible refrigerant pads for medical specimen transport to ensure temperature assurance packaging compliance.

Market Dynamics

Our researchers analyzed the data with 2025 as the base year, along with the key drivers, trends, and challenges. A holistic analysis of drivers will help companies refine their marketing strategies to gain a competitive advantage.

  • Strategic decision-making in the gel packs market requires a comprehensive evaluation of multiple operational and financial factors. Enterprises are constantly assessing the cost of reusable vs disposable gel packs, where the long-term savings of reusable cold packs in closed loop logistics must be weighed against the convenience of single-use items.
  • For food shippers, the question of sodium polyacrylate safety in food shipping is paramount, necessitating the use of certified food grade non toxic gel packs. The choice between water-based vs polymer-based gel packs often depends on the required gel pack material for extended cooling.
  • In high-stakes pharmaceutical logistics, the focus shifts to phase change materials for vaccine transport and ensuring rigorous temperature validation for pharmaceutical shipments. Adopting these advanced materials for thermal packaging for biologics can improve thermal compliance by over 20% compared to standard water-based solutions.
  • The rise of e-commerce brings challenges like finding the best gel packs for shipping frozen food and creating consumer-friendly instructions on how to recycle gel ice packs. Logistics managers also need to understand gel pack regulations for air freight and follow best practices for gel pack freezing to optimize every insulated container and gel pack combination.
  • For specific applications, biodegradable gel packs for meal kits address sustainability concerns, while gel pack use in sports medicine caters to a niche therapeutic market. The overarching goal is always maintaining cold chain with passive cooling by preventing thermal excursions during shipping and leveraging innovations like smart sensors in cold chain packaging and eco-friendly alternatives to traditional gel packs.

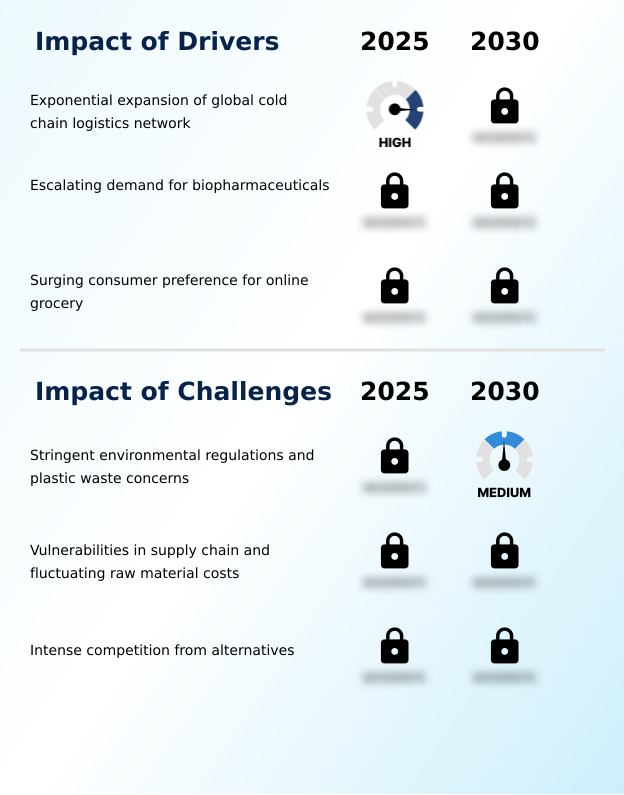
What are the key market drivers leading to the rise in the adoption of Gel Packs Industry?

  • The exponential expansion of the global cold chain logistics network, essential for transporting temperature-sensitive goods, is a key driver propelling market growth.

  • Market expansion is fueled by the relentless growth in sectors requiring strict temperature control.
  • The boom in e-commerce has made last mile delivery cooling a standard logistical requirement, with gel pack for food delivery and gel pack for meal kits seeing a 45% surge in shipment volumes in some urban markets.
  • Simultaneously, the life sciences industry depends on robust pharmaceutical cold chain solutions for biopharmaceutical transport and direct to patient shipping.
  • The movement of temperature sensitive freight is now a critical function of global cold chain logistics, driving demand for reliable and validated solutions for every perishable goods shipment.

What are the market trends shaping the Gel Packs Industry?

  • The market is witnessing a significant transition toward eco-friendly and biodegradable gel pack materials. This shift is driven by increasing environmental awareness and stringent global regulations.

  • The market is pivoting toward intelligent and sustainable solutions. The integration of smart temperature monitoring through an embedded temperature monitoring sensor is a key trend, allowing for real-time cold chain breach identification and reducing product spoilage by up to 30%. This phase change material technology is critical for high-value goods.
  • Concurrently, there is a massive industry shift toward eco-friendly packaging materials and biodegradable coolant materials. The development of the biodegradable gel pack, a key eco friendly coolant, addresses stringent environmental regulations. Advanced phase change material formulations are also being designed for reusability, further enhancing their appeal.

What challenges does the Gel Packs Industry face during its growth?

  • Stringent environmental regulations and pervasive concerns over plastic waste from single-use products present a key challenge affecting the industry's growth trajectory.

  • Navigating environmental regulations and raw material volatility presents significant challenges. The industry is under pressure to find viable disposable gel pack alternatives and educate consumers on proper gel pack disposal methods to mitigate plastic waste. The reliance on petrochemicals for superabsorbent polymer components creates price instability.
  • While water based refrigerant options are more sustainable, their performance may not match synthetic counterparts. The refrigerant gel composition must be a non toxic gel formulation to ensure safety, yet also cost-effective.
  • Furthermore, competition from a dry ice substitute for certain applications requires continuous innovation to prevent thermal excursion prevention failures and maintain market share, with the transition to compliant materials increasing costs by up to 20%.

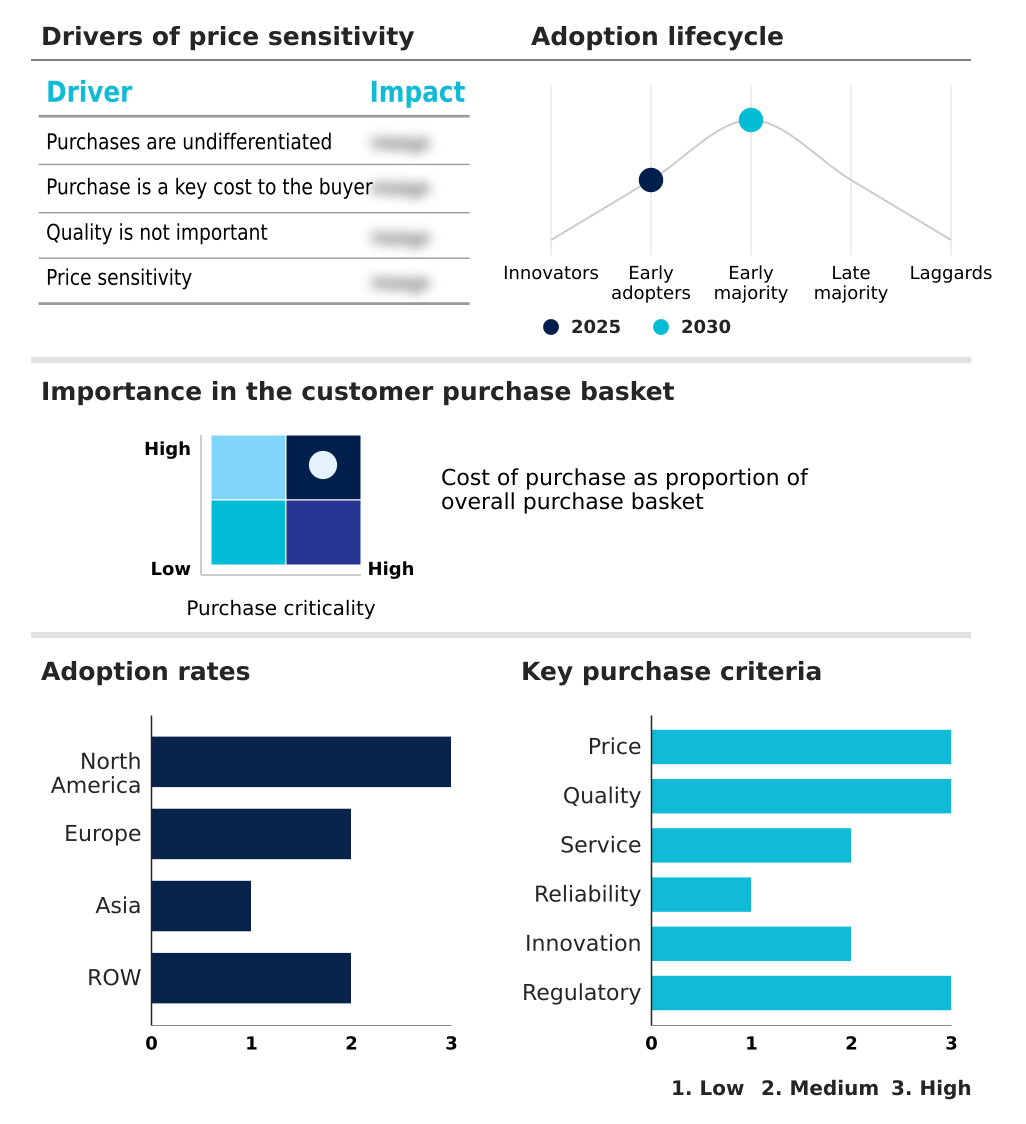
Exclusive Technavio Analysis on Customer Landscape

The gel packs market forecasting report includes the adoption lifecycle of the market, covering from the innovator’s stage to the laggard’s stage. It focuses on adoption rates in different regions based on penetration. Furthermore, the gel packs market report also includes key purchase criteria and drivers of price sensitivity to help companies evaluate and develop their market growth analysis strategies.

Customer Landscape of Gel Packs Industry

Competitive Landscape

Companies are implementing various strategies, such as strategic alliances, gel packs market forecast, partnerships, mergers and acquisitions, geographical expansion, and product/service launches, to enhance their presence in the industry.

3M Co. - Delivers specialized hot and cold therapy gel packs, designed for both disposable and reusable applications within clinical and hospital settings to meet patient care requirements.

The industry research and growth report includes detailed analyses of the competitive landscape of the market and information about key companies, including:

  • 3M Co.
  • Cardinal Health Inc.
  • Cold Chain Technologies LLC
  • Cryopak
  • Insulated Products Corp.
  • Intelsius
  • Medline Inc.
  • Nordic Cold Chain Solutions
  • Nortech Laboratories Inc.
  • Peli BioThermal LLC
  • Pelton Shepherd Industries
  • Polar Tech Industries
  • Rapid Aid
  • Sealed Air Corp.
  • Sofrigam
  • Softbox Systems Ltd.
  • TECHNI ICE
  • Tempack Packaging Solutions SL
  • ThermaFreeze Products Corp
  • ThermoSafe

Qualitative and quantitative analysis of companies has been conducted to help clients understand the wider business environment as well as the strengths and weaknesses of key industry players. Data is qualitatively analyzed to categorize companies as pure play, category-focused, industry-focused, and diversified; it is quantitatively analyzed to categorize companies as dominant, leading, strong, tentative, and weak.

Recent Development and News in Gel packs market

  • In September 2024, a leading packaging firm launched a new line of fully compostable gel packs, utilizing a plant-based polymer that degrades in industrial facilities within 90 days, addressing plastic waste concerns.
  • In January 2025, UPS completed the acquisition of healthcare cold-chain logistics providers Frigo-Trans and BPL, strengthening its capabilities in temperature-controlled transportation and storage services across Europe.
  • In March 2025, a thermal technology specialist announced a partnership with an IoT provider to embed real-time temperature monitoring sensors into its pharmaceutical-grade gel packs for enhanced supply chain visibility.
  • In May 2025, a major manufacturer opened a new large-scale facility in Southeast Asia to cater to the escalating demand from the region's rapidly growing online grocery and meal-kit delivery sectors.

Dive into Technavio’s robust research methodology, blending expert interviews, extensive data synthesis, and validated models for unparalleled Gel Packs Market insights. See full methodology.

Market Scope
Page number 293
Base year 2025
Historic period 2020-2024
Forecast period 2026-2030
Growth momentum & CAGR Accelerate at a CAGR of 5.9%
Market growth 2026-2030 USD 141229.5 thousand
Market structure Fragmented
YoY growth 2025-2026(%) 5.6%
Key countries US, Canada, Mexico, Germany, UK, France, Italy, Spain, The Netherlands, Russia, China, Japan, India, South Korea, Indonesia, Thailand, Singapore, Australia, Brazil, South Africa, UAE, Saudi Arabia and Turkey
Competitive landscape Leading Companies, Market Positioning of Companies, Competitive Strategies, and Industry Risks

Request Free Sample

Research Analyst Overview

  • The gel packs market is evolving beyond simple refrigerants into a critical component of modern cold chain logistics. Its trajectory is shaped by the dual pressures of performance and sustainability, influencing boardroom decisions on capital expenditure and compliance strategy.
  • The industry's core function, thermal excursion prevention, is now achieved through sophisticated thermal management solution offerings, from a simple water based refrigerant to advanced phase change material technology. For instance, integrated systems using a temperature monitoring sensor have demonstrated a reduction in product loss by up to 40%.
  • The demand for temperature controlled packaging is surging, driven by biopharmaceutical transport, clinical trial logistics, and perishable goods shipment for e-commerce. This necessitates a diverse product portfolio, including the reusable cold pack for a closed loop supply chain, the biodegradable gel pack as an eco friendly coolant, and the specialized medical grade cold pack.
  • Material science is key, with the superabsorbent polymer sodium polyacrylate enabling extended performance in a non toxic gel formulation. Products must feature a puncture resistant pouch and undergo thermal packaging validation to meet industry standards.
  • Ultimately, whether it's for last mile delivery cooling, an insulated shipping container, or a passive cooling system, manufacturers must deliver reliable and compliant solutions, including safe food grade refrigerant options.

What are the Key Data Covered in this Gel Packs Market Research and Growth Report?

  • What is the expected growth of the Gel Packs Market between 2026 and 2030?

    • USD 141.23 million, at a CAGR of 5.9%

  • What segmentation does the market report cover?

    • The report is segmented by Product (Reusable gel packs, and Disposable gel packs), End-user (Hospitals and clinics, Households, Pharmaceutical companies, Food processing companies, and Sports organizations), Type (Water-based, Polymer-based, and Phase change materials) and Geography (North America, Europe, Asia, Rest of World (ROW))

  • Which regions are analyzed in the report?

    • North America, Europe, Asia and Rest of World (ROW)

  • What are the key growth drivers and market challenges?

    • Exponential expansion of global cold chain logistics network , Stringent environmental regulations and plastic waste concerns

  • Who are the major players in the Gel Packs Market?

    • 3M Co., Cardinal Health Inc., Cold Chain Technologies LLC, Cryopak, Insulated Products Corp., Intelsius, Medline Inc., Nordic Cold Chain Solutions, Nortech Laboratories Inc., Peli BioThermal LLC, Pelton Shepherd Industries, Polar Tech Industries, Rapid Aid, Sealed Air Corp., Sofrigam, Softbox Systems Ltd., TECHNI ICE, Tempack Packaging Solutions SL, ThermaFreeze Products Corp and ThermoSafe

Market Research Insights

  • The market's momentum is driven by the convergence of pharmaceutical needs and e-commerce logistics. The adoption of specialized pharmaceutical cold chain solutions has improved delivery success rates by over 15%, while the proliferation of gel pack for meal kits has expanded the consumer-facing segment.
  • A key dynamic is the integration of smart temperature monitoring, which can reduce spoilage from cold chain breaches by up to 25%. Demand for eco-friendly packaging materials is also reshaping manufacturing, with sustainable options gaining significant traction. Reusable models now account for nearly 59% of deployments in B2B logistics, reflecting a strategic shift toward operational efficiency and waste reduction.

We can help! Our analysts can customize this gel packs market research report to meet your requirements.

Get in touch

1. Executive Summary

1.1 Market overview

Executive Summary - Chart on Market Overview
Executive Summary - Data Table on Market Overview
Executive Summary - Chart on Global Market Characteristics
Executive Summary - Chart on Market by Geography
Executive Summary - Chart on Market Segmentation by Product
Executive Summary - Chart on Market Segmentation by End-user
Executive Summary - Chart on Market Segmentation by Type
Executive Summary - Chart on Incremental Growth
Executive Summary - Data Table on Incremental Growth
Executive Summary - Chart on Company Market Positioning

2. Technavio Analysis

2.1 Analysis of price sensitivity, lifecycle, customer purchase basket, adoption rates, and purchase criteria

2.2 Criticality of inputs and Factors of differentiation

Chart on Overview on criticality of inputs and factors of differentiation

2.3 Factors of disruption

Chart on Overview on factors of disruption

2.4 Impact of drivers and challenges

Chart on Impact of drivers and challenges in 2025 and 2030

3. Market Landscape

3.1 Market ecosystem

Chart on Parent Market
Data Table on - Parent Market

3.2 Market characteristics

Chart on Market characteristics analysis

3.3 Value chain analysis

Chart on Value chain analysis

4. Market Sizing

4.1 Market definition

Data Table on Offerings of companies included in the market definition

4.2 Market segment analysis

Market segments

4.3 Market size 2025

4.4 Market outlook: Forecast for 2025-2030

Chart on Global - Market size and forecast 2025-2030 ($ thousand)
Data Table on Global - Market size and forecast 2025-2030 ($ thousand)
Chart on Global Market: Year-over-year growth 2025-2030 (%)
Data Table on Global Market: Year-over-year growth 2025-2030 (%)

5. Historic Market Size

5.1 Global Gel Packs Market 2020 - 2024

Historic Market Size - Data Table on Global Gel Packs Market 2020 - 2024 ($ thousand)

5.2 Product segment analysis 2020 - 2024

Historic Market Size - Product Segment 2020 - 2024 ($ thousand)

5.3 End-user segment analysis 2020 - 2024

Historic Market Size - End-user Segment 2020 - 2024 ($ thousand)

5.4 Type segment analysis 2020 - 2024

Historic Market Size - Type Segment 2020 - 2024 ($ thousand)

5.5 Geography segment analysis 2020 - 2024

Historic Market Size - Geography Segment 2020 - 2024 ($ thousand)

5.6 Country segment analysis 2020 - 2024

Historic Market Size - Country Segment 2020 - 2024 ($ thousand)

6. Qualitative Analysis

6.1 Impact of AI on Global Gel Packs Market

6.2 Impact of Geopolitical Conflicts on Global Gel Packs Market

7. Five Forces Analysis

7.1 Five forces summary

Five forces analysis - Comparison between 2025 and 2030

7.2 Bargaining power of buyers

Bargaining power of buyers - Impact of key factors 2025 and 2030

7.3 Bargaining power of suppliers

Bargaining power of suppliers - Impact of key factors in 2025 and 2030

7.4 Threat of new entrants

Threat of new entrants - Impact of key factors in 2025 and 2030

7.5 Threat of substitutes

Threat of substitutes - Impact of key factors in 2025 and 2030

7.6 Threat of rivalry

Threat of rivalry - Impact of key factors in 2025 and 2030

7.7 Market condition

Chart on Market condition - Five forces 2025 and 2030

8. Market Segmentation by Product

8.1 Market segments

Chart on Product - Market share 2025-2030 (%)
Data Table on Product - Market share 2025-2030 (%)

8.2 Comparison by Product

Chart on Comparison by Product
Data Table on Comparison by Product

8.3 Reusable gel packs - Market size and forecast 2025-2030

Chart on Reusable gel packs - Market size and forecast 2025-2030 ($ thousand)
Data Table on Reusable gel packs - Market size and forecast 2025-2030 ($ thousand)
Chart on Reusable gel packs - Year-over-year growth 2025-2030 (%)
Data Table on Reusable gel packs - Year-over-year growth 2025-2030 (%)

8.4 Disposable gel packs - Market size and forecast 2025-2030

Chart on Disposable gel packs - Market size and forecast 2025-2030 ($ thousand)
Data Table on Disposable gel packs - Market size and forecast 2025-2030 ($ thousand)
Chart on Disposable gel packs - Year-over-year growth 2025-2030 (%)
Data Table on Disposable gel packs - Year-over-year growth 2025-2030 (%)

8.5 Market opportunity by Product

Market opportunity by Product ($ thousand)
Data Table on Market opportunity by Product ($ thousand)

9. Market Segmentation by End-user

9.1 Market segments

Chart on End-user - Market share 2025-2030 (%)
Data Table on End-user - Market share 2025-2030 (%)

9.2 Comparison by End-user

Chart on Comparison by End-user
Data Table on Comparison by End-user

9.3 Hospitals and clinics - Market size and forecast 2025-2030

Chart on Hospitals and clinics - Market size and forecast 2025-2030 ($ thousand)
Data Table on Hospitals and clinics - Market size and forecast 2025-2030 ($ thousand)
Chart on Hospitals and clinics - Year-over-year growth 2025-2030 (%)
Data Table on Hospitals and clinics - Year-over-year growth 2025-2030 (%)

9.4 Households - Market size and forecast 2025-2030

Chart on Households - Market size and forecast 2025-2030 ($ thousand)
Data Table on Households - Market size and forecast 2025-2030 ($ thousand)
Chart on Households - Year-over-year growth 2025-2030 (%)
Data Table on Households - Year-over-year growth 2025-2030 (%)

9.5 Pharmaceutical companies - Market size and forecast 2025-2030

Chart on Pharmaceutical companies - Market size and forecast 2025-2030 ($ thousand)
Data Table on Pharmaceutical companies - Market size and forecast 2025-2030 ($ thousand)
Chart on Pharmaceutical companies - Year-over-year growth 2025-2030 (%)
Data Table on Pharmaceutical companies - Year-over-year growth 2025-2030 (%)

9.6 Food processing companies - Market size and forecast 2025-2030

Chart on Food processing companies - Market size and forecast 2025-2030 ($ thousand)
Data Table on Food processing companies - Market size and forecast 2025-2030 ($ thousand)
Chart on Food processing companies - Year-over-year growth 2025-2030 (%)
Data Table on Food processing companies - Year-over-year growth 2025-2030 (%)

9.7 Sports organizations - Market size and forecast 2025-2030

Chart on Sports organizations - Market size and forecast 2025-2030 ($ thousand)
Data Table on Sports organizations - Market size and forecast 2025-2030 ($ thousand)
Chart on Sports organizations - Year-over-year growth 2025-2030 (%)
Data Table on Sports organizations - Year-over-year growth 2025-2030 (%)

9.8 Market opportunity by End-user

Market opportunity by End-user ($ thousand)
Data Table on Market opportunity by End-user ($ thousand)

10. Market Segmentation by Type

10.1 Market segments

Chart on Type - Market share 2025-2030 (%)
Data Table on Type - Market share 2025-2030 (%)

10.2 Comparison by Type

Chart on Comparison by Type
Data Table on Comparison by Type

10.3 Water-based - Market size and forecast 2025-2030

Chart on Water-based - Market size and forecast 2025-2030 ($ thousand)
Data Table on Water-based - Market size and forecast 2025-2030 ($ thousand)
Chart on Water-based - Year-over-year growth 2025-2030 (%)
Data Table on Water-based - Year-over-year growth 2025-2030 (%)

10.4 Polymer-based - Market size and forecast 2025-2030

Chart on Polymer-based - Market size and forecast 2025-2030 ($ thousand)
Data Table on Polymer-based - Market size and forecast 2025-2030 ($ thousand)
Chart on Polymer-based - Year-over-year growth 2025-2030 (%)
Data Table on Polymer-based - Year-over-year growth 2025-2030 (%)

10.5 Phase change materials - Market size and forecast 2025-2030

Chart on Phase change materials - Market size and forecast 2025-2030 ($ thousand)
Data Table on Phase change materials - Market size and forecast 2025-2030 ($ thousand)
Chart on Phase change materials - Year-over-year growth 2025-2030 (%)
Data Table on Phase change materials - Year-over-year growth 2025-2030 (%)

10.6 Market opportunity by Type

Market opportunity by Type ($ thousand)
Data Table on Market opportunity by Type ($ thousand)

11. Customer Landscape

11.1 Customer landscape overview

Analysis of price sensitivity, lifecycle, customer purchase basket, adoption rates, and purchase criteria

12. Geographic Landscape

12.1 Geographic segmentation

Chart on Market share by geography 2025-2030 (%)
Data Table on Market share by geography 2025-2030 (%)

12.2 Geographic comparison

Chart on Geographic comparison
Data Table on Geographic comparison

12.3 North America - Market size and forecast 2025-2030

Chart on North America - Market size and forecast 2025-2030 ($ thousand)
Data Table on North America - Market size and forecast 2025-2030 ($ thousand)
Chart on North America - Year-over-year growth 2025-2030 (%)
Data Table on North America - Year-over-year growth 2025-2030 (%)
Chart on Regional Comparison - North America
Data Table on Regional Comparison - North America

12.3.1 US - Market size and forecast 2025-2030

Chart on US - Market size and forecast 2025-2030 ($ thousand)
Data Table on US - Market size and forecast 2025-2030 ($ thousand)
Chart on US - Year-over-year growth 2025-2030 (%)
Data Table on US - Year-over-year growth 2025-2030 (%)

12.3.2 Canada - Market size and forecast 2025-2030

Chart on Canada - Market size and forecast 2025-2030 ($ thousand)
Data Table on Canada - Market size and forecast 2025-2030 ($ thousand)
Chart on Canada - Year-over-year growth 2025-2030 (%)
Data Table on Canada - Year-over-year growth 2025-2030 (%)

12.3.3 Mexico - Market size and forecast 2025-2030

Chart on Mexico - Market size and forecast 2025-2030 ($ thousand)
Data Table on Mexico - Market size and forecast 2025-2030 ($ thousand)
Chart on Mexico - Year-over-year growth 2025-2030 (%)
Data Table on Mexico - Year-over-year growth 2025-2030 (%)

12.4 Europe - Market size and forecast 2025-2030

Chart on Europe - Market size and forecast 2025-2030 ($ thousand)
Data Table on Europe - Market size and forecast 2025-2030 ($ thousand)
Chart on Europe - Year-over-year growth 2025-2030 (%)
Data Table on Europe - Year-over-year growth 2025-2030 (%)
Chart on Regional Comparison - Europe
Data Table on Regional Comparison - Europe

12.4.1 Germany - Market size and forecast 2025-2030

Chart on Germany - Market size and forecast 2025-2030 ($ thousand)
Data Table on Germany - Market size and forecast 2025-2030 ($ thousand)
Chart on Germany - Year-over-year growth 2025-2030 (%)
Data Table on Germany - Year-over-year growth 2025-2030 (%)

12.4.2 UK - Market size and forecast 2025-2030

Chart on UK - Market size and forecast 2025-2030 ($ thousand)
Data Table on UK - Market size and forecast 2025-2030 ($ thousand)
Chart on UK - Year-over-year growth 2025-2030 (%)
Data Table on UK - Year-over-year growth 2025-2030 (%)

12.4.3 France - Market size and forecast 2025-2030

Chart on France - Market size and forecast 2025-2030 ($ thousand)
Data Table on France - Market size and forecast 2025-2030 ($ thousand)
Chart on France - Year-over-year growth 2025-2030 (%)
Data Table on France - Year-over-year growth 2025-2030 (%)

12.4.4 Italy - Market size and forecast 2025-2030

Chart on Italy - Market size and forecast 2025-2030 ($ thousand)
Data Table on Italy - Market size and forecast 2025-2030 ($ thousand)
Chart on Italy - Year-over-year growth 2025-2030 (%)
Data Table on Italy - Year-over-year growth 2025-2030 (%)

12.4.5 Spain - Market size and forecast 2025-2030

Chart on Spain - Market size and forecast 2025-2030 ($ thousand)
Data Table on Spain - Market size and forecast 2025-2030 ($ thousand)
Chart on Spain - Year-over-year growth 2025-2030 (%)
Data Table on Spain - Year-over-year growth 2025-2030 (%)

12.4.6 The Netherlands - Market size and forecast 2025-2030

Chart on The Netherlands - Market size and forecast 2025-2030 ($ thousand)
Data Table on The Netherlands - Market size and forecast 2025-2030 ($ thousand)
Chart on The Netherlands - Year-over-year growth 2025-2030 (%)
Data Table on The Netherlands - Year-over-year growth 2025-2030 (%)

12.4.7 Russia - Market size and forecast 2025-2030

Chart on Russia - Market size and forecast 2025-2030 ($ thousand)
Data Table on Russia - Market size and forecast 2025-2030 ($ thousand)
Chart on Russia - Year-over-year growth 2025-2030 (%)
Data Table on Russia - Year-over-year growth 2025-2030 (%)

12.5 Asia - Market size and forecast 2025-2030

Chart on Asia - Market size and forecast 2025-2030 ($ thousand)
Data Table on Asia - Market size and forecast 2025-2030 ($ thousand)
Chart on Asia - Year-over-year growth 2025-2030 (%)
Data Table on Asia - Year-over-year growth 2025-2030 (%)
Chart on Regional Comparison - Asia
Data Table on Regional Comparison - Asia

12.5.1 China - Market size and forecast 2025-2030

Chart on China - Market size and forecast 2025-2030 ($ thousand)
Data Table on China - Market size and forecast 2025-2030 ($ thousand)
Chart on China - Year-over-year growth 2025-2030 (%)
Data Table on China - Year-over-year growth 2025-2030 (%)

12.5.2 Japan - Market size and forecast 2025-2030

Chart on Japan - Market size and forecast 2025-2030 ($ thousand)
Data Table on Japan - Market size and forecast 2025-2030 ($ thousand)
Chart on Japan - Year-over-year growth 2025-2030 (%)
Data Table on Japan - Year-over-year growth 2025-2030 (%)

12.5.3 India - Market size and forecast 2025-2030

Chart on India - Market size and forecast 2025-2030 ($ thousand)
Data Table on India - Market size and forecast 2025-2030 ($ thousand)
Chart on India - Year-over-year growth 2025-2030 (%)
Data Table on India - Year-over-year growth 2025-2030 (%)

12.5.4 South Korea - Market size and forecast 2025-2030

Chart on South Korea - Market size and forecast 2025-2030 ($ thousand)
Data Table on South Korea - Market size and forecast 2025-2030 ($ thousand)
Chart on South Korea - Year-over-year growth 2025-2030 (%)
Data Table on South Korea - Year-over-year growth 2025-2030 (%)

12.5.5 Indonesia - Market size and forecast 2025-2030

Chart on Indonesia - Market size and forecast 2025-2030 ($ thousand)
Data Table on Indonesia - Market size and forecast 2025-2030 ($ thousand)
Chart on Indonesia - Year-over-year growth 2025-2030 (%)
Data Table on Indonesia - Year-over-year growth 2025-2030 (%)

12.5.6 Thailand - Market size and forecast 2025-2030

Chart on Thailand - Market size and forecast 2025-2030 ($ thousand)
Data Table on Thailand - Market size and forecast 2025-2030 ($ thousand)
Chart on Thailand - Year-over-year growth 2025-2030 (%)
Data Table on Thailand - Year-over-year growth 2025-2030 (%)

12.5.7 Singapore - Market size and forecast 2025-2030

Chart on Singapore - Market size and forecast 2025-2030 ($ thousand)
Data Table on Singapore - Market size and forecast 2025-2030 ($ thousand)
Chart on Singapore - Year-over-year growth 2025-2030 (%)
Data Table on Singapore - Year-over-year growth 2025-2030 (%)

12.6 Rest of World (ROW) - Market size and forecast 2025-2030

Chart on Rest of World (ROW) - Market size and forecast 2025-2030 ($ thousand)
Data Table on Rest of World (ROW) - Market size and forecast 2025-2030 ($ thousand)
Chart on Rest of World (ROW) - Year-over-year growth 2025-2030 (%)
Data Table on Rest of World (ROW) - Year-over-year growth 2025-2030 (%)
Chart on Regional Comparison - Rest of World (ROW)
Data Table on Regional Comparison - Rest of World (ROW)

12.6.1 Australia - Market size and forecast 2025-2030

Chart on Australia - Market size and forecast 2025-2030 ($ thousand)
Data Table on Australia - Market size and forecast 2025-2030 ($ thousand)
Chart on Australia - Year-over-year growth 2025-2030 (%)
Data Table on Australia - Year-over-year growth 2025-2030 (%)

12.6.2 Brazil - Market size and forecast 2025-2030

Chart on Brazil - Market size and forecast 2025-2030 ($ thousand)
Data Table on Brazil - Market size and forecast 2025-2030 ($ thousand)
Chart on Brazil - Year-over-year growth 2025-2030 (%)
Data Table on Brazil - Year-over-year growth 2025-2030 (%)

12.6.3 South Africa - Market size and forecast 2025-2030

Chart on South Africa - Market size and forecast 2025-2030 ($ thousand)
Data Table on South Africa - Market size and forecast 2025-2030 ($ thousand)
Chart on South Africa - Year-over-year growth 2025-2030 (%)
Data Table on South Africa - Year-over-year growth 2025-2030 (%)

12.6.4 UAE - Market size and forecast 2025-2030

Chart on UAE - Market size and forecast 2025-2030 ($ thousand)
Data Table on UAE - Market size and forecast 2025-2030 ($ thousand)
Chart on UAE - Year-over-year growth 2025-2030 (%)
Data Table on UAE - Year-over-year growth 2025-2030 (%)

12.6.5 Saudi Arabia - Market size and forecast 2025-2030

Chart on Saudi Arabia - Market size and forecast 2025-2030 ($ thousand)
Data Table on Saudi Arabia - Market size and forecast 2025-2030 ($ thousand)
Chart on Saudi Arabia - Year-over-year growth 2025-2030 (%)
Data Table on Saudi Arabia - Year-over-year growth 2025-2030 (%)

12.6.6 Turkey - Market size and forecast 2025-2030

Chart on Turkey - Market size and forecast 2025-2030 ($ thousand)
Data Table on Turkey - Market size and forecast 2025-2030 ($ thousand)
Chart on Turkey - Year-over-year growth 2025-2030 (%)
Data Table on Turkey - Year-over-year growth 2025-2030 (%)

12.7 Market opportunity by geography

Market opportunity by geography ($ thousand)
Data Tables on Market opportunity by geography ($ thousand)

13. Drivers, Challenges, and Opportunity

13.1 Market drivers

Exponential expansion of global cold chain logistics network
Escalating demand for biopharmaceuticals
Surging consumer preference for online grocery

13.2 Market challenges

Stringent environmental regulations and plastic waste concerns
Vulnerabilities in supply chain and fluctuating raw material costs
Intense competition from alternatives

13.3 Impact of drivers and challenges

Impact of drivers and challenges in 2025 and 2030

13.4 Market opportunities

Transition towards eco-friendly and biodegradable gel pack materials
Integration of smart temperature monitoring technologies within gel packaging
Adoption of reusable gel pack models in closed-loop supply chains

14. Competitive Landscape

14.1 Overview

14.2

Overview on criticality of inputs and factors of differentiation

14.3 Landscape disruption

Overview on factors of disruption

14.4 Industry risks

Impact of key risks on business

15. Competitive Analysis

15.1 Companies profiled

Companies covered

15.2 Company ranking index

15.3 Market positioning of companies

Matrix on companies position and classification

15.4 Cardinal Health Inc.

Cardinal Health Inc. - Overview
Cardinal Health Inc. - Business segments
Cardinal Health Inc. - Key offerings
Cardinal Health Inc. - Segment focus
SWOT

15.5 Cold Chain Technologies LLC

Cold Chain Technologies LLC - Overview
Cold Chain Technologies LLC - Product / Service
Cold Chain Technologies LLC - Key offerings
SWOT

15.6 Cryopak

Cryopak - Overview
Cryopak - Product / Service
Cryopak - Key offerings
SWOT

15.7 Insulated Products Corp.

Insulated Products Corp. - Overview
Insulated Products Corp. - Product / Service
Insulated Products Corp. - Key offerings
SWOT

15.8 Intelsius

Intelsius - Overview
Intelsius - Product / Service
Intelsius - Key offerings
SWOT

15.9 Nordic Cold Chain Solutions

Nordic Cold Chain Solutions - Overview
Nordic Cold Chain Solutions - Product / Service
Nordic Cold Chain Solutions - Key offerings
SWOT

15.10 Nortech Laboratories Inc.

Nortech Laboratories Inc. - Overview
Nortech Laboratories Inc. - Product / Service
Nortech Laboratories Inc. - Key offerings
SWOT

15.11 Peli BioThermal LLC

Peli BioThermal LLC - Overview
Peli BioThermal LLC - Product / Service
Peli BioThermal LLC - Key offerings
SWOT

15.12 Pelton Shepherd Industries

Pelton Shepherd Industries - Overview
Pelton Shepherd Industries - Product / Service
Pelton Shepherd Industries - Key offerings
SWOT

15.13 Polar Tech Industries

Polar Tech Industries - Overview
Polar Tech Industries - Product / Service
Polar Tech Industries - Key offerings
SWOT

15.14 Rapid Aid

Rapid Aid - Overview
Rapid Aid - Product / Service
Rapid Aid - Key offerings
SWOT

15.15 Sofrigam

Sofrigam - Overview
Sofrigam - Product / Service
Sofrigam - Key offerings
SWOT

15.16 Softbox Systems Ltd.

Softbox Systems Ltd. - Overview
Softbox Systems Ltd. - Product / Service
Softbox Systems Ltd. - Key offerings
SWOT

15.17 Tempack Packaging Solutions SL

Tempack Packaging Solutions SL - Overview
Tempack Packaging Solutions SL - Product / Service
Tempack Packaging Solutions SL - Key offerings
SWOT

15.18 ThermoSafe

ThermoSafe - Overview
ThermoSafe - Product / Service
ThermoSafe - Key offerings
SWOT

16. Appendix

16.1 Scope of the report

Market definition
Objectives
Notes and caveats

16.2 Inclusions and exclusions checklist

Inclusions checklist
Exclusions checklist

16.3 Currency conversion rates for US$

16.4 Research methodology

16.5 Data procurement

Information sources

16.6 Data validation

16.7 Validation techniques employed for market sizing

16.8 Data synthesis

16.9 360 degree market analysis

16.10 List of abbreviations

Research Methodology

Technavio presents a detailed picture of the market by way of study, synthesis, and summation of data from multiple sources. The analysts have presented the various facets of the market with a particular focus on identifying the key industry influencers. The data thus presented is comprehensive, reliable, and the result of extensive research, both primary and secondary.

INFORMATION SOURCES

Primary sources

  • Manufacturers and suppliers
  • Channel partners
  • Industry experts
  • Strategic decision makers

Secondary sources

  • Industry journals and periodicals
  • Government data
  • Financial reports of key industry players
  • Historical data
  • Press releases

DATA ANALYSIS

Data Synthesis

  • Collation of data
  • Estimation of key figures
  • Analysis of derived insights

Data Validation

  • Triangulation with data models
  • Reference against proprietary databases
  • Corroboration with industry experts

REPORT WRITING

Qualitative

  • Market drivers
  • Market challenges
  • Market trends
  • Five forces analysis

Quantitative

  • Market size and forecast
  • Market segmentation
  • Geographical insights
  • Competitive landscape

Interested in this report?

Get your sample now to see our research methodology and insights!

Download Now

Frequently Asked Questions

Gel Packs market growth will increase by USD 141229.5 thousand thousand during 2026-2030.

The Gel Packs market is expected to grow at a CAGR of 5.9% during 2026-2030.

Gel Packs market is segmented by Product (Reusable gel packs, Disposable gel packs) End-user (Hospitals and clinics, Households, Pharmaceutical companies, Food processing companies, Sports organizations) Type (Water-based, Polymer-based, Phase change materials)

3M Co., Cardinal Health Inc., Cold Chain Technologies LLC, Cryopak, Insulated Products Corp., Intelsius, Medline Inc., Nordic Cold Chain Solutions, Nortech Laboratories Inc., Peli BioThermal LLC, Pelton Shepherd Industries, Polar Tech Industries, Rapid Aid, Sealed Air Corp., Sofrigam, Softbox Systems Ltd., TECHNI ICE, Tempack Packaging Solutions SL, ThermaFreeze Products Corp, ThermoSafe are a few of the key vendors in the Gel Packs market.

Asia will register the highest growth rate of 29.7% among the other regions. Therefore, the Gel Packs market in Asia is expected to garner significant business opportunities for the vendors during the forecast period.

US, Canada, Mexico, Germany, UK, France, Italy, Spain, The Netherlands, Russia, China, Japan, India, South Korea, Indonesia, Thailand, Singapore, Australia, Brazil, South Africa, UAE, Saudi Arabia, Turkey

  • Exponential expansion of global cold chain logistics network is the driving factor this market.

The Gel Packs market vendors should focus on grabbing business opportunities from the Product segment as it accounted for the largest market share in the base year.
RIA - Research AI Assistant
Ask RIA