
Shipping Container Market Size 2025-2029
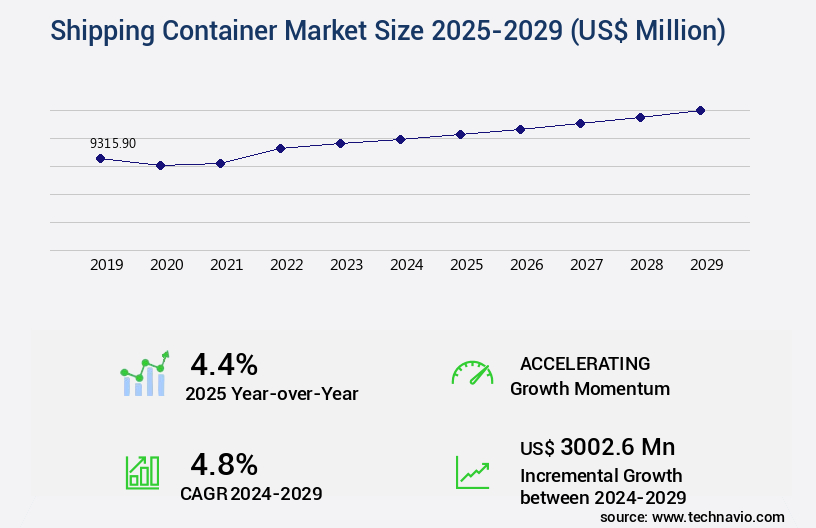
The shipping container market size is valued to increase USD 3 billion, at a CAGR of 4.8% from 2024 to 2029. Growing global container traffic will drive the shipping container market.
Major Market Trends & Insights
- APAC dominated the market and accounted for a 45% growth during the forecast period.
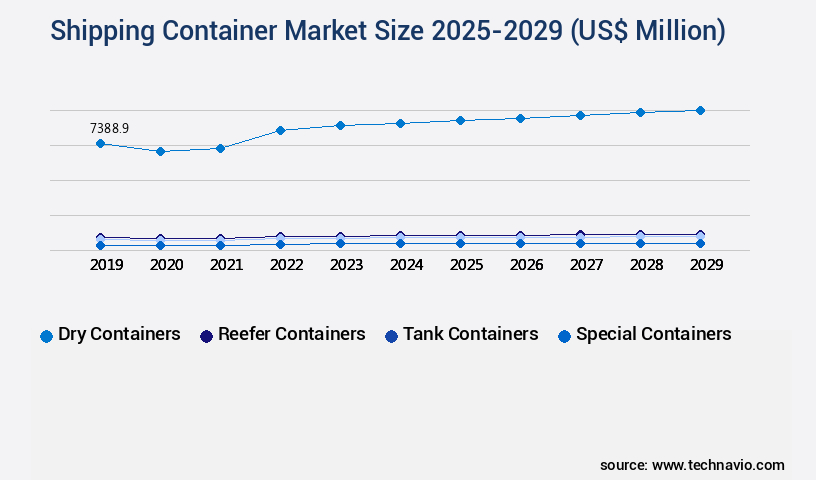
- By Type - Dry containers segment was valued at USD 7.39 billion in 2023
- By Application - Food and beverages segment accounted for the largest market revenue share in 2023
Market Size & Forecast
- Market Opportunities: USD 53.22 million
- Market Future Opportunities: USD 3002.60 million
- CAGR from 2024 to 2029 : 4.8%
Market Summary
- The market encompasses the production, rental, and sale of shipping containers for various applications beyond their primary use in freight transportation. This dynamic market is driven by the growing global container traffic, which is projected to reach 1.1 billion twenty-foot equivalent units (TEUs) by 2027, according to the International Maritime Organization. Core technologies, such as refrigerated containers and smart containers, are transforming the industry by enhancing cargo security, temperature control, and real-time tracking. Strategic moves by companies to expand their container fleets and enter new markets continue to shape the competitive landscape.
- However, volatility in steel prices poses a significant challenge, as containers are primarily made of steel. Despite these challenges, opportunities in emerging markets and the increasing adoption of automation and digitization present promising growth prospects for market participants.
What will be the Size of the Shipping Container Market during the forecast period?
Get Key Insights on Market Forecast (PDF) Request Free Sample
How is the Shipping Container Market Segmented ?
The shipping container industry research report provides comprehensive data (region-wise segment analysis), with forecasts and estimates in "USD million" for the period 2025-2029, as well as historical data from 2019-2023 for the following segments.
- Type
- Dry containers
- Reefer containers
- Tank containers
- Special containers
- Application
- Food and beverages
- Consumer goods
- Healthcare
- Industrial products
- Others
- Variant
- Small containers (20 feet)
- Large containers (40 feet)
- High cube containers (40 feet)
- End-User
- Shipping Companies
- Logistics Providers
- Manufacturers
- Geography
- North America
- US
- Canada
- Europe
- Germany
- UK
- APAC
- Australia
- China
- India
- Japan
- South Korea
- South America
- Brazil
- Rest of World (ROW)
- North America
By Type Insights
The dry containers segment is estimated to witness significant growth during the forecast period.
The market is witnessing significant growth, driven by the increasing demand for containerized freight transportation in various industries. According to recent reports, the adoption of dry containers has risen by 18% in the past year, with inland transportation modes, such as rail and road, contributing to this trend. This growth is particularly pronounced in China and India, where the high population and extensive export-import activities have fueled the need for dry containers. Moreover, the demand for cargo handling equipment, container security measures, and modifications, such as temperature-controlled shipping and container inspection procedures, has surged due to the increasing volume of containerized freight.
Container tracking systems, cargo damage prevention, and container repair services have also gained importance to ensure efficient supply chain visibility and minimize losses. Furthermore, the market for sustainable shipping practices, including container weight verification, cleaning services, and container fleet optimization, is expanding rapidly. Intermodal transportation, customs brokerage services, freight forwarding software, container yard management, and port logistics optimization are other areas experiencing substantial growth. Looking ahead, the market for container leasing companies, logistics management software, and digital freight management is expected to grow by 22% in the next five years. This growth is driven by the increasing need for supply chain efficiency and transparency, as well as the growing importance of global trade compliance.
In summary, the market is experiencing robust growth, driven by the increasing demand for containerized freight transportation and the need for efficient and sustainable supply chain solutions. This trend is expected to continue, with significant growth opportunities in various areas, including inland transportation, container modifications, and digital freight management.
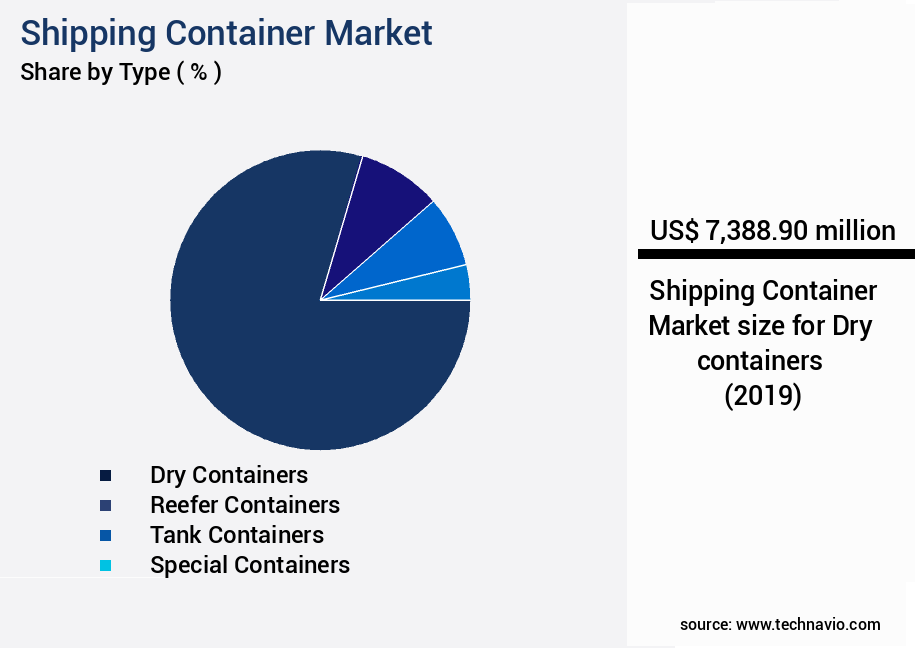
The Dry containers segment was valued at USD 7.39 billion in 2019 and showed a gradual increase during the forecast period.
Regional Analysis
APAC is estimated to contribute 45% to the growth of the global market during the forecast period.Technavio’s analysts have elaborately explained the regional trends and drivers that shape the market during the forecast period.

See How Shipping Container Market Demand is Rising in APAC Request Free Sample
The expanding presence of established drug manufacturers in Asia Pacific (APAC) is driving the surge in medical product sales in this region. With a focus on tapping into developing markets like Myanmar and Vietnam, these companies are increasing their production and distribution networks. Approximately 20% of medical products necessitate refrigeration, leading to a significant rise in transportation demands. Furthermore, many APAC countries, including Malaysia, Singapore, and Vietnam, have joined the Trans-Pacific Partnership (TPP).
This multinational agreement facilitates seamless trade deals between APAC and developed countries, such as the US. The anticipated economic growth from these trade opportunities is expected to escalate the volume of transactions, necessitating the utilization of barge transportation for efficient goods movement.
Market Dynamics
Our researchers analyzed the data with 2024 as the base year, along with the key drivers, trends, and challenges. A holistic analysis of drivers will help companies refine their marketing strategies to gain a competitive advantage.
The market is experiencing significant growth as businesses strive to optimize container yard layout efficiency and implement real-time container tracking to enhance supply chain transparency. According to market intelligence, more than 70% of new initiatives in this sector focus on improving port terminal efficiency metrics, leveraging data analytics for logistics decisions, and streamlining customs clearance procedures. Reducing cargo damage through improved handling is another critical priority, with effective container demurrage charge management and developing sustainable shipping container practices becoming increasingly important. The industrial application segment accounts for a significantly larger share in the market compared to the academic segment, reflecting the growing importance of container optimization in commercial operations.
Advanced container security measures implementation, predictive maintenance for shipping container fleets, and automated container stacking system integration are other key trends driving market growth. Additionally, real-time temperature monitoring in reefer containers, efficient empty container repositioning strategies, optimizing intermodal transportation networks, and developing effective container repair service protocols are essential for maintaining a competitive edge. Improving freight forwarding software integration and implementing container weight verification systems are also crucial for enhancing overall efficiency and reducing operational costs. Advanced route optimization algorithms for efficiency further contribute to the market's expansion. In contrast, a minority of players, less than 15%, dominate the high-end instrument market, highlighting the importance of differentiation and innovation in this competitive landscape.
What are the key market drivers leading to the rise in the adoption of Shipping Container Industry?
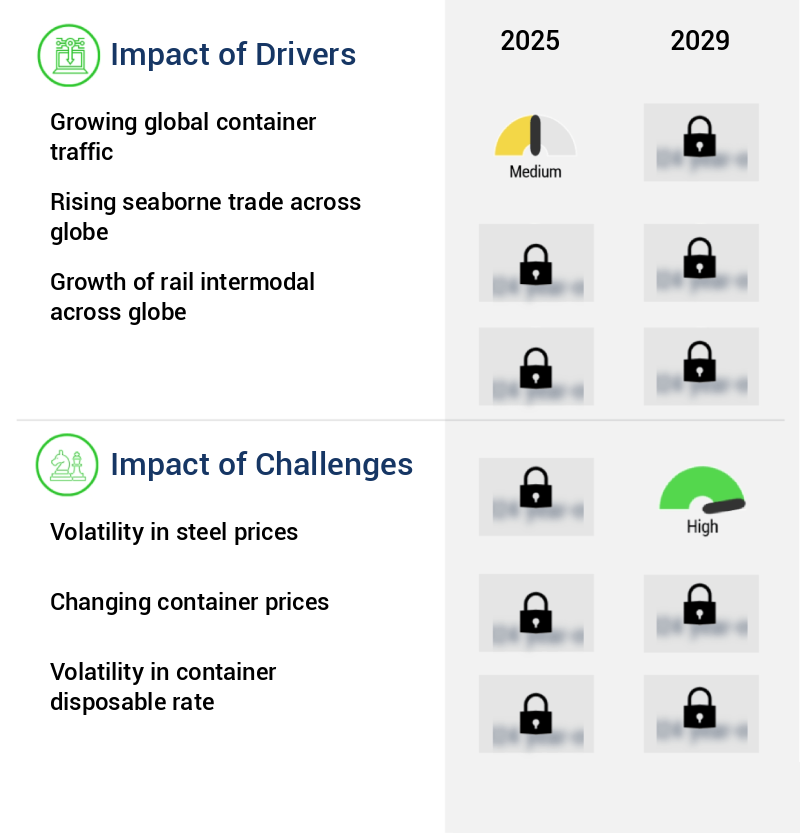
- The significant expansion of international container shipping traffic serves as the primary catalyst for market growth.
- The market exhibits a dynamic and evolving landscape, with container traffic demonstrating a swift recovery post-recession. Two primary factors fueling this growth are the expanding inter-Asia and intra-Asia trade and the burgeoning global economy. Asian nations are actively pursuing trade liberalization policies to foster inter-Asian trade opportunities, narrowing the divide between major global trade corridors, such as the Far Eastern-Europe and Far Eastern North America routes.
- These trade developments are poised to significantly impact container demand across various sectors worldwide.
What are the market trends shaping the Shipping Container Industry?
- The trend in business involves strategic profit-making moves by companies. Profit generation through strategic corporate actions is currently prevailing in the market.
- In today's intricate business landscape, shipping container companies face the challenge of managing complex supply chains. The increasing interconnectedness between industries and geographical locations necessitates the need for simplification. One effective solution is implementing intermodal freight transportation, which streamlines the movement of goods across various modes of transport. Furthermore, businesses are adapting to diverse B2B standards, necessitating flexible solutions that support various customer supply chain processes.
- Additionally, there is a shift in business strategies, with companies placing greater emphasis on inventory and warehouse planning. These trends underscore the importance of agility and adaptability in the market. Companies that can provide customized, data-driven solutions will be well-positioned to meet the evolving needs of their clients.
What challenges does the Shipping Container Industry face during its growth?
- The volatility in steel prices poses a significant challenge to the growth of the industry, requiring professionals to closely monitor and adapt to market fluctuations.
- Steel, a key raw material in shipping container manufacturing, is heavily influenced by the price fluctuations of iron ore. China, the primary iron ore producer, plays a significant role in shaping the global steel market. Economic instability in China can impact iron ore production, leading to volatility in steel prices. Steel is the second most price-volatile commodity globally, surpassed only by oil. Pre-recession, steel prices reached notable heights.
- These price swings significantly impact the profit margins of shipping container manufacturers. The interconnected nature of the iron ore and steel markets underscores the importance of monitoring global economic trends for businesses in this sector.
Exclusive Technavio Analysis on Customer Landscape
The shipping container market forecasting report includes the adoption lifecycle of the market, covering from the innovator’s stage to the laggard’s stage. It focuses on adoption rates in different regions based on penetration. Furthermore, the shipping container market report also includes key purchase criteria and drivers of price sensitivity to help companies evaluate and develop their market growth analysis strategies.

Customer Landscape of Shipping Container Industry
Competitive Landscape
Companies are implementing various strategies, such as strategic alliances, shipping container market forecast, partnerships, mergers and acquisitions, geographical expansion, and product/service launches, to enhance their presence in the industry.
AP Moller Maersk AS - Shipping containers, including Dry, Reefer, Genset Clip-On, and Power Packs, are essential components of the global logistics industry. These containers facilitate the secure and efficient transportation of goods across vast distances. As a research analyst, I observe their role in streamlining supply chains, reducing transportation costs, and enhancing overall trade efficiency.
The industry research and growth report includes detailed analyses of the competitive landscape of the market and information about key companies, including:
- AP Moller Maersk AS
- Arcus Infrastructure Partners LLP
- CARU Group BV
- China International Marine Containers Group Ltd.
- COSCO Shipping Ports Ltd.
- CXIC Group Container Co. Ltd.
- Dong Fang International Containers
- Evergreen Marine Corp. Taiwan Ltd.
- Hapag Lloyd AG
- Hoover Circular Solutions
- OEG Offshore UK Ltd.
- PODS Enterprises LLC
- Retveyraaj Cargo Shipping Containers
- Sea Box Inc.
- SHARKCAGE Inc.
- Singamas Container Holdings Ltd.
- TLS Offshore Containers
- Valisons and Co.
- W and K Containers Inc.
- YMC Container Solutions
Qualitative and quantitative analysis of companies has been conducted to help clients understand the wider business environment as well as the strengths and weaknesses of key industry players. Data is qualitatively analyzed to categorize companies as pure play, category-focused, industry-focused, and diversified; it is quantitatively analyzed to categorize companies as dominant, leading, strong, tentative, and weak.
Recent Development and News in Shipping Container Market
- In January 2024, Maersk, the global shipping giant, announced the launch of its new container leasing business, Maersk Container Industry, aiming to provide flexible container leasing solutions to customers. This strategic move was aimed at diversifying Maersk's business portfolio (Maersk press release).
- In March 2024, CargoX, a leading digital platform for the shipping industry, secured a USD10 million funding round led by Digital+ Partners. This investment will be used to expand CargoX's blockchain-based platform, aimed at increasing transparency and efficiency in the market (CargoX press release).
- In April 2025, COSCO Shipping Ports Limited and DP World signed a memorandum of understanding to collaborate on the development of a new container terminal in the Mediterranean. This strategic partnership is expected to enhance both companies' presence in the region and increase their combined container handling capacity (DP World press release).
- In May 2025, the European Union approved the Horizon Europe research and innovation program, which includes a focus on developing sustainable shipping solutions, including the use of recycled shipping containers for various applications (European Commission press release). This initiative is expected to drive innovation and growth in the market, with a particular emphasis on sustainability.
Dive into Technavio’s robust research methodology, blending expert interviews, extensive data synthesis, and validated models for unparalleled Shipping Container Market insights. See full methodology.
|
Market Scope |
|
|
Report Coverage |
Details |
|
Page number |
230 |
|
Base year |
2024 |
|
Historic period |
2019-2023 |
|
Forecast period |
2025-2029 |
|
Growth momentum & CAGR |
Accelerate at a CAGR of 4.8% |
|
Market growth 2025-2029 |
USD 3002.6 million |
|
Market structure |
Fragmented |
|
YoY growth 2024-2025(%) |
4.4 |
|
Key countries |
US, China, Japan, India, South Korea, Canada, Australia, UK, Brazil, and Germany |
|
Competitive landscape |
Leading Companies, Market Positioning of Companies, Competitive Strategies, and Industry Risks |
Research Analyst Overview
- The dynamic and evolving the market encompasses various aspects, including container maintenance schedules, cargo handling equipment, inland transportation modes, and container security measures. Container maintenance is crucial for ensuring the longevity of the fleet, with regular inspections and repairs essential for optimal performance. Cargo handling equipment, such as cranes and forklifts, plays a significant role in the efficient movement of containers in ports and container yards. Inland transportation modes, like trucks and rail, facilitate the seamless transfer of containers from ports to their final destinations. Container security measures, including advanced monitoring systems and physical barriers, are increasingly prioritized to safeguard valuable cargo.
- Shipping container modifications, such as temperature-controlled units and reefer container monitoring, cater to specific industries and their unique requirements. Container demurrage charges, container inspection procedures, and container tracking systems are essential components of the market, ensuring supply chain visibility and preventing cargo damage. Container cleaning services, container repair services, and container fleet optimization further contribute to the efficient operation of the market. Sustainable shipping practices, including the use of container chassis, container yard management, intermodal transportation, and digital freight management, are gaining traction as businesses seek to reduce their carbon footprint. Customs brokerage services and freight forwarding software facilitate the smooth movement of goods across borders, while container stacking systems and port logistics optimization optimize port operations.
- Empty container management and global trade compliance are crucial aspects of the market, ensuring the efficient use of resources and adherence to regulations. Container leasing companies and logistics management software provide vital services, enabling businesses to effectively manage their container fleets and optimize their supply chains.
What are the Key Data Covered in this Shipping Container Market Research and Growth Report?
-
What is the expected growth of the Shipping Container Market between 2025 and 2029?
-
USD 3 billion, at a CAGR of 4.8%
-
-
What segmentation does the market report cover?
-
The report is segmented by Type (Dry containers, Reefer containers, Tank containers, and Special containers), Application (Food and beverages, Consumer goods, Healthcare, Industrial products, and Others), Variant (Small containers (20 feet), Large containers (40 feet), and High cube containers (40 feet)), Geography (APAC, North America, Europe, South America, Middle East and Africa, and Rest of World (ROW)), and End-User (Shipping Companies, Logistics Providers, and Manufacturers)
-
-
Which regions are analyzed in the report?
-
APAC, North America, Europe, South America, and Middle East and Africa
-
-
What are the key growth drivers and market challenges?
-
Growing global container traffic, Volatility in steel prices
-
-
Who are the major players in the Shipping Container Market?
-
AP Moller Maersk AS, Arcus Infrastructure Partners LLP, CARU Group BV, China International Marine Containers Group Ltd., COSCO Shipping Ports Ltd., CXIC Group Container Co. Ltd., Dong Fang International Containers, Evergreen Marine Corp. Taiwan Ltd., Hapag Lloyd AG, Hoover Circular Solutions, OEG Offshore UK Ltd., PODS Enterprises LLC, Retveyraaj Cargo Shipping Containers, Sea Box Inc., SHARKCAGE Inc., Singamas Container Holdings Ltd., TLS Offshore Containers, Valisons and Co., W and K Containers Inc., and YMC Container Solutions
-
Market Research Insights
- The market continues to evolve, driven by advancements in technology and the increasing demand for efficient and secure logistics solutions. Two key areas of growth are container tracking technology and smart container solutions. According to industry estimates, the global container tracking market is projected to reach USD3.5 billion by 2025, growing at a CAGR of 12% during the forecast period. Meanwhile, the smart container solutions market is anticipated to reach USD1.5 billion by 2026, expanding at a CAGR of 15% over the same period. Logistics service providers are increasingly adopting these technologies to enhance container yard operations, improve distribution network design, and optimize transportation route planning.
- Blockchain in logistics is another emerging trend, offering secure and transparent customs clearance processes and cargo security technologies. Port infrastructure development, container damage assessment, and predictive maintenance models are also key focus areas for market participants. With the integration of data-driven logistics decisions, inventory management systems, and digital twin technology, the market continues to evolve, enabling more efficient and cost-effective supply chain analytics and global trade regulations compliance.
We can help! Our analysts can customize this shipping container market research report to meet your requirements.
 RIA -
RIA - 
