
Genai In Business Market Size 2025-2029
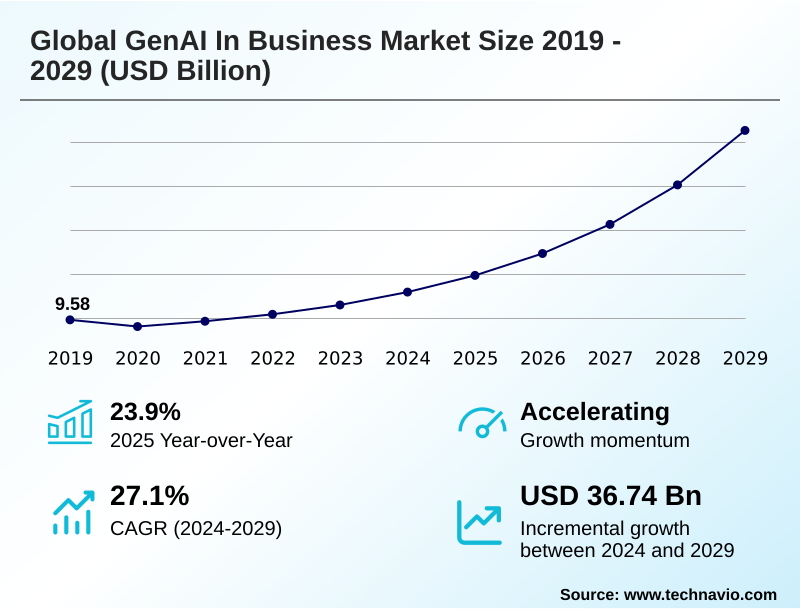
The genai in business market size is valued to increase by USD 36.74 billion, at a CAGR of 27.1% from 2024 to 2029. Rapid advancements in foundational models and increased accessibility will drive the genai in business market.
Major Market Trends & Insights
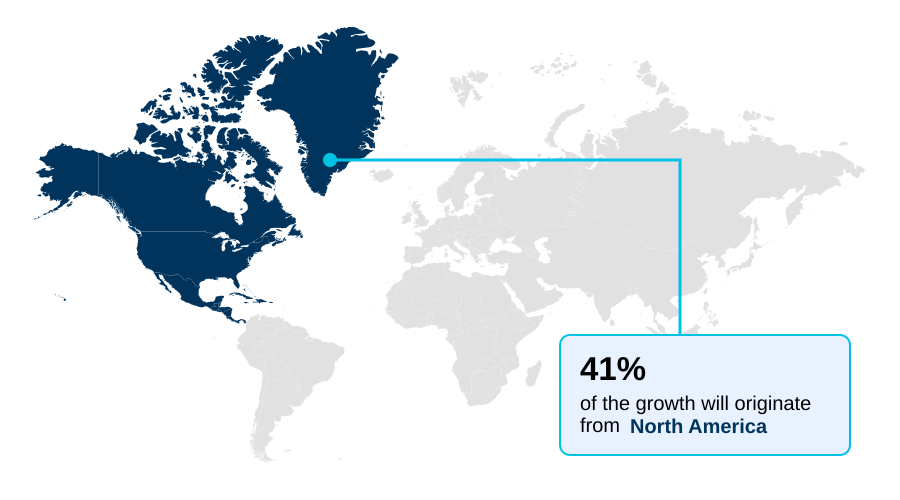
- North America dominated the market and accounted for a 40.6% growth during the forecast period.
- By Component - Software segment was valued at USD 8.80 billion in 2023
- By Technology - Transformer-based models segment accounted for the largest market revenue share in 2023
Market Size & Forecast
- Market Opportunities: USD 43.04 billion
- Market Future Opportunities: USD 36.74 billion
- CAGR from 2024 to 2029 : 27.1%
Market Summary
- The genai in business market is rapidly transitioning from experimental technology to a core component of enterprise strategy, driven by the imperative to enhance operational efficiency and create new value streams. This evolution is powered by the increasing sophistication of foundational models, which are now capable of automating complex, knowledge-based work previously handled by human professionals.
- For instance, in business process automation for insurance, generative AI can reduce claims processing times from days to mere hours while simultaneously improving accuracy. The technology's ability to facilitate deep AI-driven personalization is reshaping customer engagement, allowing for tailored experiences at a massive scale.
- However, enterprises face significant hurdles, including concerns over model hallucination and the complexities of integrating deep-learning models with legacy IT systems. The strategic deployment of AI copilots and the development of vertical-specific solutions are key trends enabling broader adoption.
- Success hinges on establishing robust AI governance frameworks to manage risks related to data security and ethical compliance, ensuring that the technology delivers sustainable and trustworthy business outcomes. The market's trajectory points toward a future where generative AI is an ambient, indispensable feature of the modern enterprise technology stack, augmenting cognitive labor across all functions.
What will be the Size of the Genai In Business Market during the forecast period?
Get Key Insights on Market Forecast (PDF) Get Free Sample
How is the Genai In Business Market Segmented?
The genai in business industry research report provides comprehensive data (region-wise segment analysis), with forecasts and estimates in "USD million" for the period 2025-2029, as well as historical data from 2019-2023 for the following segments.
- Component
- Software
- Services
- Technology
- Transformer-based models
- GANs
- Diffusion models
- VAEs
- Others
- Application
- Marketing and advertising
- Customer support and chatbots
- E-commerce
- Design
- Others
- Geography
- North America
- US
- Canada
- Mexico
- Europe
- UK
- Germany
- France
- APAC
- China
- Japan
- India
- Middle East and Africa
- South Africa
- UAE
- Saudi Arabia
- South America
- Brazil
- Argentina
- Colombia
- Rest of World (ROW)
- North America
By Component Insights
The software segment is estimated to witness significant growth during the forecast period.
The software component is the technological core, encompassing a layered architecture from foundational models to applications. This segment includes powerful transformer-based models and diffusion models accessed via enterprise generative AI platforms.
The pace of innovation enables breakthrough long-context understanding, allowing for complex AI for contract analysis and generative AI for drug discovery. The ecosystem also relies on open-source AI models and techniques like fine-tuning to create industry-specific AI solutions.
This AI-driven personalization is embedded in core business software, creating AI-augmented workflows and enhancing AI for operational efficiency through secure enterprise AI deployment, with some models processing up to one million tokens per prompt.
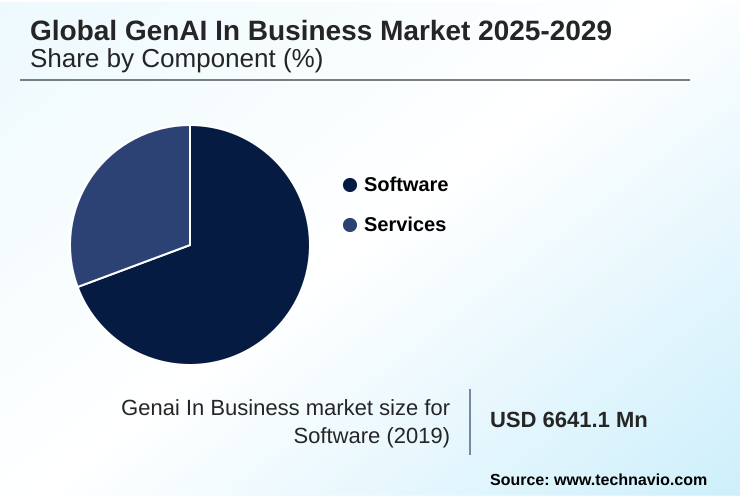
The Software segment was valued at USD 8.80 billion in 2023 and showed a gradual increase during the forecast period.
Regional Analysis
North America is estimated to contribute 40.6% to the growth of the global market during the forecast period.Technavio’s analysts have elaborately explained the regional trends and drivers that shape the market during the forecast period.
See How Genai In Business Market Demand is Rising in North America Get Free Sample
The geographic landscape for generative AI is led by North America, which is poised to capture over 40% of the market's incremental growth, driven by its concentration of foundational model developers and aggressive enterprise adoption.
This region pioneers the use of AI coding assistants and advanced conversational AI for applications in AI for financial services and generative AI for CRM.
The APAC region is projected to be the fastest-growing market, with a focus on mobile-first applications and digital transformation driving demand for automated content creation and generative AI for e-commerce.
Europe's market emphasizes AI governance and vertical-specific solutions for its industrial base.
The EU's AI Act, approved in March 2024, influences strategies for secure enterprise AI deployment and generative AI ethics and compliance globally, impacting everything from AI for market analysis to generative AI for product design.
Market Dynamics
Our researchers analyzed the data with 2024 as the base year, along with the key drivers, trends, and challenges. A holistic analysis of drivers will help companies refine their marketing strategies to gain a competitive advantage.
- Enterprises are strategically navigating the genai in business market by carefully evaluating the trade-offs between different technologies, such as the debate over transformer models versus diffusion models for specific creative tasks. A key focus is implementing generative AI for efficiency, with many organizations using open-source models for business to pilot new applications.
- The clear benefits of retrieval-augmented generation in mitigating risks are making it a standard for enterprise-grade applications. This is especially true for generative AI in customer support, where accuracy is paramount. However, the challenges of AI model integration with legacy systems remain a significant consideration.
- A primary goal is reducing operational costs with AI, a target achieved by leveraging generative AI to improve productivity. Organizations are exploring the impact of multimodal models on business, which promises to unify disparate data streams. As deployment scales, best practices for secure AI deployment become critical.
- Decision-makers are conducting thorough cost-benefit analysis of AI copilots and evaluating generative AI vendor platforms to find the best fit. A crucial aspect of this process involves fine-tuning LLMs with proprietary data to build a competitive advantage, particularly for tasks like AI for hyper-personalized marketing and generative AI for automated code generation.
- The role of GANs in synthetic data generation remains vital for training models where real-world data is scarce or sensitive. Mitigating model hallucination in enterprise applications and ensuring compliance with emerging AI regulations are top priorities. The ability to build enterprise-grade RAG systems and optimize supply chains with generative AI demonstrates the technology's maturing capabilities.
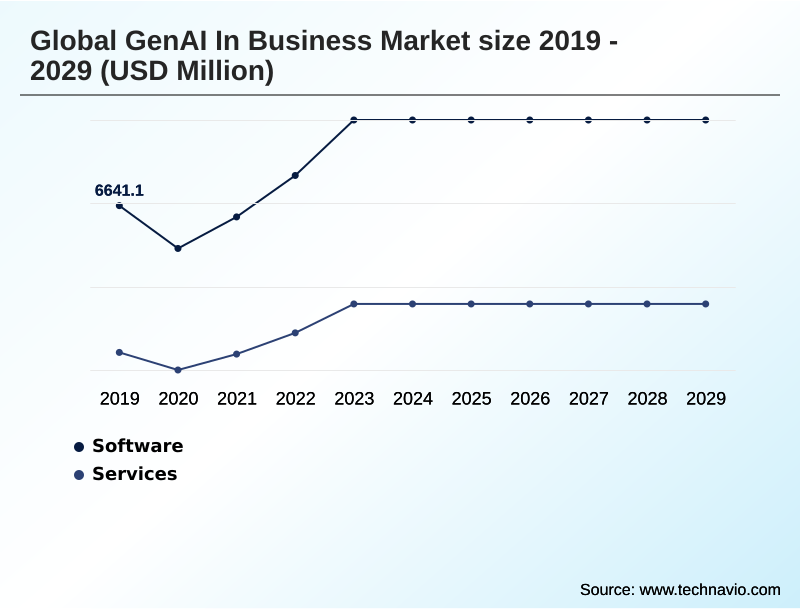
- The services segment is expanding at a rate nearly 8% faster than the software segment, indicating a strong demand for expert implementation and customization support.
What are the key market drivers leading to the rise in the adoption of Genai In Business Industry?
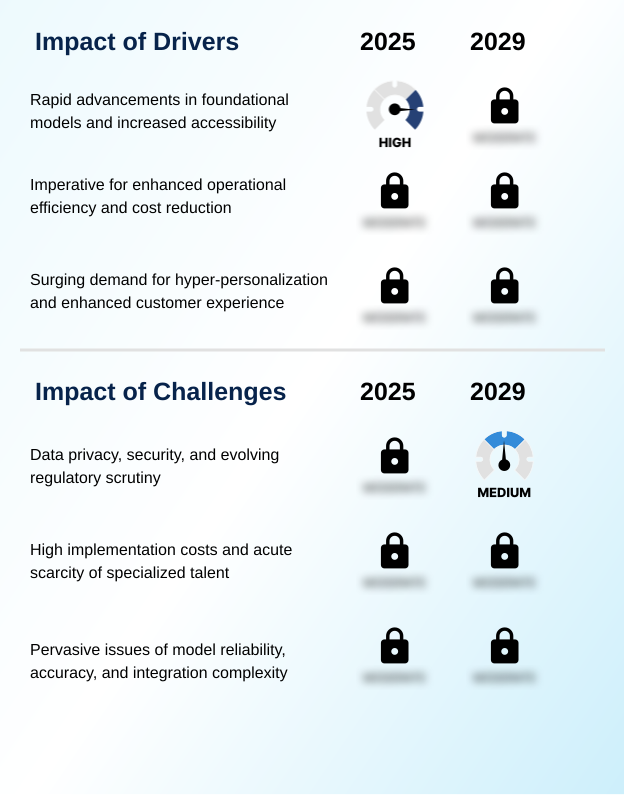
- The market is primarily driven by rapid advancements in foundational models and their expanding accessibility through cloud platforms and open-source initiatives.
- The primary driver is the intense pressure for AI for process automation and cost reduction. Generative AI enables knowledge-based work automation and cognitive labor augmentation, with some firms reporting AI assistants performing the work of 700 agents.
- The adoption of AI for software development tools has soared, allowing skilled professionals to focus on strategic initiatives. The demand for AI-driven personalization further propels the market, driving sustained investment in generative AI in marketing automation.
- This is creating new opportunities for AI-powered business intelligence and better AI model reliability metrics as businesses track performance gains from these AI copilots.
What are the market trends shaping the Genai In Business Industry?
- A defining market trend is the rapid convergence toward multimodal capabilities within unified models, moving AI beyond text-based processing to become a multi-sensory digital collaborator.
- A defining trend is the convergence toward multimodality, creating unified, deep-learning models with intuitive multimodal user interfaces. This evolution enables richer interactions and is key for generative AI ROI calculation. The proliferation of smaller, specialized models, enhanced through retrieval-augmented generation to ensure factual grounding, is critical for deploying explainable AI (XAI) in business.
- This trend toward customizable AI models addresses the issue of model inference cost. This dual approach provides enterprises a spectrum of options for their AI-augmented workflows and AI for customer experience enhancement, including advanced digital twin simulation.
What challenges does the Genai In Business Industry face during its growth?
- Significant industry growth is challenged by the complex intersection of data privacy, information security, and an evolving global regulatory landscape.
- A paramount challenge is the intersection of security and regulatory scrutiny. The risk of adversarial attacks, prompt injection, and model hallucination presents significant issues, especially for AI in healthcare documentation. Navigating regulations like the EU's AI Act, approved in March 2024, adds compliance overhead for applications like generative AI for legal research.
- High implementation costs and talent scarcity also create barriers. These issues of generative AI data privacy and the need for robust hybrid cloud AI governance can slow deployment and complicate the use of variational autoencoders and generative adversarial networks for business-critical functions.
Exclusive Technavio Analysis on Customer Landscape
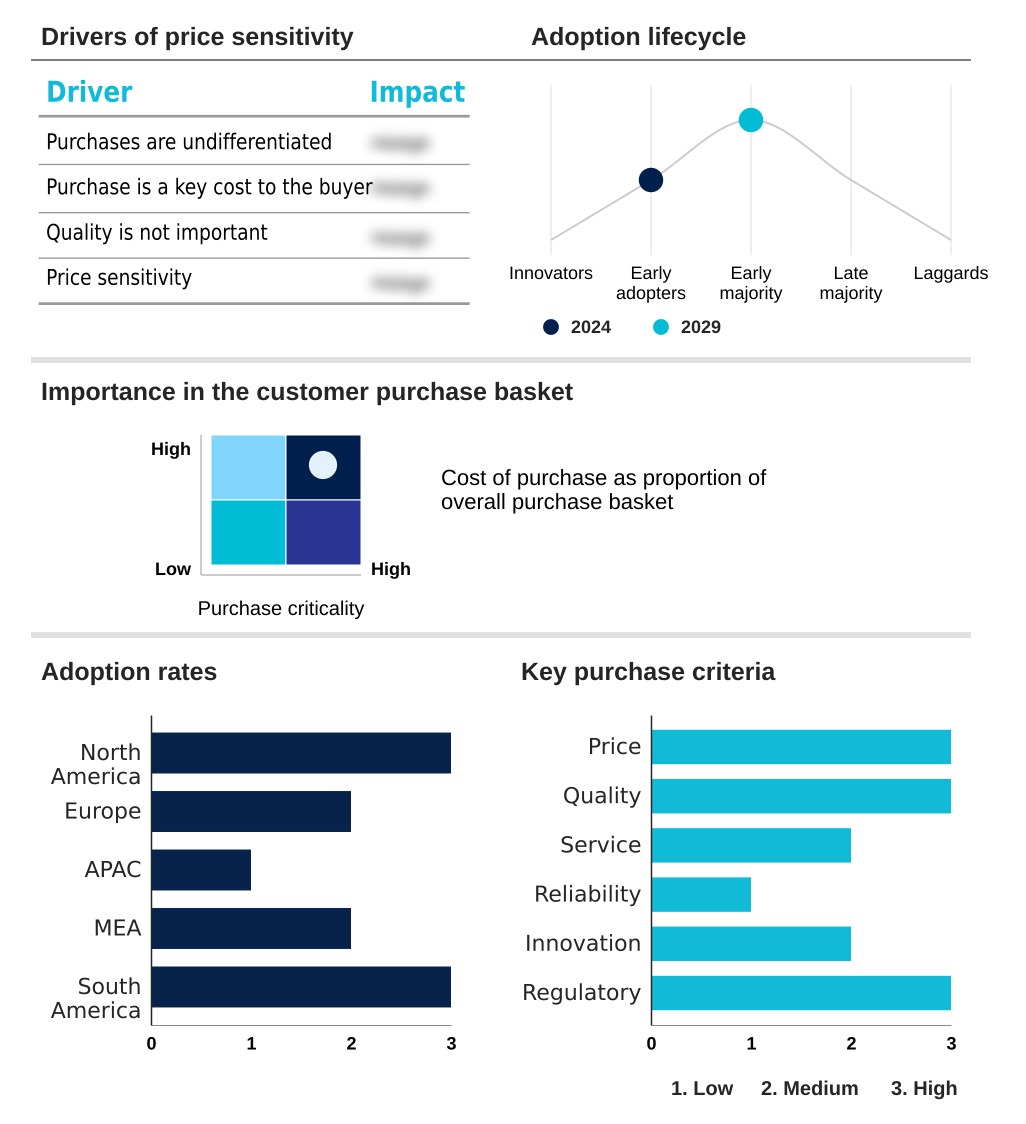
The genai in business market forecasting report includes the adoption lifecycle of the market, covering from the innovator’s stage to the laggard’s stage. It focuses on adoption rates in different regions based on penetration. Furthermore, the genai in business market report also includes key purchase criteria and drivers of price sensitivity to help companies evaluate and develop their market growth analysis strategies.
Customer Landscape of Genai In Business Industry
Competitive Landscape
Companies are implementing various strategies, such as strategic alliances, genai in business market forecast, partnerships, mergers and acquisitions, geographical expansion, and product/service launches, to enhance their presence in the industry.
Accenture PLC - Provides a comprehensive suite of consulting and technology services, enabling enterprise-wide digital transformation and AI integration across diverse industries.
The industry research and growth report includes detailed analyses of the competitive landscape of the market and information about key companies, including:
- Accenture PLC
- Adobe Inc.
- Amazon Web Services Inc.
- Anthropic
- Capgemini Service SAS
- Cohere
- Google LLC
- Hugging Face
- IBM Corp.
- Jasper AI Inc.
- Meta Platforms Inc.
- Microsoft Corp.
- NVIDIA Corp.
- OpenAI
- Oracle Corp.
- Runway AI Inc.
- Salesforce Inc.
- Stability AI
- Writesonic Inc.
Qualitative and quantitative analysis of companies has been conducted to help clients understand the wider business environment as well as the strengths and weaknesses of key industry players. Data is qualitatively analyzed to categorize companies as pure play, category-focused, industry-focused, and diversified; it is quantitatively analyzed to categorize companies as dominant, leading, strong, tentative, and weak.
Recent Development and News in Genai in business market
- In September 2024, Microsoft Corp. announced a major expansion of its Azure AI services, introducing industry-specific copilot templates for manufacturing and life sciences, designed to accelerate the adoption of generative AI in regulated environments.
- In November 2024, Google LLC deepened its partnership with a leading healthcare provider to launch a secure, HIPAA-compliant platform leveraging its Gemini models for automated clinical documentation and patient record summarization.
- In January 2025, a consortium of technology firms led by IBM Corp. and Meta Platforms Inc. released the next generation of their open-source AI models, focusing on smaller, highly efficient architectures that reduce inference costs by over 40% for enterprise applications.
- In April 2025, Anthropic announced a significant breakthrough in model safety, unveiling a new constitutional AI training technique that demonstrably reduces the risk of biased outputs and model hallucination in enterprise-critical functions.
Dive into Technavio’s robust research methodology, blending expert interviews, extensive data synthesis, and validated models for unparalleled Genai In Business Market insights. See full methodology.
| Market Scope | |
|---|---|
| Page number | 300 |
| Base year | 2024 |
| Historic period | 2019-2023 |
| Forecast period | 2025-2029 |
| Growth momentum & CAGR | Accelerate at a CAGR of 27.1% |
| Market growth 2025-2029 | USD 36735.8 million |
| Market structure | Fragmented |
| YoY growth 2024-2025(%) | 23.9% |
| Key countries | US, Canada, Mexico, UK, Germany, France, Italy, Spain, The Netherlands, China, Japan, India, South Korea, Australia, Indonesia, South Africa, UAE, Saudi Arabia, Israel, Turkey, Brazil, Argentina and Colombia |
| Competitive landscape | Leading Companies, Market Positioning of Companies, Competitive Strategies, and Industry Risks |
Research Analyst Overview
- From an analyst perspective, the genai in business market is defined by the rapid maturation of foundational models and their integration into core enterprise functions. The development of transformer-based models and diffusion models has enabled advanced automated content creation and AI-driven personalization. We're observing a strategic shift toward vertical-specific solutions, moving beyond general-purpose large language models to deliver tangible value.
- For instance, developer adoption of AI coding assistants surged to 78%, up from 23% in the prior year, highlighting the profound impact on productivity. The rise of multimodality and long-context understanding is influencing boardroom decisions on future product strategy. However, deployment is not without complexity.
- Mitigating model hallucination via retrieval-augmented generation and addressing security risks from prompt injection and adversarial attacks are critical. Establishing strong AI governance is essential for managing these challenges and for the successful use of technologies like generative adversarial networks for synthetic data generation and generative design.
- As businesses operationalize these tools, managing model inference cost and implementing effective prompt engineering and fine-tuning will be key to maximizing ROI, with AI copilots and multimodal user interfaces representing the next frontier of cognitive labor augmentation.
- The growth is also driven by open-source AI models, predictive maintenance AI, supply chain optimization AI, and digital twin simulation, all underpinned by robust deep-learning models. Knowledge-based work automation is becoming standard, moving toward ambient computing.
What are the Key Data Covered in this Genai In Business Market Research and Growth Report?
-
What is the expected growth of the Genai In Business Market between 2025 and 2029?
-
USD 36.74 billion, at a CAGR of 27.1%
-
-
What segmentation does the market report cover?
-
The report is segmented by Component (Software, and Services), Technology (Transformer-based models, GANs, Diffusion models, VAEs, and Others), Application (Marketing and advertising, Customer support and chatbots, E-commerce, Design, and Others) and Geography (North America, Europe, APAC, Middle East and Africa, South America)
-
-
Which regions are analyzed in the report?
-
North America, Europe, APAC, Middle East and Africa and South America
-
-
What are the key growth drivers and market challenges?
-
Rapid advancements in foundational models and increased accessibility, Data privacy, security, and evolving regulatory scrutiny
-
-
Who are the major players in the Genai In Business Market?
-
Accenture PLC, Adobe Inc., Amazon Web Services Inc., Anthropic, Capgemini Service SAS, Cohere, Google LLC, Hugging Face, IBM Corp., Jasper AI Inc., Meta Platforms Inc., Microsoft Corp., NVIDIA Corp., OpenAI, Oracle Corp., Runway AI Inc., Salesforce Inc., Stability AI and Writesonic Inc.
-
Market Research Insights
- The dynamics of the genai in business market are shaped by the tangible ROI from AI for process automation. Enterprises leveraging customizable AI models report significant productivity gains; developer adoption of AI for software development tools surged to 78%, a more than threefold increase from the previous year.
- This drive for AI for operational efficiency is evident as some AI assistants now handle the workload of 700 human agents with comparable satisfaction rates. Businesses are increasingly implementing industry-specific AI solutions for functions like AI for contract analysis and generative AI for legal research.
- The focus is on creating AI-augmented workflows and enhancing AI-powered business intelligence through secure enterprise AI deployment, ensuring generative AI data privacy and compliance.
We can help! Our analysts can customize this genai in business market research report to meet your requirements.
 RIA -
RIA - 
