Gene Panel Market Analysis, Size, and Forecast 2026-2030: North America (US, Canada, and Mexico), Europe (Germany, UK, and France), APAC (China, India, and Japan), South America (Brazil, Argentina, and Colombia), Middle East and Africa (Saudi Arabia, UAE, and Turkey), Asia, Rest of World (ROW)

Gene Panel Market Analysis, Size, and Forecast 2026-2030:
North America (US, Canada, and Mexico), Europe (Germany, UK, and France), APAC (China, India, and Japan), South America (Brazil, Argentina, and Colombia), Middle East and Africa (Saudi Arabia, UAE, and Turkey), Asia, Rest of World (ROW)

Published: Mar 2026 293 Pages SKU: IRTNTR40613

Market Overview at a Glance

$7.81 B
Market Opportunity
23.6%
CAGR 2025 - 2030
42.6%
North America Growth
$2.56 B
Small panel testing segment 2024

Gene Panel Market Size 2026-2030

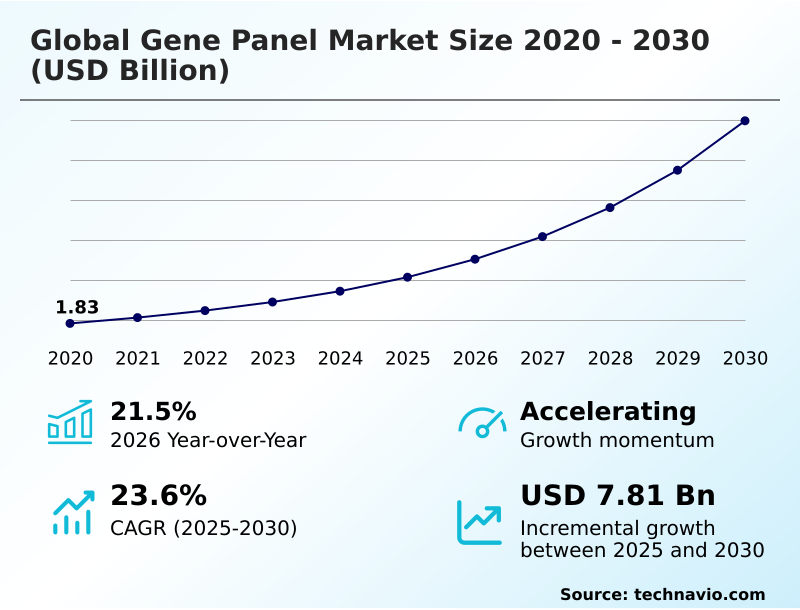
The gene panel market size is valued to increase by USD 7.81 billion, at a CAGR of 23.6% from 2025 to 2030. Ascendancy of precision oncology and proliferation of targeted therapies will drive the gene panel market.

Major Market Trends & Insights

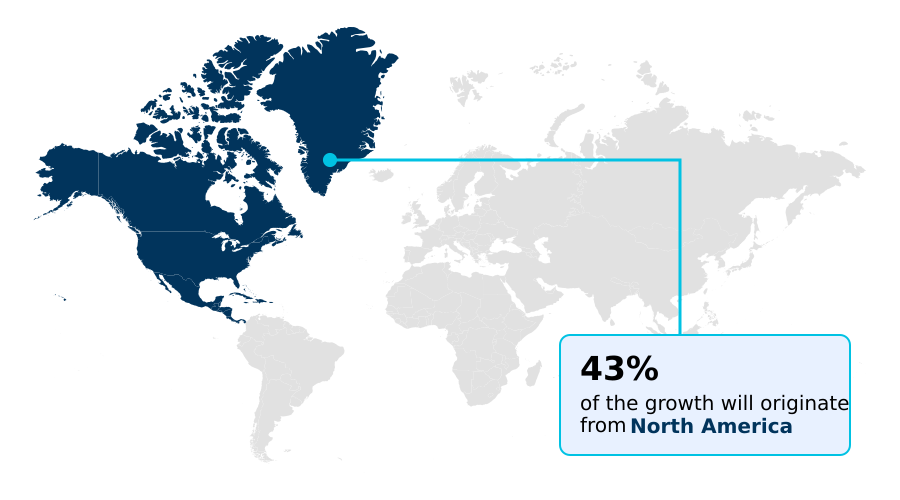
  • North America dominated the market and accounted for a 42.6% growth during the forecast period.
  • By Product - Small panel testing segment was valued at USD 2.56 billion in 2024
  • By Technique - Amplicon segment accounted for the largest market revenue share in 2024

Market Size & Forecast

  • Market Opportunities: USD 10.13 billion
  • Market Future Opportunities: USD 7.81 billion
  • CAGR from 2025 to 2030 : 23.6%

Market Summary

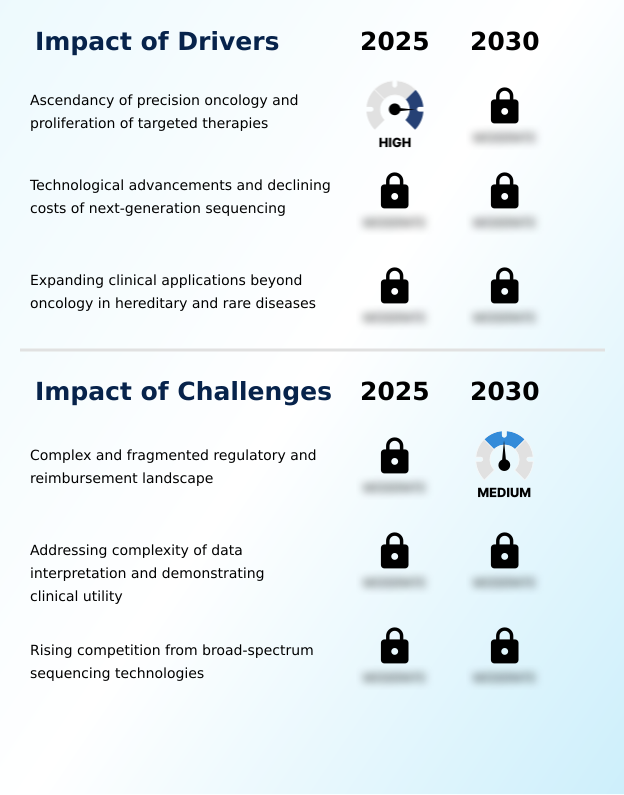
  • The gene panel market is characterized by rapid technological evolution, fundamentally altering clinical diagnostics and personalized medicine. Growth is fueled by the increasing adoption of next-generation sequencing, which has drastically lowered sequencing costs and improved the diagnostic yield from multi-gene panel testing. This shift enables broader applications, from precision oncology biomarker identification to hereditary disease diagnostics.
  • A primary trend is the move toward comprehensive genomic profiling and liquid biopsy assays, which provide a more holistic view of a patient's molecular landscape. For instance, a hospital network can implement a standardized sample-to-report workflow for in-house gene panel testing, reducing reliance on external labs and cutting turnaround time by up to 40%, thereby accelerating treatment decisions.
  • However, the industry faces challenges related to the complexity of data interpretation, particularly with variants of uncertain significance, and navigating the fragmented regulatory approval pathway and reimbursement landscape, which can hinder the adoption of novel tests.

What will be the Size of the Gene Panel Market during the forecast period?

Get Key Insights on Market Forecast (PDF) Request Free Sample

How is the Gene Panel Market Segmented?

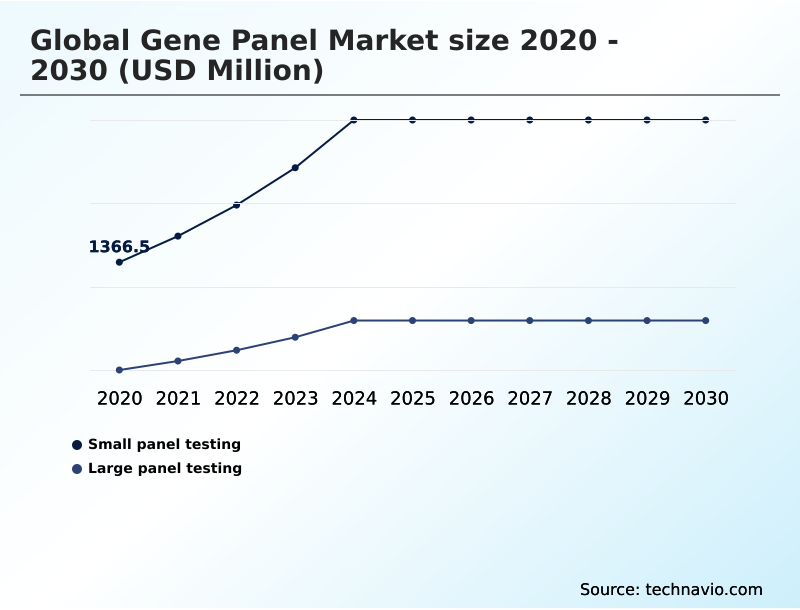
The gene panel industry research report provides comprehensive data (region-wise segment analysis), with forecasts and estimates in "USD million" for the period 2026-2030, as well as historical data from 2020-2024 for the following segments.

  • Product
    • Small panel testing
    • Large panel testing
  • Technique
    • Amplicon
    • Hybridization
  • Application
    • Oncology
    • Genetic disorders
    • Pharmacogenomics
    • Others
  • Geography
    • North America
      • US
      • Canada
      • Mexico
    • Europe
      • Germany
      • UK
      • France
    • Asia
    • Rest of World (ROW)

By Product Insights

The small panel testing segment is estimated to witness significant growth during the forecast period.

The small panel testing segment is foundational to the gene panel market, offering a focused, hypothesis-driven approach.

These panels, designed for rapid and cost-effective analysis, are crucial for routine diagnostics where a defined set of genes informs a specific medical question, such as targeted therapy selection.

This targeted methodology simplifies the bioinformatics pipeline and reduces turnaround time, a key factor in settings like decentralized hospital laboratory operations.

By concentrating on fewer than one hundred genes, these tests improve diagnostic yield for specific conditions and minimize variants of uncertain significance.

This streamlined approach, leveraging techniques like polymerase chain reaction, has been shown to improve the efficiency of patient stratification by over 25%.

This focus on efficiency and clear, actionable results supports broader adoption in clinical workflows and population health screening initiatives.

Request Free Sample

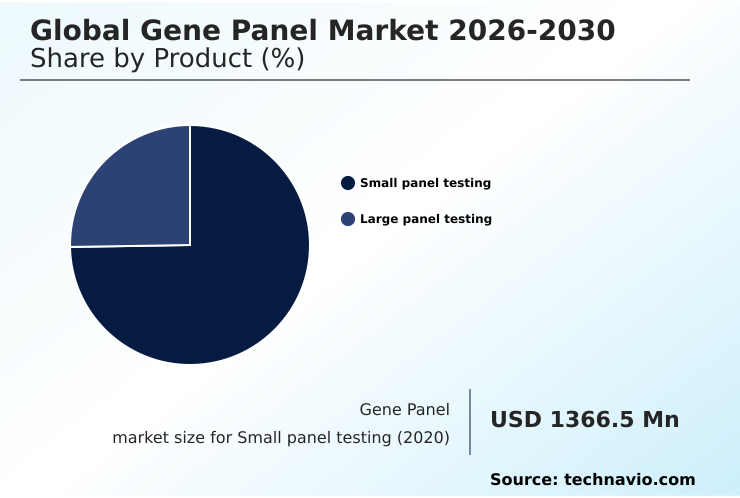
The Small panel testing segment was valued at USD 2.56 billion in 2024 and showed a gradual increase during the forecast period.

Request Free Sample

Regional Analysis

North America is estimated to contribute 42.6% to the growth of the global market during the forecast period.Technavio’s analysts have elaborately explained the regional trends and drivers that shape the market during the forecast period.

See How Gene Panel Market Demand is Rising in North America Request Free Sample

The geographic landscape of the gene panel market is led by North America, where a sophisticated R&D ecosystem and high adoption rates of next-generation sequencing sustain market leadership.

Europe is a mature market, with national initiatives promoting the integration of genomic medicine services and evidence-based medicine.

The Asia-Pacific region is experiencing the fastest growth, driven by government investment in precision medicine and a rising middle class demanding advanced healthcare, which has led to a 20% year-over-year increase in a decentralized hospital laboratory adopting in-house gene panel testing.

Key applications like hereditary cancer screening and Mendelian disorder diagnosis are gaining traction globally.

However, adoption in emerging markets is often challenged by the need for robust test validation guidelines and more favorable reimbursement landscapes to justify the cost-effectiveness analysis required by local health authorities.

Market Dynamics

Our researchers analyzed the data with 2025 as the base year, along with the key drivers, trends, and challenges. A holistic analysis of drivers will help companies refine their marketing strategies to gain a competitive advantage.

  • Strategic decision-making in the gene panel market requires a deep understanding of competing technologies and evolving clinical needs. A central consideration is the debate between whole exome sequencing vs gene panel testing, where factors like diagnostic yield and cost-effectiveness must be balanced.
  • For many routine applications, small gene panels in routine diagnostics remain highly effective, while large gene panels for genomic profiling are essential for complex cases. The rise of ai-powered custom gene panel design is enabling unprecedented specificity, particularly for custom gene panel design for oncology and panels for hereditary cardiac conditions.
  • This trend complements the increasing use of liquid biopsy for early cancer detection and multi-omics analysis in cancer profiling. The clinical utility of multi-gene panels is now well-established, with a critical role of panels in drug development and companion diagnostic development for therapies.
  • However, significant operational challenges persist, including the challenges in vus interpretation and the need for standardizing gene panel test reporting. The industry must also navigate logistical hurdles like improving the turnaround time for gene panel results while ensuring rigorous analytical validation of ngs panels.
  • A major pharmaceutical firm reported that optimizing its companion diagnostic workflow reduced patient screening times by over 35%, directly impacting clinical trial enrollment speed.
  • Addressing reimbursement policies for genomic testing and overcoming regulatory hurdles for gene panel tests are paramount, as is demonstrating the cost-effectiveness of pharmacogenomic panels to secure broader market access, especially for applications like gene panels for neurological disorders. The choice between pan-cancer panels vs organ-specific panels further complicates portfolio strategy, demanding a nuanced approach to market positioning.

What are the key market drivers leading to the rise in the adoption of Gene Panel Industry?

  • The market's growth is primarily driven by the ascendancy of precision oncology and the corresponding proliferation of targeted therapies that require genomic profiling.

  • Market growth is fundamentally driven by the expanding clinical utility of genomic information in guiding treatment decisions.
  • The proliferation of targeted therapies has made companion diagnostics an essential component of the drug development process, with precision oncology biomarkers now guiding therapy selection in over 60% of new cancer drug approvals.
  • This has solidified the role of multi-gene panel testing as a standard of care. The ability to perform somatic mutation detection and identify actionable biomarkers from a single test significantly improves efficiency over sequential testing.
  • Furthermore, applications in non-oncology areas such as rare disease diagnostics are accelerating, driven by the goal of diagnostic odyssey reduction.
  • The adoption of these panels in clinical trial objectives for patient stratification is now standard practice, improving trial outcomes and accelerating therapeutic approvals.

What are the market trends shaping the Gene Panel Industry?

  • A key market trend involves the convergence of pan-cancer profiling with multi-omics analysis. This approach integrates transcriptomics and proteomics to provide a more holistic view of tumor biology.

  • Key market trends are reshaping the application of genomic profiling, moving toward more comprehensive and integrated approaches. The convergence of pan-cancer genomic profiling with RNA expression analysis is a significant development, enabling a more holistic view of tumor biology and improving gene fusion detection.
  • This trend is amplified by the rise of liquid biopsy assays, which analyze circulating tumor dna for non-invasive treatment monitoring and early cancer detection. The use of advanced in-silico design and AI-powered platforms for creating custom panels has reduced development cycles by up to 50%.
  • This allows for rapid deployment in niche areas like neurological disorder panels and proactive health screening, driving the personalization of medicine beyond oncology. These advancements are pushing the boundaries of what is possible in diagnostics.

What challenges does the Gene Panel Industry face during its growth?

  • A significant challenge affecting industry growth is the complex and fragmented regulatory and reimbursement landscape, which creates barriers to market entry and adoption.

  • The market faces significant hurdles related to data complexity and economic validation, which can slow adoption despite technological advancements. A primary issue is data interpretation complexity, particularly the high rate of variants of uncertain significance (VUS) returned by large panels, which complicates clinical decision-making.
  • The reporting of a VUS occurs in up to 40% of comprehensive tests, creating challenges for genetic counseling. Another major restraint is the intricate regulatory approval pathway, which demands extensive evidence of clinical utility and can be a lengthy process.
  • Demonstrating value through rigorous health technology assessment and securing favorable reimbursement policies remain critical challenges, as payers increasingly demand proof that these tests lead to better patient outcomes and provide system-wide value, often requiring a 15-20% improvement in outcomes to justify coverage.

Exclusive Technavio Analysis on Customer Landscape

The gene panel market forecasting report includes the adoption lifecycle of the market, covering from the innovator’s stage to the laggard’s stage. It focuses on adoption rates in different regions based on penetration. Furthermore, the gene panel market report also includes key purchase criteria and drivers of price sensitivity to help companies evaluate and develop their market growth analysis strategies.

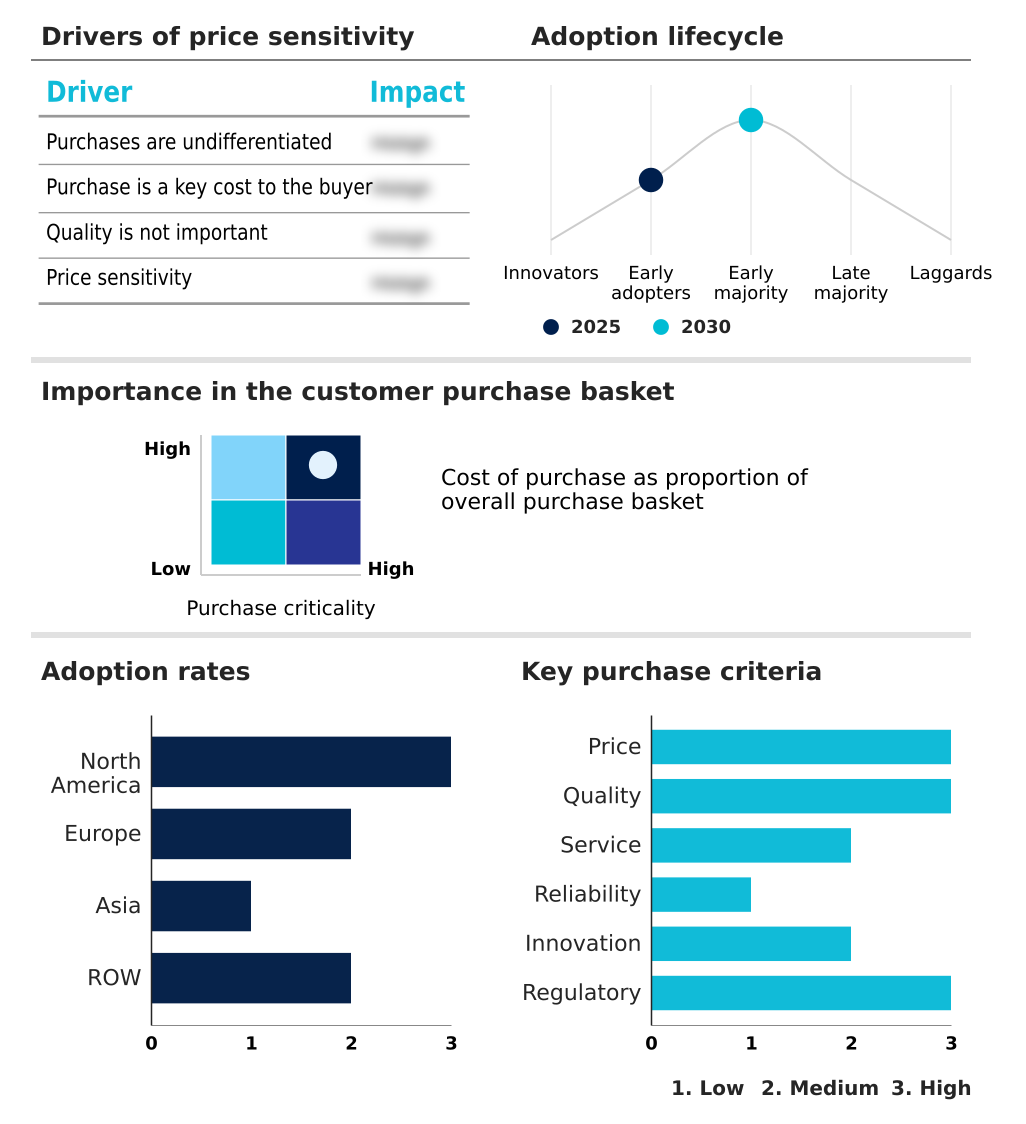
Customer Landscape of Gene Panel Industry

Competitive Landscape

Companies are implementing various strategies, such as strategic alliances, gene panel market forecast, partnerships, mergers and acquisitions, geographical expansion, and product/service launches, to enhance their presence in the industry.

Agilent Technologies Inc. - Delivers high-sensitivity custom NGS panels for precise and accurate genomic analysis, supporting targeted research and diagnostics with reliable results.

The industry research and growth report includes detailed analyses of the competitive landscape of the market and information about key companies, including:

  • Agilent Technologies Inc.
  • Azenta Inc.
  • BGI Group
  • Centogene N.V.
  • Color Health Inc.
  • Danaher Corp.
  • Eurofins Scientific SE
  • F. Hoffmann La Roche Ltd.
  • Fagron NV
  • GenXPro GmbH
  • Illumina Inc.
  • MedGenome Labs Ltd.
  • MGZ Medical Genetics Center
  • Novogene Co. Ltd.
  • OPKO Health Inc.
  • Oxford Nanopore Technologies
  • QIAGEN N.V.
  • Quest Diagnostics Inc.
  • Thermo Fisher Scientific Inc.

Qualitative and quantitative analysis of companies has been conducted to help clients understand the wider business environment as well as the strengths and weaknesses of key industry players. Data is qualitatively analyzed to categorize companies as pure play, category-focused, industry-focused, and diversified; it is quantitatively analyzed to categorize companies as dominant, leading, strong, tentative, and weak.

Recent Development and News in Gene panel market

  • In August 2025, The U.S. Food and Drug Administration approved a pan-cancer gene panel as a universal companion diagnostic, streamlining patient access to targeted therapies across all solid tumor types.
  • In April 2025, The United States Food and Drug Administration granted breakthrough designation to a liquid biopsy assay that uses multi-omic analysis for early cancer detection in high-risk individuals.
  • In March 2025, Agilent Technologies launched its ureSelect AI design wizard, an AI-powered cloud platform that enables researchers to rapidly design and order optimized custom gene panels.
  • In May 2025, The European Union's updated In Vitro Diagnostic Regulation (IVDR) fully took effect, increasing clinical evidence requirements and regulatory scrutiny for genetic test manufacturers.

Dive into Technavio’s robust research methodology, blending expert interviews, extensive data synthesis, and validated models for unparalleled Gene Panel Market insights. See full methodology.

Market Scope
Page number 293
Base year 2025
Historic period 2020-2024
Forecast period 2026-2030
Growth momentum & CAGR Accelerate at a CAGR of 23.6%
Market growth 2026-2030 USD 7814.1 million
Market structure Fragmented
YoY growth 2025-2026(%) 21.5%
Key countries US, Canada, Mexico, Germany, UK, France, Italy, Spain, The Netherlands, China, India, Japan, South Korea, Indonesia, Thailand, Brazil, Saudi Arabia, UAE, Turkey, Argentina, Colombia, South Africa and Israel
Competitive landscape Leading Companies, Market Positioning of Companies, Competitive Strategies, and Industry Risks

Request Free Sample

Research Analyst Overview

  • The gene panel market's trajectory is defined by continuous innovation in genomic technologies and their expanding clinical applications. The foundation of this market rests on next-generation sequencing, which has driven significant sequencing cost reduction and enabled sophisticated multi-gene panel testing.
  • Core technologies like polymerase chain reaction and advanced target enrichment chemistry, including both amplicon-based chemistry and hybrid capture technology, are central to the development of these panels. Progress in the field is increasingly dependent on the efficiency of the entire sample-to-report workflow, from handling formalin-fixed paraffin-embedded tissue to analysis via robust bioinformatics pipelines.
  • For boardroom strategy, a key focus is navigating the complex reimbursement landscape. The decision to invest in developing a new companion diagnostic, for example, is now directly tied to the perceived clinical utility and the likelihood of securing a favorable regulatory approval pathway, a process where a 10% improvement in analytical sensitivity can be the deciding factor for approval.
  • This strategic calculus underscores the market's evolution from a research-centric field to a pivotal component of mainstream healthcare delivery.

What are the Key Data Covered in this Gene Panel Market Research and Growth Report?

  • What is the expected growth of the Gene Panel Market between 2026 and 2030?

    • USD 7.81 billion, at a CAGR of 23.6%

  • What segmentation does the market report cover?

    • The report is segmented by Product (Small panel testing, and Large panel testing), Technique (Amplicon, and Hybridization), Application (Oncology, Genetic disorders, Pharmacogenomics, and Others) and Geography (North America, Europe, Asia, Rest of World (ROW))

  • Which regions are analyzed in the report?

    • North America, Europe, Asia and Rest of World (ROW)

  • What are the key growth drivers and market challenges?

    • Ascendancy of precision oncology and proliferation of targeted therapies, Complex and fragmented regulatory and reimbursement landscape

  • Who are the major players in the Gene Panel Market?

    • Agilent Technologies Inc., Azenta Inc., BGI Group, Centogene N.V., Color Health Inc., Danaher Corp., Eurofins Scientific SE, F. Hoffmann La Roche Ltd., Fagron NV, GenXPro GmbH, Illumina Inc., MedGenome Labs Ltd., MGZ Medical Genetics Center, Novogene Co. Ltd., OPKO Health Inc., Oxford Nanopore Technologies, QIAGEN N.V., Quest Diagnostics Inc. and Thermo Fisher Scientific Inc.

Market Research Insights

  • The market's momentum is sustained by the expanding utility of genomic profiling in personalized medicine. The integration of pharmacogenomic testing into routine care has demonstrated a 30% reduction in adverse drug reaction incidents in certain patient cohorts. Furthermore, the application of multi-modal analysis in clinical trials enables more precise patient stratification, improving study success rates by over 15%.
  • This focus on evidence-based medicine is driving demand for advanced diagnostic tools. Health technology assessment bodies now increasingly favor tests that demonstrate clear cost-effectiveness analysis, supporting their inclusion in genomic medicine service frameworks.
  • The ongoing efforts to establish clear test validation guidelines are also crucial for ensuring consistent quality and overcoming issues like algorithmic bias in genomics, thereby fostering greater clinical trust and adoption.

We can help! Our analysts can customize this gene panel market research report to meet your requirements.

Get in touch

1. Executive Summary

1.1 Market overview

Executive Summary - Chart on Market Overview
Executive Summary - Data Table on Market Overview
Executive Summary - Chart on Global Market Characteristics
Executive Summary - Chart on Market by Geography
Executive Summary - Chart on Market Segmentation by Product
Executive Summary - Chart on Market Segmentation by Technique
Executive Summary - Chart on Market Segmentation by Application
Executive Summary - Chart on Incremental Growth
Executive Summary - Data Table on Incremental Growth
Executive Summary - Chart on Company Market Positioning

2. Technavio Analysis

2.1 Analysis of price sensitivity, lifecycle, customer purchase basket, adoption rates, and purchase criteria

2.2 Criticality of inputs and Factors of differentiation

Chart on Overview on criticality of inputs and factors of differentiation

2.3 Factors of disruption

Chart on Overview on factors of disruption

2.4 Impact of drivers and challenges

Chart on Impact of drivers and challenges in 2025 and 2030

3. Market Landscape

3.1 Market ecosystem

Chart on Parent Market
Data Table on - Parent Market

3.2 Market characteristics

Chart on Market characteristics analysis

3.3 Value chain analysis

Chart on Value chain analysis

4. Market Sizing

4.1 Market definition

Data Table on Offerings of companies included in the market definition

4.2 Market segment analysis

Market segments

4.3 Market size 2025

4.4 Market outlook: Forecast for 2025-2030

Chart on Global - Market size and forecast 2025-2030 ($ million)
Data Table on Global - Market size and forecast 2025-2030 ($ million)
Chart on Global Market: Year-over-year growth 2025-2030 (%)
Data Table on Global Market: Year-over-year growth 2025-2030 (%)

5. Historic Market Size

5.1 Global Gene Panel Market 2020 - 2024

Historic Market Size - Data Table on Global Gene Panel Market 2020 - 2024 ($ million)

5.2 Product segment analysis 2020 - 2024

Historic Market Size - Product Segment 2020 - 2024 ($ million)

5.3 Technique segment analysis 2020 - 2024

Historic Market Size - Technique Segment 2020 - 2024 ($ million)

5.4 Application segment analysis 2020 - 2024

Historic Market Size - Application Segment 2020 - 2024 ($ million)

5.5 Geography segment analysis 2020 - 2024

Historic Market Size - Geography Segment 2020 - 2024 ($ million)

5.6 Country segment analysis 2020 - 2024

Historic Market Size - Country Segment 2020 - 2024 ($ million)

6. Qualitative Analysis

6.1 Impact of AI in global gene panel market

7. Five Forces Analysis

7.1 Five forces summary

Five forces analysis - Comparison between 2025 and 2030

7.2 Bargaining power of buyers

Bargaining power of buyers - Impact of key factors 2025 and 2030

7.3 Bargaining power of suppliers

Bargaining power of suppliers - Impact of key factors in 2025 and 2030

7.4 Threat of new entrants

Threat of new entrants - Impact of key factors in 2025 and 2030

7.5 Threat of substitutes

Threat of substitutes - Impact of key factors in 2025 and 2030

7.6 Threat of rivalry

Threat of rivalry - Impact of key factors in 2025 and 2030

7.7 Market condition

Chart on Market condition - Five forces 2025 and 2030

8. Market Segmentation by Product

8.1 Market segments

Chart on Product - Market share 2025-2030 (%)
Data Table on Product - Market share 2025-2030 (%)

8.2 Comparison by Product

Chart on Comparison by Product
Data Table on Comparison by Product

8.3 Small panel testing - Market size and forecast 2025-2030

Chart on Small panel testing - Market size and forecast 2025-2030 ($ million)
Data Table on Small panel testing - Market size and forecast 2025-2030 ($ million)
Chart on Small panel testing - Year-over-year growth 2025-2030 (%)
Data Table on Small panel testing - Year-over-year growth 2025-2030 (%)

8.4 Large panel testing - Market size and forecast 2025-2030

Chart on Large panel testing - Market size and forecast 2025-2030 ($ million)
Data Table on Large panel testing - Market size and forecast 2025-2030 ($ million)
Chart on Large panel testing - Year-over-year growth 2025-2030 (%)
Data Table on Large panel testing - Year-over-year growth 2025-2030 (%)

8.5 Market opportunity by Product

Market opportunity by Product ($ million)
Data Table on Market opportunity by Product ($ million)

9. Market Segmentation by Technique

9.1 Market segments

Chart on Technique - Market share 2025-2030 (%)
Data Table on Technique - Market share 2025-2030 (%)

9.2 Comparison by Technique

Chart on Comparison by Technique
Data Table on Comparison by Technique

9.3 Amplicon - Market size and forecast 2025-2030

Chart on Amplicon - Market size and forecast 2025-2030 ($ million)
Data Table on Amplicon - Market size and forecast 2025-2030 ($ million)
Chart on Amplicon - Year-over-year growth 2025-2030 (%)
Data Table on Amplicon - Year-over-year growth 2025-2030 (%)

9.4 Hybridization - Market size and forecast 2025-2030

Chart on Hybridization - Market size and forecast 2025-2030 ($ million)
Data Table on Hybridization - Market size and forecast 2025-2030 ($ million)
Chart on Hybridization - Year-over-year growth 2025-2030 (%)
Data Table on Hybridization - Year-over-year growth 2025-2030 (%)

9.5 Market opportunity by Technique

Market opportunity by Technique ($ million)
Data Table on Market opportunity by Technique ($ million)

10. Market Segmentation by Application

10.1 Market segments

Chart on Application - Market share 2025-2030 (%)
Data Table on Application - Market share 2025-2030 (%)

10.2 Comparison by Application

Chart on Comparison by Application
Data Table on Comparison by Application

10.3 Oncology - Market size and forecast 2025-2030

Chart on Oncology - Market size and forecast 2025-2030 ($ million)
Data Table on Oncology - Market size and forecast 2025-2030 ($ million)
Chart on Oncology - Year-over-year growth 2025-2030 (%)
Data Table on Oncology - Year-over-year growth 2025-2030 (%)

10.4 Genetic disorders - Market size and forecast 2025-2030

Chart on Genetic disorders - Market size and forecast 2025-2030 ($ million)
Data Table on Genetic disorders - Market size and forecast 2025-2030 ($ million)
Chart on Genetic disorders - Year-over-year growth 2025-2030 (%)
Data Table on Genetic disorders - Year-over-year growth 2025-2030 (%)

10.5 Pharmacogenomics - Market size and forecast 2025-2030

Chart on Pharmacogenomics - Market size and forecast 2025-2030 ($ million)
Data Table on Pharmacogenomics - Market size and forecast 2025-2030 ($ million)
Chart on Pharmacogenomics - Year-over-year growth 2025-2030 (%)
Data Table on Pharmacogenomics - Year-over-year growth 2025-2030 (%)

10.6 Others - Market size and forecast 2025-2030

Chart on Others - Market size and forecast 2025-2030 ($ million)
Data Table on Others - Market size and forecast 2025-2030 ($ million)
Chart on Others - Year-over-year growth 2025-2030 (%)
Data Table on Others - Year-over-year growth 2025-2030 (%)

10.7 Market opportunity by Application

Market opportunity by Application ($ million)
Data Table on Market opportunity by Application ($ million)

11. Customer Landscape

11.1 Customer landscape overview

Analysis of price sensitivity, lifecycle, customer purchase basket, adoption rates, and purchase criteria

12. Geographic Landscape

12.1 Geographic segmentation

Chart on Market share by geography 2025-2030 (%)
Data Table on Market share by geography 2025-2030 (%)

12.2 Geographic comparison

Chart on Geographic comparison
Data Table on Geographic comparison

12.3 North America - Market size and forecast 2025-2030

Chart on North America - Market size and forecast 2025-2030 ($ million)
Data Table on North America - Market size and forecast 2025-2030 ($ million)
Chart on North America - Year-over-year growth 2025-2030 (%)
Data Table on North America - Year-over-year growth 2025-2030 (%)
Chart on Regional Comparison - North America
Data Table on Regional Comparison - North America

12.3.1 US - Market size and forecast 2025-2030

Chart on US - Market size and forecast 2025-2030 ($ million)
Data Table on US - Market size and forecast 2025-2030 ($ million)
Chart on US - Year-over-year growth 2025-2030 (%)
Data Table on US - Year-over-year growth 2025-2030 (%)

12.3.2 Canada - Market size and forecast 2025-2030

Chart on Canada - Market size and forecast 2025-2030 ($ million)
Data Table on Canada - Market size and forecast 2025-2030 ($ million)
Chart on Canada - Year-over-year growth 2025-2030 (%)
Data Table on Canada - Year-over-year growth 2025-2030 (%)

12.3.3 Mexico - Market size and forecast 2025-2030

Chart on Mexico - Market size and forecast 2025-2030 ($ million)
Data Table on Mexico - Market size and forecast 2025-2030 ($ million)
Chart on Mexico - Year-over-year growth 2025-2030 (%)
Data Table on Mexico - Year-over-year growth 2025-2030 (%)

12.4 Europe - Market size and forecast 2025-2030

Chart on Europe - Market size and forecast 2025-2030 ($ million)
Data Table on Europe - Market size and forecast 2025-2030 ($ million)
Chart on Europe - Year-over-year growth 2025-2030 (%)
Data Table on Europe - Year-over-year growth 2025-2030 (%)
Chart on Regional Comparison - Europe
Data Table on Regional Comparison - Europe

12.4.1 Germany - Market size and forecast 2025-2030

Chart on Germany - Market size and forecast 2025-2030 ($ million)
Data Table on Germany - Market size and forecast 2025-2030 ($ million)
Chart on Germany - Year-over-year growth 2025-2030 (%)
Data Table on Germany - Year-over-year growth 2025-2030 (%)

12.4.2 UK - Market size and forecast 2025-2030

Chart on UK - Market size and forecast 2025-2030 ($ million)
Data Table on UK - Market size and forecast 2025-2030 ($ million)
Chart on UK - Year-over-year growth 2025-2030 (%)
Data Table on UK - Year-over-year growth 2025-2030 (%)

12.4.3 France - Market size and forecast 2025-2030

Chart on France - Market size and forecast 2025-2030 ($ million)
Data Table on France - Market size and forecast 2025-2030 ($ million)
Chart on France - Year-over-year growth 2025-2030 (%)
Data Table on France - Year-over-year growth 2025-2030 (%)

12.4.4 Italy - Market size and forecast 2025-2030

Chart on Italy - Market size and forecast 2025-2030 ($ million)
Data Table on Italy - Market size and forecast 2025-2030 ($ million)
Chart on Italy - Year-over-year growth 2025-2030 (%)
Data Table on Italy - Year-over-year growth 2025-2030 (%)

12.4.5 Spain - Market size and forecast 2025-2030

Chart on Spain - Market size and forecast 2025-2030 ($ million)
Data Table on Spain - Market size and forecast 2025-2030 ($ million)
Chart on Spain - Year-over-year growth 2025-2030 (%)
Data Table on Spain - Year-over-year growth 2025-2030 (%)

12.4.6 The Netherlands - Market size and forecast 2025-2030

Chart on The Netherlands - Market size and forecast 2025-2030 ($ million)
Data Table on The Netherlands - Market size and forecast 2025-2030 ($ million)
Chart on The Netherlands - Year-over-year growth 2025-2030 (%)
Data Table on The Netherlands - Year-over-year growth 2025-2030 (%)

12.5 Asia - Market size and forecast 2025-2030

Chart on Asia - Market size and forecast 2025-2030 ($ million)
Data Table on Asia - Market size and forecast 2025-2030 ($ million)
Chart on Asia - Year-over-year growth 2025-2030 (%)
Data Table on Asia - Year-over-year growth 2025-2030 (%)
Chart on Regional Comparison - Asia
Data Table on Regional Comparison - Asia

12.5.1 China - Market size and forecast 2025-2030

Chart on China - Market size and forecast 2025-2030 ($ million)
Data Table on China - Market size and forecast 2025-2030 ($ million)
Chart on China - Year-over-year growth 2025-2030 (%)
Data Table on China - Year-over-year growth 2025-2030 (%)

12.5.2 India - Market size and forecast 2025-2030

Chart on India - Market size and forecast 2025-2030 ($ million)
Data Table on India - Market size and forecast 2025-2030 ($ million)
Chart on India - Year-over-year growth 2025-2030 (%)
Data Table on India - Year-over-year growth 2025-2030 (%)

12.5.3 Japan - Market size and forecast 2025-2030

Chart on Japan - Market size and forecast 2025-2030 ($ million)
Data Table on Japan - Market size and forecast 2025-2030 ($ million)
Chart on Japan - Year-over-year growth 2025-2030 (%)
Data Table on Japan - Year-over-year growth 2025-2030 (%)

12.5.4 South Korea - Market size and forecast 2025-2030

Chart on South Korea - Market size and forecast 2025-2030 ($ million)
Data Table on South Korea - Market size and forecast 2025-2030 ($ million)
Chart on South Korea - Year-over-year growth 2025-2030 (%)
Data Table on South Korea - Year-over-year growth 2025-2030 (%)

12.5.5 Indonesia - Market size and forecast 2025-2030

Chart on Indonesia - Market size and forecast 2025-2030 ($ million)
Data Table on Indonesia - Market size and forecast 2025-2030 ($ million)
Chart on Indonesia - Year-over-year growth 2025-2030 (%)
Data Table on Indonesia - Year-over-year growth 2025-2030 (%)

12.5.6 Thailand - Market size and forecast 2025-2030

Chart on Thailand - Market size and forecast 2025-2030 ($ million)
Data Table on Thailand - Market size and forecast 2025-2030 ($ million)
Chart on Thailand - Year-over-year growth 2025-2030 (%)
Data Table on Thailand - Year-over-year growth 2025-2030 (%)

12.6 Rest of World (ROW) - Market size and forecast 2025-2030

Chart on Rest of World (ROW) - Market size and forecast 2025-2030 ($ million)
Data Table on Rest of World (ROW) - Market size and forecast 2025-2030 ($ million)
Chart on Rest of World (ROW) - Year-over-year growth 2025-2030 (%)
Data Table on Rest of World (ROW) - Year-over-year growth 2025-2030 (%)
Chart on Regional Comparison - Rest of World (ROW)
Data Table on Regional Comparison - Rest of World (ROW)

12.6.1 Brazil - Market size and forecast 2025-2030

Chart on Brazil - Market size and forecast 2025-2030 ($ million)
Data Table on Brazil - Market size and forecast 2025-2030 ($ million)
Chart on Brazil - Year-over-year growth 2025-2030 (%)
Data Table on Brazil - Year-over-year growth 2025-2030 (%)

12.6.2 Saudi Arabia - Market size and forecast 2025-2030

Chart on Saudi Arabia - Market size and forecast 2025-2030 ($ million)
Data Table on Saudi Arabia - Market size and forecast 2025-2030 ($ million)
Chart on Saudi Arabia - Year-over-year growth 2025-2030 (%)
Data Table on Saudi Arabia - Year-over-year growth 2025-2030 (%)

12.6.3 UAE - Market size and forecast 2025-2030

Chart on UAE - Market size and forecast 2025-2030 ($ million)
Data Table on UAE - Market size and forecast 2025-2030 ($ million)
Chart on UAE - Year-over-year growth 2025-2030 (%)
Data Table on UAE - Year-over-year growth 2025-2030 (%)

12.6.4 Turkey - Market size and forecast 2025-2030

Chart on Turkey - Market size and forecast 2025-2030 ($ million)
Data Table on Turkey - Market size and forecast 2025-2030 ($ million)
Chart on Turkey - Year-over-year growth 2025-2030 (%)
Data Table on Turkey - Year-over-year growth 2025-2030 (%)

12.6.5 Argentina - Market size and forecast 2025-2030

Chart on Argentina - Market size and forecast 2025-2030 ($ million)
Data Table on Argentina - Market size and forecast 2025-2030 ($ million)
Chart on Argentina - Year-over-year growth 2025-2030 (%)
Data Table on Argentina - Year-over-year growth 2025-2030 (%)

12.6.6 Colombia - Market size and forecast 2025-2030

Chart on Colombia - Market size and forecast 2025-2030 ($ million)
Data Table on Colombia - Market size and forecast 2025-2030 ($ million)
Chart on Colombia - Year-over-year growth 2025-2030 (%)
Data Table on Colombia - Year-over-year growth 2025-2030 (%)

12.6.7 South Africa - Market size and forecast 2025-2030

Chart on South Africa - Market size and forecast 2025-2030 ($ million)
Data Table on South Africa - Market size and forecast 2025-2030 ($ million)
Chart on South Africa - Year-over-year growth 2025-2030 (%)
Data Table on South Africa - Year-over-year growth 2025-2030 (%)

12.6.8 Israel - Market size and forecast 2025-2030

Chart on Israel - Market size and forecast 2025-2030 ($ million)
Data Table on Israel - Market size and forecast 2025-2030 ($ million)
Chart on Israel - Year-over-year growth 2025-2030 (%)
Data Table on Israel - Year-over-year growth 2025-2030 (%)

12.7 Market opportunity by geography

Market opportunity by geography ($ million)
Data Tables on Market opportunity by geography ($ million)

13. Drivers, Challenges, and Opportunity

13.1 Market drivers

Ascendancy of precision oncology and proliferation of targeted therapies
Technological advancements and declining costs of next-generation sequencing
Expanding clinical applications beyond oncology in hereditary and rare diseases

13.2 Market challenges

Complex and fragmented regulatory and reimbursement landscape
Addressing complexity of data interpretation and demonstrating clinical utility
Rising competition from broad-spectrum sequencing technologies

13.3 Impact of drivers and challenges

Impact of drivers and challenges in 2025 and 2030

13.4 Market opportunities

Convergence of pan-cancer profiling and multi-omics analysis
Rise of AI-powered customization and rapid panel design
Expansion of non-oncology applications, led in pharmacogenomics

14. Competitive Landscape

14.1 Overview

14.2

Overview on criticality of inputs and factors of differentiation

14.3 Landscape disruption

Overview on factors of disruption

14.4 Industry risks

Impact of key risks on business

15. Competitive Analysis

15.1 Companies profiled

Companies covered

15.2 Company ranking index

15.3 Market positioning of companies

Matrix on companies position and classification

15.4 Agilent Technologies Inc.

Agilent Technologies Inc. - Overview
Agilent Technologies Inc. - Business segments
Agilent Technologies Inc. - Key news
Agilent Technologies Inc. - Key offerings
Agilent Technologies Inc. - Segment focus
SWOT

15.5 Azenta Inc.

Azenta Inc. - Overview
Azenta Inc. - Business segments
Azenta Inc. - Key news
Azenta Inc. - Key offerings
Azenta Inc. - Segment focus
SWOT

15.6 BGI Group

BGI Group - Overview
BGI Group - Product / Service
BGI Group - Key offerings
SWOT

15.7 Centogene N.V.

Centogene N.V. - Overview
Centogene N.V. - Product / Service
Centogene N.V. - Key offerings
SWOT

15.8 Danaher Corp.

Danaher Corp. - Overview
Danaher Corp. - Business segments
Danaher Corp. - Key news
Danaher Corp. - Key offerings
Danaher Corp. - Segment focus
SWOT

15.9 Eurofins Scientific SE

Eurofins Scientific SE - Overview
Eurofins Scientific SE - Business segments
Eurofins Scientific SE - Key offerings
Eurofins Scientific SE - Segment focus
SWOT

15.10 F. Hoffmann La Roche Ltd.

F. Hoffmann La Roche Ltd. - Overview
F. Hoffmann La Roche Ltd. - Business segments
F. Hoffmann La Roche Ltd. - Key news
F. Hoffmann La Roche Ltd. - Key offerings
F. Hoffmann La Roche Ltd. - Segment focus
SWOT

15.11 Fagron NV

Fagron NV - Overview
Fagron NV - Business segments
Fagron NV - Key offerings
Fagron NV - Segment focus
SWOT

15.12 Illumina Inc.

Illumina Inc. - Overview
Illumina Inc. - Business segments
Illumina Inc. - Key news
Illumina Inc. - Key offerings
Illumina Inc. - Segment focus
SWOT

15.13 Novogene Co. Ltd.

Novogene Co. Ltd. - Overview
Novogene Co. Ltd. - Business segments
Novogene Co. Ltd. - Key offerings
Novogene Co. Ltd. - Segment focus
SWOT

15.14 OPKO Health Inc.

OPKO Health Inc. - Overview
OPKO Health Inc. - Business segments
OPKO Health Inc. - Key offerings
OPKO Health Inc. - Segment focus
SWOT

15.15 Oxford Nanopore Technologies

Oxford Nanopore Technologies - Overview
Oxford Nanopore Technologies - Product / Service
Oxford Nanopore Technologies - Key offerings
SWOT

15.16 QIAGEN N.V.

QIAGEN N.V. - Overview
QIAGEN N.V. - Product / Service
QIAGEN N.V. - Key news
QIAGEN N.V. - Key offerings
SWOT

15.17 Quest Diagnostics Inc.

Quest Diagnostics Inc. - Overview
Quest Diagnostics Inc. - Business segments
Quest Diagnostics Inc. - Key offerings
Quest Diagnostics Inc. - Segment focus
SWOT

15.18 Thermo Fisher Scientific Inc.

Thermo Fisher Scientific Inc. - Overview
Thermo Fisher Scientific Inc. - Business segments
Thermo Fisher Scientific Inc. - Key news
Thermo Fisher Scientific Inc. - Key offerings
Thermo Fisher Scientific Inc. - Segment focus
SWOT

16. Appendix

16.1 Scope of the report

Market definition
Objectives
Notes and caveats

16.2 Inclusions and exclusions checklist

Inclusions checklist
Exclusions checklist

16.3 Currency conversion rates for US$

16.4 Research methodology

16.5 Data procurement

Information sources

16.6 Data validation

16.7 Validation techniques employed for market sizing

16.8 Data synthesis

16.9 360 degree market analysis

16.10 List of abbreviations

Research Methodology

Technavio presents a detailed picture of the market by way of study, synthesis, and summation of data from multiple sources. The analysts have presented the various facets of the market with a particular focus on identifying the key industry influencers. The data thus presented is comprehensive, reliable, and the result of extensive research, both primary and secondary.

INFORMATION SOURCES

Primary sources

  • Manufacturers and suppliers
  • Channel partners
  • Industry experts
  • Strategic decision makers

Secondary sources

  • Industry journals and periodicals
  • Government data
  • Financial reports of key industry players
  • Historical data
  • Press releases

DATA ANALYSIS

Data Synthesis

  • Collation of data
  • Estimation of key figures
  • Analysis of derived insights

Data Validation

  • Triangulation with data models
  • Reference against proprietary databases
  • Corroboration with industry experts

REPORT WRITING

Qualitative

  • Market drivers
  • Market challenges
  • Market trends
  • Five forces analysis

Quantitative

  • Market size and forecast
  • Market segmentation
  • Geographical insights
  • Competitive landscape

Interested in this report?

Get your sample now to see our research methodology and insights!

Download Now

Frequently Asked Questions

Gene Panel market growth will increase by USD 7814.1 million during 2026-2030.

The Gene Panel market is expected to grow at a CAGR of 23.6% during 2026-2030.

Gene Panel market is segmented by Product (Small panel testing, Large panel testing) Technique (Amplicon, Hybridization) Application (Oncology, Genetic disorders, Pharmacogenomics, Others)

Agilent Technologies Inc., Azenta Inc., BGI Group, Centogene N.V., Color Health Inc., Danaher Corp., Eurofins Scientific SE, F. Hoffmann La Roche Ltd., Fagron NV, GenXPro GmbH, Illumina Inc., MedGenome Labs Ltd., MGZ Medical Genetics Center, Novogene Co. Ltd., OPKO Health Inc., Oxford Nanopore Technologies, QIAGEN N.V., Quest Diagnostics Inc., Thermo Fisher Scientific Inc. are a few of the key vendors in the Gene Panel market.

North America will register the highest growth rate of 42.6% among the other regions. Therefore, the Gene Panel market in North America is expected to garner significant business opportunities for the vendors during the forecast period.

US, Canada, Mexico, Germany, UK, France, Italy, Spain, The Netherlands, China, India, Japan, South Korea, Indonesia, Thailand, Brazil, Saudi Arabia, UAE, Turkey, Argentina, Colombia, South Africa, Israel

  • Ascendancy of precision oncology and proliferation of targeted therapies is the driving factor this market.

The Gene Panel market vendors should focus on grabbing business opportunities from the Product segment as it accounted for the largest market share in the base year.