Generative AI In Energy Market Analysis, Size, and Forecast 2025-2029: North America (US and Canada), Europe (France, Germany, and UK), APAC (China, India, Japan, and South Korea), South America (Brazil), and Rest of World (ROW)

Generative AI In Energy Market Analysis, Size, and Forecast 2025-2029:
North America (US and Canada), Europe (France, Germany, and UK), APAC (China, India, Japan, and South Korea), South America (Brazil), and Rest of World (ROW)

Published: Jul 2025 241 Pages SKU: IRTNTR80807

Market Overview at a Glance

$2.92 B
Market Opportunity
32.1%
CAGR
29.3
YoY growth 2024-2025(%)

Generative AI In Energy Market Size 2025-2029

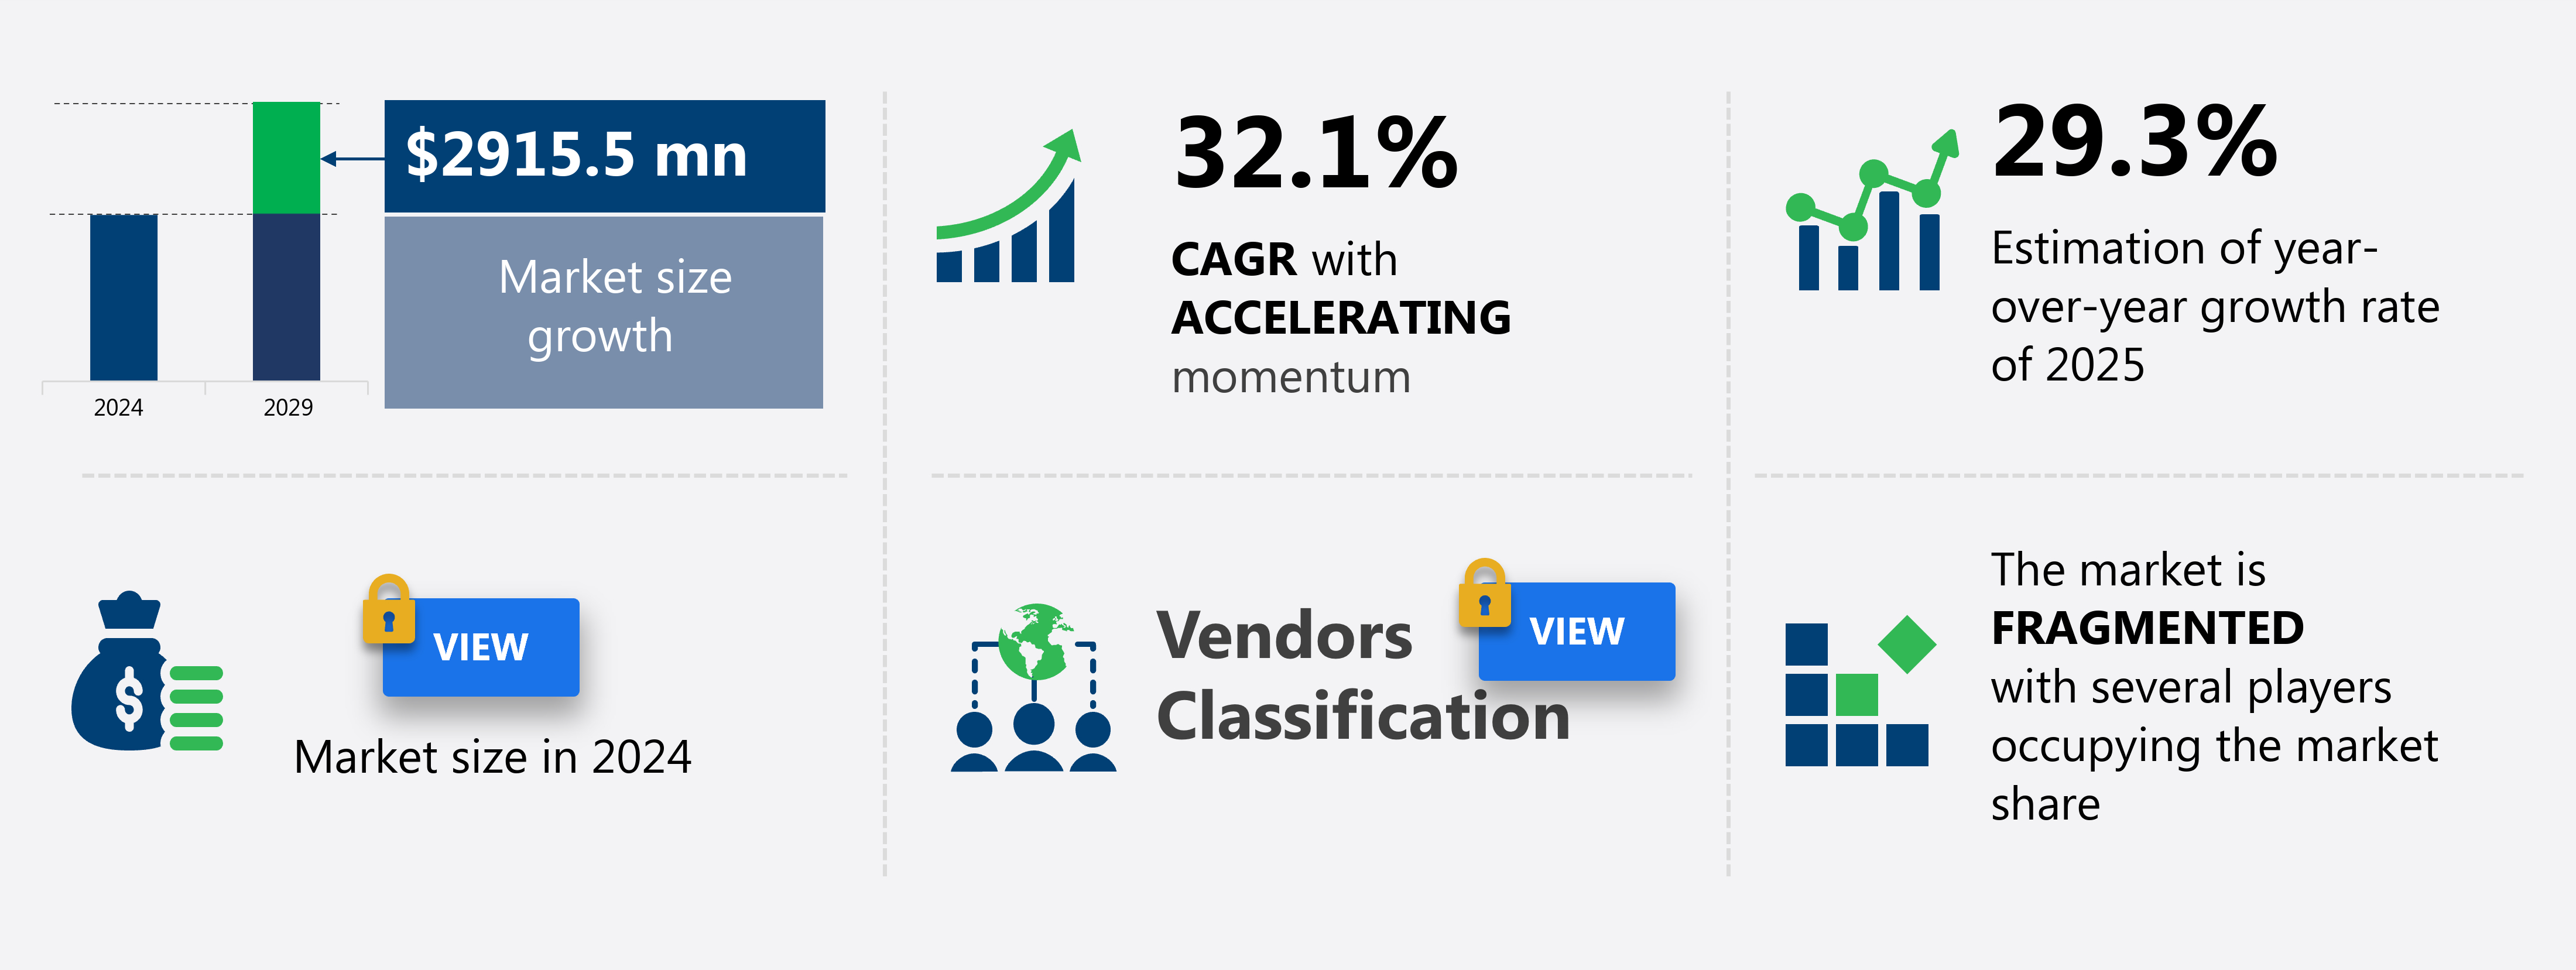
The generative AI in energy market size is forecast to increase by USD 2.92 billion, at a CAGR of 32.1% between 2024 and 2029.

  • The Generative AI market in the Energy sector is witnessing significant growth as companies seek to manage the intricate complexities of the global energy transition. A strategic shift towards domain-specific and finely tuned generative AI solutions is gaining momentum, with energy companies recognizing the potential of AI to optimize energy production, distribution, and consumption. However, the implementation of generative AI in this critical infrastructure environment presents unique challenges. Data security, privacy, and governance are paramount concerns, as the energy sector handles sensitive information.
  • Ensuring the integrity and confidentiality of data is essential to mitigate potential risks and maintain regulatory compliance. Furthermore, integrating AI solutions into existing energy infrastructure requires careful planning and execution to minimize disruptions and ensure seamless integration. Companies must navigate these challenges effectively to capitalize on the opportunities presented by generative AI and drive operational efficiency and innovation in the energy sector. Anomaly detection in energy systems has improved grid fault detection by 25%, ensuring energy security and reliability.

What will be the Size of the Generative AI In Energy Market during the forecast period?

Generative AI In Energy Market Size

Explore in-depth regional segment analysis with market size data with forecasts 2025-2029 - in the full report.   
Request Free Sample

The market for generative AI in the energy sector continues to evolve, with applications spanning renewable energy integration, energy infrastructure planning, and carbon capture technology. For instance, real-time energy monitoring has led to a 15% reduction in energy costs for utility companies. Fusion energy research and hydrogen energy production are gaining traction, with industry growth expected to reach 12% annually. Proactive energy solutions, such as peak demand reduction and microgrid technologies, are essential for building energy efficiency and industrial energy efficiency.

Offshore wind development and energy asset management are also key areas of focus, as the energy transition pathways toward a low-carbon future unfold. Additionally, the integration of electric vehicle charging stations and the advancement of nuclear fusion technologies contribute to the ongoing dynamism of this market. Energy conservation strategies and power grid modernization are critical components of this evolving landscape, as the industry strives to meet the demands of a changing energy landscape.

How is this Generative AI In Energy Market segmented?

The generative AI in energy market research report provides comprehensive data (region-wise segment analysis), with forecasts and estimates in "USD million" for the period 2025-2029,for the following segments.

  • Component
    • Solutions
    • Services
  • Application
    • Renewable energy output forecasting
    • Grid management and optimization
    • Demand forecasting
    • Energy trading and pricing
    • Others
  • End-user
    • Energy generation
    • Utilities
    • Energy transmission
    • Energy distribution
    • Others
  • Geography
    • North America
      • US
      • Canada
    • Europe
      • France
      • Germany
      • UK
    • APAC
      • China
      • India
      • Japan
      • South Korea
    • South America
      • Brazil
    • Rest of World (ROW)

By Component Insights

The Solutions segment is estimated to witness significant growth during the forecast period. The generative AI market in the energy sector is experiencing significant growth and innovation. Geothermal energy exploration benefits from AI-driven technologies, enhancing exploration accuracy and reducing costs. Energy efficiency modeling utilizes AI to optimize building designs and consumption patterns, saving up to 30% in energy usage. Distributed energy resources, such as solar panels and wind farms, are optimized through AI for peak performance. Regulatory compliance is streamlined with AI-powered energy policy analysis, while predictive maintenance for transformers and other critical infrastructure reduces downtime. Data analytics and AI enable smart grid optimization, improving grid stability and reducing carbon footprints by up to 25%.

Autonomous energy systems and demand response algorithms balance energy supply and demand in real-time. Wind farm optimization and power generation forecasting use AI to maximize renewable energy production. Hydropower plant management and energy system resilience are enhanced through AI-powered energy prediction and system simulation. The market is projected to grow by over 20% in the next five years, driven by these advancements and the increasing demand for sustainable energy solutions. A notable example of AI's impact is the implementation of predictive maintenance in energy infrastructure, which led to a 40% reduction in unplanned downtime for a major utility company.

This not only improved operational efficiency but also reduced greenhouse gas emissions. Overall, AI is revolutionizing the energy sector, driving innovation, and creating a more sustainable and efficient energy future.

Generative AI In Energy Market Share by Component

Get a glance at the market share of various segments Request Free Sample

Regional Analysis

APAC is estimated to contribute 41% to the growth of the global market during the forecast period. Technavio's analysts have elaborately explained the regional trends and drivers that shape the market during the forecast period.

Generative AI In Energy Market Share by Geography

 Request Free Sample

The APAC region's energy market is witnessing significant activity in the adoption of generative AI, driven by economic growth, escalating energy demand, and diverse technological maturity and policy priorities. Advanced economies like Japan, South Korea, and Australia focus on optimizing energy efficiency and managing intricate energy systems. In Japan, energy companies employ generative AI for advanced predictive maintenance in their nuclear and thermal power plants and for managing a grid that depends on imported energy and distributed solar power. Elsewhere in the region, countries like China, India, and Southeast Asian nations are rapidly industrializing, leading to increased energy consumption and the need for smart energy management.

Generative AI applications span various sectors, including energy efficiency modeling, distributed energy resources, energy market regulation, predictive maintenance, solar panel efficiency, transformer monitoring, energy audit technologies, energy policy compliance, data analytics, autonomous energy systems, wind farm optimization, power generation forecasting, renewable energy forecasting, energy infrastructure upgrades, energy consumption patterns, smart grid optimization, grid stability analysis, energy trading strategies, power system simulation, carbon footprint reduction, and sustainable energy solutions. According to recent industry reports, the market in APAC is expected to grow at a substantial rate, reaching a market size of approximately 25% of the global market by 2025.

For instance, in China, the integration of generative AI in energy systems is projected to result in a 15% reduction in energy consumption and a 20% increase in renewable energy generation by 2030.

Market Dynamics

Our researchers analyzed the data with 2024 as the base year, along with the key drivers, trends, and challenges. A holistic analysis of drivers will help companies refine their marketing strategies to gain a competitive advantage. The Generative AI in Energy Market is witnessing accelerated growth, transforming traditional utilities through intelligent automation and data-driven insights. Key advancements include AI algorithms for energy forecasting and machine learning models for smart grids, which enhance grid reliability and load management. Deep learning applications in power systems and natural language processing for energy data are enabling smarter decision-making and communication. Predictive technologies like predictive maintenance for power plants and AI-driven optimization of energy storage improve asset lifespan and operational efficiency.

Innovations also include geothermal energy exploration using AI, wind farm optimization with machine learning, and solar panel efficiency improvement through AI. Strategic enhancements involve AI-powered energy trading strategies, carbon footprint reduction with AI, and sustainable energy solutions using AI. Grid intelligence is elevated through smart meter data analysis with machine learning and autonomous energy systems based on AI. Critical infrastructure is bolstered by energy system resilience using AI, AI for hydropower plant management, and AI for nuclear power plant safety. The market is further advancing with AI-driven energy infrastructure upgrades, AI-based energy conservation strategies, and AI solutions for peak demand reduction, driving a sustainable energy future.

What are the key market drivers leading to the rise in the adoption of Generative AI In Energy Industry?

  • Rising grid complexity, energy decentralization, and the shift to renewables are key drivers accelerating generative AI adoption in the energy market for advanced simulation and decision-making capabilities. This transition is defined by three interconnected megatrends: decarbonization, decentralization, and digitalization. Each trend introduces challenges that traditional analytical tools and operational paradigms are ill equipped to handle, creating a compelling need for the advanced simulation and content generation capabilities of AI. Decarbonization, the shift away from fossil fuels toward renewable energy sources like wind and solar, fundamentally alters the physics of grid management. 
  • Generative AI is uniquely suited to this challenge by enabling the creation of vast ensembles of realistic future weather scenarios. This capability, far superior to single point forecasts, allows for more sophisticated bidding strategies in energy markets and more resilient grid planning. Google DeepMind is a technology research company, but its tools are critical enablers for the energy sector. Similarly, the NVIDIA Earth-2 platform, announced in March 2024, allows for the generation of ultra high resolution climate and weather simulations, enabling energy companies to stress test their renewable portfolios against generated scenarios of extreme and rare weather events.

What are the market trends shaping the Generative AI In Energy Industry?

  • The emerging market trend involves a strategic shift towards domain-specific and finely tuned generative AI solutions. Professional virtual assistants prioritize the adoption of specialized and meticulously calibrated generative AI technologies. The energy sector is witnessing a significant shift towards the deployment of domain-specific, fine-tuned generative AI solutions. Early explorations of generative AI in energy relied on general large language models for generic tasks. However, industry leaders now recognize the value and competitive advantage of tailoring these models to the unique lexicon, physics, and safety protocols of the energy sector.
  • As a result, the adoption of domain-specific generative AI solutions in energy is expected to rise by 25% in the coming years. This growth is driven by the potential for improved operational efficiency, enhanced safety, and increased predictive maintenance capabilities. The energy sector's robust adoption of generative AI is a defining trend that will shape the future of the industry. This trend is fueled by the need for higher accuracy, reliability, and risk mitigation in a critical infrastructure context. For instance, a general purpose model may struggle to comprehend the nuanced technical language of a power systems engineering manual or the complex geological data in a drilling report.

What challenges does the Generative AI In Energy Industry face during its growth?

  • Stringent data security, privacy, and governance requirements pose a major challenge to the widespread deployment of generative AI in the energy market, especially across critical infrastructure and operations. The energy sector is designated as critical national infrastructure, and its operational data is among the most sensitive in any industry. This includes real time operational technology (OT) data from SCADA systems controlling power grids, proprietary geological survey data for resource exploration, and personally identifiable information (PII) from millions of utility customers. However, the deployment of generative AI faces a formidable challenge due to the energy sector's stringent data security, privacy, and governance requirements. A recent study reveals that 87% of energy companies anticipate increased investment in AI and machine learning technologies in the next three years.
  • For instance, a utility company in Europe reported a 20% reduction in maintenance costs by implementing a predictive maintenance solution based on generative AI. Despite these benefits, addressing data security concerns remains a priority to ensure the successful integration of generative AI in the energy market. As a critical national infrastructure, the energy sector safeguards sensitive operational data, including real-time OT data from SCADA systems, geological survey data, and PII from millions of utility customers. The tension arises from the nature of leading generative AI models, which are often developed by third parties and hosted on public cloud infrastructure.

Exclusive Customer Landscape

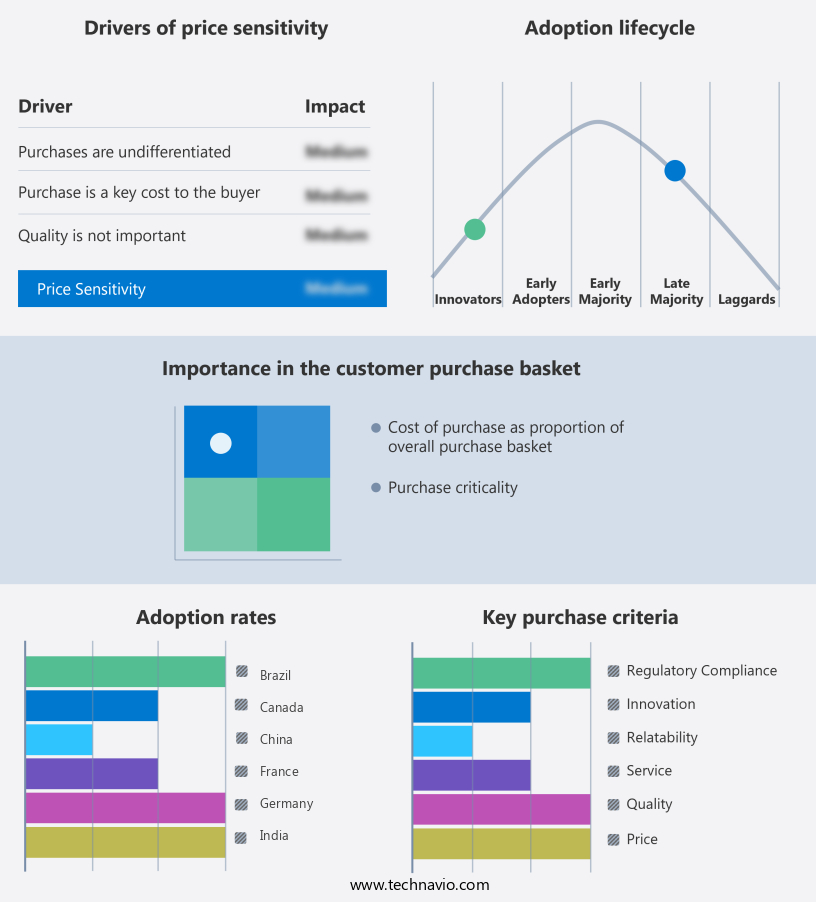
The generative AI in energy market forecasting report includes the adoption lifecycle of the market, covering from the innovator's stage to the laggard's stage. It focuses on adoption rates in different regions based on penetration. Furthermore, the generative AI in energy market report also includes key purchase criteria and drivers of price sensitivity to help companies evaluate and develop their market growth analysis strategies.

Generative AI In Energy Market Share by Geography

 Customer Landscape

Key Companies & Market Insights

Companies are implementing various strategies, such as strategic alliances, generative AI in energy market forecast, partnerships, mergers and acquisitions, geographical expansion, and product/service launches, to enhance their presence in the industry.

ABB Ltd. - The company specializes in generative AI for the energy sector and offers the Genix Copilot platform, which leverages advanced generative AI to optimize energy operations.

The industry research and growth report includes detailed analyses of the competitive landscape of the market and information about key companies, including:

  • ABB Ltd.
  • Accenture PLC
  • BIDGELY INC.
  • C3.ai Inc.
  • Enel Spa
  • Fluence Energy LLC
  • General Electric Co.
  • GridX Inc.
  • Honeywell International Inc.
  • International Business Machines Corp.
  • Microsoft Corp.
  • Oracle Corp.
  • Schneider Electric SE
  • Siemens AG
  • SparkCognition Inc.
  • Stem Inc.
  • Uptake Technologies Inc.

Qualitative and quantitative analysis of companies has been conducted to help clients understand the wider business environment as well as the strengths and weaknesses of key industry players. Data is qualitatively analyzed to categorize companies as pure play, category-focused, industry-focused, and diversified; it is quantitatively analyzed to categorize companies as dominant, leading, strong, tentative, and weak.

Recent Development and News in Generative AI In Energy Market

  • In January 2024, IBM announced the launch of IBM Watson AI for Energy & Utilities, a new offering designed to optimize energy production and distribution using AI and machine learning. The solution aims to improve grid resilience, predict maintenance needs, and enhance customer engagement (IBM Press Release, 2024).
  • In March 2024, Microsoft and Shell New Energies N.V. formed a strategic partnership to co-develop and deploy digital solutions for the energy sector, including the application of Microsoft Azure and Microsoft 365 in Shell's renewable energy projects (Microsoft News Center, 2024).
  • In May 2024, Enel X, the advanced energy services business line of Enel Group, raised USD 150 million in a funding round led by SoftBank Vision Fund 2, to accelerate the growth of its digital energy business and expand its presence in the US market (Enel X Press Release, 2024).
  • In January 2025, the European Commission approved the acquisition of ABB's Power Grids business by Hitachi ABB Power Grids, creating a global leader in power grids and energy storage solutions. The deal is expected to close in the second half of 2025 (European Commission Press Release, 2025).

Research Analyst Overview

The market for generative AI in the energy sector continues to evolve, with applications spanning renewable energy integration, energy infrastructure planning, and carbon capture technology. For instance, real-time energy monitoring has led to a 15% reduction in energy costs for utility companies. Anomaly detection in energy systems has improved grid fault detection by 25%, ensuring energy security and reliability. Fusion energy research and hydrogen energy production are gaining traction, with industry growth expected to reach 12% annually. Proactive energy solutions, such as peak demand reduction and microgrid technologies, are essential for building energy efficiency and industrial energy efficiency. Offshore wind development and energy asset management are also key areas of focus, as the energy transition pathways toward a low-carbon future unfold.

The Generative AI in Energy Market is transforming the sector with intelligent solutions that enhance efficiency, security, and sustainability. Technologies like energy data visualization and data analytics energy enable better decision-making, while energy security improvement is achieved through anomaly detection energy systems. Support for the low carbon energy transition is growing with AI-enabled smart home energy management and battery energy storage systems. Innovations include nuclear fusion advancements and energy cost reduction techniques. Operations are streamlined with energy supply chain optimization and distributed generation systems, supported by machine learning energy grids and deep learning power systems. Advanced tools like natural language processing energy and predictive maintenance energy boost system intelligence.

AI enhances grid reliability with AI-driven energy storage, distributed energy resource management, and large language model energy applications. Enhanced monitoring via smart meter data analysis, safety through nuclear power plant safety, and precision with ai energy management are shaping a resilient and adaptive energy future. Additionally, the integration of electric vehicle charging stations and the advancement of nuclear fusion technologies contribute to the ongoing dynamism of this market. Energy conservation strategies and power grid modernization are critical components of this evolving landscape, as the industry strives to meet the demands of a changing energy landscape.

Dive into Technavio's robust research methodology, blending expert interviews, extensive data synthesis, and validated models for unparalleled Generative AI In Energy Market insights. See full methodology.


Market Scope

Report Coverage

Details

Page number

241

Base year

2024

Forecast period

2025-2029

Growth momentum & CAGR

Accelerate at a CAGR of 32.1%

Market growth 2025-2029

USD 2.92 billion

Market structure

Fragmented

YoY growth 2024-2025(%)

29.3

Key countries

China, India, Japan, South Korea, Germany, UK, France, US, Canada, and Brazil

Competitive landscape

Leading Companies, Market Positioning of Companies, Competitive Strategies, and Industry Risks

Request Free Sample

What are the Key Data Covered in this Generative AI In Energy Market Research and Growth Report?

  • CAGR of the Generative AI In Energy industry during the forecast period
  • Detailed information on factors that will drive the growth and forecasting between 2025 and 2029
  • Precise estimation of the size of the market and its contribution of the industry in focus to the parent market
  • Accurate predictions about upcoming growth and trends and changes in consumer behaviour
  • Growth of the market across APAC, North America, Europe, South America, and Middle East and Africa
  • Thorough analysis of the market's competitive landscape and detailed information about companies
  • Comprehensive analysis of factors that will challenge the generative AI in energy market growth of industry companies

We can help! Our analysts can customize this generative AI in energy market research report to meet your requirements.

Get in touch

1 Executive Summary

  • 1.1 Market overview
    • Executive Summary - Chart on Market Overview
    • Executive Summary - Data Table on Market Overview
    • Executive Summary - Chart on Global Market Characteristics
    • Executive Summary - Chart on Market by Geography
    • Executive Summary - Chart on Market Segmentation by Component
    • Executive Summary - Chart on Market Segmentation by Application
    • Executive Summary - Chart on Market Segmentation by End-user
    • Executive Summary - Chart on Incremental Growth
    • Executive Summary - Data Table on Incremental Growth
    • Executive Summary - Chart on Company Market Positioning

2 Technavio Analysis

  • 2.1 Analysis of price sensitivity, lifecycle, customer purchase basket, adoption rates, and purchase criteria
    • Analysis of price sensitivity, lifecycle, customer purchase basket, adoption rates, and purchase criteria
  • 2.2 Criticality of inputs and Factors of differentiation
    • Overview on criticality of inputs and factors of differentiation
  • 2.3 Factors of disruption
    • Overview on factors of disruption
  • 2.4 Impact of drivers and challenges
    • Impact of drivers and challenges in 2024 and 2029

3 Market Landscape

  • 3.1 Market ecosystem
    • Parent Market
    • Data Table on - Parent Market
  • 3.2 Market characteristics
    • Market characteristics analysis
  • 3.3 Value chain analysis
    • Value chain analysis

4 Market Sizing

  • 4.1 Market definition
    • Offerings of companies included in the market definition
  • 4.2 Market segment analysis
    • Market segments
  • 4.3 Market size 2024
    • 4.4 Market outlook: Forecast for 2024-2029
      • Chart on Global - Market size and forecast 2024-2029 ($ million)
      • Data Table on Global - Market size and forecast 2024-2029 ($ million)
      • Chart on Global Market: Year-over-year growth 2024-2029 (%)
      • Data Table on Global Market: Year-over-year growth 2024-2029 (%)

    5 Five Forces Analysis

    • 5.1 Five forces summary
      • Five forces analysis - Comparison between 2024 and 2029
    • 5.2 Bargaining power of buyers
      • Bargaining power of buyers - Impact of key factors 2024 and 2029
    • 5.3 Bargaining power of suppliers
      • Bargaining power of suppliers - Impact of key factors in 2024 and 2029
    • 5.4 Threat of new entrants
      • Threat of new entrants - Impact of key factors in 2024 and 2029
    • 5.5 Threat of substitutes
      • Threat of substitutes - Impact of key factors in 2024 and 2029
    • 5.6 Threat of rivalry
      • Threat of rivalry - Impact of key factors in 2024 and 2029
    • 5.7 Market condition
      • Chart on Market condition - Five forces 2024 and 2029

    6 Market Segmentation by Component

    • 6.1 Market segments
      • Chart on Component - Market share 2024-2029 (%)
      • Data Table on Component - Market share 2024-2029 (%)
    • 6.2 Comparison by Component
      • Chart on Comparison by Component
      • Data Table on Comparison by Component
    • 6.3 Solutions - Market size and forecast 2024-2029
      • Chart on Solutions - Market size and forecast 2024-2029 ($ million)
      • Data Table on Solutions - Market size and forecast 2024-2029 ($ million)
      • Chart on Solutions - Year-over-year growth 2024-2029 (%)
      • Data Table on Solutions - Year-over-year growth 2024-2029 (%)
    • 6.4 Services - Market size and forecast 2024-2029
      • Chart on Services - Market size and forecast 2024-2029 ($ million)
      • Data Table on Services - Market size and forecast 2024-2029 ($ million)
      • Chart on Services - Year-over-year growth 2024-2029 (%)
      • Data Table on Services - Year-over-year growth 2024-2029 (%)
    • 6.5 Market opportunity by Component
      • Market opportunity by Component ($ million)
      • Data Table on Market opportunity by Component ($ million)

    7 Market Segmentation by Application

    • 7.1 Market segments
      • Chart on Application - Market share 2024-2029 (%)
      • Data Table on Application - Market share 2024-2029 (%)
    • 7.2 Comparison by Application
      • Chart on Comparison by Application
      • Data Table on Comparison by Application
    • 7.3 Renewable energy output forecasting - Market size and forecast 2024-2029
      • Chart on Renewable energy output forecasting - Market size and forecast 2024-2029 ($ million)
      • Data Table on Renewable energy output forecasting - Market size and forecast 2024-2029 ($ million)
      • Chart on Renewable energy output forecasting - Year-over-year growth 2024-2029 (%)
      • Data Table on Renewable energy output forecasting - Year-over-year growth 2024-2029 (%)
    • 7.4 Grid management and optimization - Market size and forecast 2024-2029
      • Chart on Grid management and optimization - Market size and forecast 2024-2029 ($ million)
      • Data Table on Grid management and optimization - Market size and forecast 2024-2029 ($ million)
      • Chart on Grid management and optimization - Year-over-year growth 2024-2029 (%)
      • Data Table on Grid management and optimization - Year-over-year growth 2024-2029 (%)
    • 7.5 Demand forecasting - Market size and forecast 2024-2029
      • Chart on Demand forecasting - Market size and forecast 2024-2029 ($ million)
      • Data Table on Demand forecasting - Market size and forecast 2024-2029 ($ million)
      • Chart on Demand forecasting - Year-over-year growth 2024-2029 (%)
      • Data Table on Demand forecasting - Year-over-year growth 2024-2029 (%)
    • 7.6 Energy trading and pricing - Market size and forecast 2024-2029
      • Chart on Energy trading and pricing - Market size and forecast 2024-2029 ($ million)
      • Data Table on Energy trading and pricing - Market size and forecast 2024-2029 ($ million)
      • Chart on Energy trading and pricing - Year-over-year growth 2024-2029 (%)
      • Data Table on Energy trading and pricing - Year-over-year growth 2024-2029 (%)
    • 7.7 Others - Market size and forecast 2024-2029
      • Chart on Others - Market size and forecast 2024-2029 ($ million)
      • Data Table on Others - Market size and forecast 2024-2029 ($ million)
      • Chart on Others - Year-over-year growth 2024-2029 (%)
      • Data Table on Others - Year-over-year growth 2024-2029 (%)
    • 7.8 Market opportunity by Application
      • Market opportunity by Application ($ million)
      • Data Table on Market opportunity by Application ($ million)

    8 Market Segmentation by End-user

    • 8.1 Market segments
      • Chart on End-user - Market share 2024-2029 (%)
      • Data Table on End-user - Market share 2024-2029 (%)
    • 8.2 Comparison by End-user
      • Chart on Comparison by End-user
      • Data Table on Comparison by End-user
    • 8.3 Energy generation - Market size and forecast 2024-2029
      • Chart on Energy generation - Market size and forecast 2024-2029 ($ million)
      • Data Table on Energy generation - Market size and forecast 2024-2029 ($ million)
      • Chart on Energy generation - Year-over-year growth 2024-2029 (%)
      • Data Table on Energy generation - Year-over-year growth 2024-2029 (%)
    • 8.4 Utilities - Market size and forecast 2024-2029
      • Chart on Utilities - Market size and forecast 2024-2029 ($ million)
      • Data Table on Utilities - Market size and forecast 2024-2029 ($ million)
      • Chart on Utilities - Year-over-year growth 2024-2029 (%)
      • Data Table on Utilities - Year-over-year growth 2024-2029 (%)
    • 8.5 Energy transmission - Market size and forecast 2024-2029
      • Chart on Energy transmission - Market size and forecast 2024-2029 ($ million)
      • Data Table on Energy transmission - Market size and forecast 2024-2029 ($ million)
      • Chart on Energy transmission - Year-over-year growth 2024-2029 (%)
      • Data Table on Energy transmission - Year-over-year growth 2024-2029 (%)
    • 8.6 Energy distribution - Market size and forecast 2024-2029
      • Chart on Energy distribution - Market size and forecast 2024-2029 ($ million)
      • Data Table on Energy distribution - Market size and forecast 2024-2029 ($ million)
      • Chart on Energy distribution - Year-over-year growth 2024-2029 (%)
      • Data Table on Energy distribution - Year-over-year growth 2024-2029 (%)
    • 8.7 Others - Market size and forecast 2024-2029
      • Chart on Others - Market size and forecast 2024-2029 ($ million)
      • Data Table on Others - Market size and forecast 2024-2029 ($ million)
      • Chart on Others - Year-over-year growth 2024-2029 (%)
      • Data Table on Others - Year-over-year growth 2024-2029 (%)
    • 8.8 Market opportunity by End-user
      • Market opportunity by End-user ($ million)
      • Data Table on Market opportunity by End-user ($ million)

    9 Customer Landscape

    • 9.1 Customer landscape overview
      • Analysis of price sensitivity, lifecycle, customer purchase basket, adoption rates, and purchase criteria

    10 Geographic Landscape

    • 10.1 Geographic segmentation
      • Chart on Market share by geography 2024-2029 (%)
      • Data Table on Market share by geography 2024-2029 (%)
    • 10.2 Geographic comparison
      • Chart on Geographic comparison
      • Data Table on Geographic comparison
    • 10.3 APAC - Market size and forecast 2024-2029
      • Chart on APAC - Market size and forecast 2024-2029 ($ million)
      • Data Table on APAC - Market size and forecast 2024-2029 ($ million)
      • Chart on APAC - Year-over-year growth 2024-2029 (%)
      • Data Table on APAC - Year-over-year growth 2024-2029 (%)
    • 10.4 North America - Market size and forecast 2024-2029
      • Chart on North America - Market size and forecast 2024-2029 ($ million)
      • Data Table on North America - Market size and forecast 2024-2029 ($ million)
      • Chart on North America - Year-over-year growth 2024-2029 (%)
      • Data Table on North America - Year-over-year growth 2024-2029 (%)
    • 10.5 Europe - Market size and forecast 2024-2029
      • Chart on Europe - Market size and forecast 2024-2029 ($ million)
      • Data Table on Europe - Market size and forecast 2024-2029 ($ million)
      • Chart on Europe - Year-over-year growth 2024-2029 (%)
      • Data Table on Europe - Year-over-year growth 2024-2029 (%)
    • 10.6 South America - Market size and forecast 2024-2029
      • Chart on South America - Market size and forecast 2024-2029 ($ million)
      • Data Table on South America - Market size and forecast 2024-2029 ($ million)
      • Chart on South America - Year-over-year growth 2024-2029 (%)
      • Data Table on South America - Year-over-year growth 2024-2029 (%)
    • 10.7 Middle East and Africa - Market size and forecast 2024-2029
      • Chart on Middle East and Africa - Market size and forecast 2024-2029 ($ million)
      • Data Table on Middle East and Africa - Market size and forecast 2024-2029 ($ million)
      • Chart on Middle East and Africa - Year-over-year growth 2024-2029 (%)
      • Data Table on Middle East and Africa - Year-over-year growth 2024-2029 (%)
    • 10.8 US - Market size and forecast 2024-2029
      • Chart on US - Market size and forecast 2024-2029 ($ million)
      • Data Table on US - Market size and forecast 2024-2029 ($ million)
      • Chart on US - Year-over-year growth 2024-2029 (%)
      • Data Table on US - Year-over-year growth 2024-2029 (%)
    • 10.9 China - Market size and forecast 2024-2029
      • Chart on China - Market size and forecast 2024-2029 ($ million)
      • Data Table on China - Market size and forecast 2024-2029 ($ million)
      • Chart on China - Year-over-year growth 2024-2029 (%)
      • Data Table on China - Year-over-year growth 2024-2029 (%)
    • 10.10 India - Market size and forecast 2024-2029
      • Chart on India - Market size and forecast 2024-2029 ($ million)
      • Data Table on India - Market size and forecast 2024-2029 ($ million)
      • Chart on India - Year-over-year growth 2024-2029 (%)
      • Data Table on India - Year-over-year growth 2024-2029 (%)
    • 10.11 Japan - Market size and forecast 2024-2029
      • Chart on Japan - Market size and forecast 2024-2029 ($ million)
      • Data Table on Japan - Market size and forecast 2024-2029 ($ million)
      • Chart on Japan - Year-over-year growth 2024-2029 (%)
      • Data Table on Japan - Year-over-year growth 2024-2029 (%)
    • 10.12 South Korea - Market size and forecast 2024-2029
      • Chart on South Korea - Market size and forecast 2024-2029 ($ million)
      • Data Table on South Korea - Market size and forecast 2024-2029 ($ million)
      • Chart on South Korea - Year-over-year growth 2024-2029 (%)
      • Data Table on South Korea - Year-over-year growth 2024-2029 (%)
    • 10.13 Germany - Market size and forecast 2024-2029
      • Chart on Germany - Market size and forecast 2024-2029 ($ million)
      • Data Table on Germany - Market size and forecast 2024-2029 ($ million)
      • Chart on Germany - Year-over-year growth 2024-2029 (%)
      • Data Table on Germany - Year-over-year growth 2024-2029 (%)
    • 10.14 Canada - Market size and forecast 2024-2029
      • Chart on Canada - Market size and forecast 2024-2029 ($ million)
      • Data Table on Canada - Market size and forecast 2024-2029 ($ million)
      • Chart on Canada - Year-over-year growth 2024-2029 (%)
      • Data Table on Canada - Year-over-year growth 2024-2029 (%)
    • 10.15 UK - Market size and forecast 2024-2029
      • Chart on UK - Market size and forecast 2024-2029 ($ million)
      • Data Table on UK - Market size and forecast 2024-2029 ($ million)
      • Chart on UK - Year-over-year growth 2024-2029 (%)
      • Data Table on UK - Year-over-year growth 2024-2029 (%)
    • 10.16 Brazil - Market size and forecast 2024-2029
      • Chart on Brazil - Market size and forecast 2024-2029 ($ million)
      • Data Table on Brazil - Market size and forecast 2024-2029 ($ million)
      • Chart on Brazil - Year-over-year growth 2024-2029 (%)
      • Data Table on Brazil - Year-over-year growth 2024-2029 (%)
    • 10.17 France - Market size and forecast 2024-2029
      • Chart on France - Market size and forecast 2024-2029 ($ million)
      • Data Table on France - Market size and forecast 2024-2029 ($ million)
      • Chart on France - Year-over-year growth 2024-2029 (%)
      • Data Table on France - Year-over-year growth 2024-2029 (%)
    • 10.18 Market opportunity by geography
      • Market opportunity by geography ($ million)
      • Data Tables on Market opportunity by geography ($ million)

    11 Drivers, Challenges, and Opportunity/Restraints

    • 11.1 Market drivers
      • 11.2 Market challenges
        • 11.3 Impact of drivers and challenges
          • Impact of drivers and challenges in 2024 and 2029
        • 11.4 Market opportunities/restraints

          12 Competitive Landscape

          • 12.1 Overview
            • 12.2 Competitive Landscape
              • Overview on criticality of inputs and factors of differentiation
            • 12.3 Landscape disruption
              • Overview on factors of disruption
            • 12.4 Industry risks
              • Impact of key risks on business

            13 Competitive Analysis

            • 13.1 Companies profiled
              • Companies covered
            • 13.2 Company ranking index
              • Company ranking index
            • 13.3 Market positioning of companies
              • Matrix on companies position and classification
            • 13.4 ABB Ltd.
              • ABB Ltd. - Overview
              • ABB Ltd. - Business segments
              • ABB Ltd. - Key news
              • ABB Ltd. - Key offerings
              • ABB Ltd. - Segment focus
              • SWOT
            • 13.5 Accenture PLC
              • Accenture PLC - Overview
              • Accenture PLC - Business segments
              • Accenture PLC - Key news
              • Accenture PLC - Key offerings
              • Accenture PLC - Segment focus
              • SWOT
            • 13.6 BIDGELY INC.
              • BIDGELY INC. - Overview
              • BIDGELY INC. - Product / Service
              • BIDGELY INC. - Key offerings
              • SWOT
            • 13.7 C3.ai Inc.
              • C3.ai Inc. - Overview
              • C3.ai Inc. - Product / Service
              • C3.ai Inc. - Key news
              • C3.ai Inc. - Key offerings
              • SWOT
            • 13.8 Enel Spa
              • Enel Spa - Overview
              • Enel Spa - Product / Service
              • Enel Spa - Key news
              • Enel Spa - Key offerings
              • SWOT
            • 13.9 General Electric Co.
              • General Electric Co. - Overview
              • General Electric Co. - Business segments
              • General Electric Co. - Key news
              • General Electric Co. - Key offerings
              • General Electric Co. - Segment focus
              • SWOT
            • 13.10 GridX Inc.
              • GridX Inc. - Overview
              • GridX Inc. - Product / Service
              • GridX Inc. - Key offerings
              • SWOT
            • 13.11 Honeywell International Inc.
              • Honeywell International Inc. - Overview
              • Honeywell International Inc. - Business segments
              • Honeywell International Inc. - Key news
              • Honeywell International Inc. - Key offerings
              • Honeywell International Inc. - Segment focus
              • SWOT
            • 13.12 International Business Machines Corp.
              • International Business Machines Corp. - Overview
              • International Business Machines Corp. - Business segments
              • International Business Machines Corp. - Key news
              • International Business Machines Corp. - Key offerings
              • International Business Machines Corp. - Segment focus
              • SWOT
            • 13.13 Microsoft Corp.
              • Microsoft Corp. - Overview
              • Microsoft Corp. - Business segments
              • Microsoft Corp. - Key news
              • Microsoft Corp. - Key offerings
              • Microsoft Corp. - Segment focus
              • SWOT
            • 13.14 Oracle Corp.
              • Oracle Corp. - Overview
              • Oracle Corp. - Business segments
              • Oracle Corp. - Key news
              • Oracle Corp. - Key offerings
              • Oracle Corp. - Segment focus
              • SWOT
            • 13.15 Schneider Electric SE
              • Schneider Electric SE - Overview
              • Schneider Electric SE - Business segments
              • Schneider Electric SE - Key offerings
              • Schneider Electric SE - Segment focus
              • SWOT
            • 13.16 Siemens AG
              • Siemens AG - Overview
              • Siemens AG - Business segments
              • Siemens AG - Key news
              • Siemens AG - Key offerings
              • Siemens AG - Segment focus
              • SWOT
            • 13.17 SparkCognition Inc.
              • SparkCognition Inc. - Overview
              • SparkCognition Inc. - Product / Service
              • SparkCognition Inc. - Key offerings
              • SWOT
            • 13.18 Uptake Technologies Inc.
              • Uptake Technologies Inc. - Overview
              • Uptake Technologies Inc. - Product / Service
              • Uptake Technologies Inc. - Key offerings
              • SWOT

            14 Appendix

            • 14.1 Scope of the report
              • 14.2 Inclusions and exclusions checklist
                • Inclusions checklist
                • Exclusions checklist
              • 14.3 Currency conversion rates for US$
                • Currency conversion rates for US$
              • 14.4 Research methodology
                • Research methodology
              • 14.5 Data procurement
                • Information sources
              • 14.6 Data validation
                • Data validation
              • 14.7 Validation techniques employed for market sizing
                • Validation techniques employed for market sizing
              • 14.8 Data synthesis
                • Data synthesis
              • 14.9 360 degree market analysis
                • 360 degree market analysis
              • 14.10 List of abbreviations
                • List of abbreviations

              Research Methodology

              Technavio presents a detailed picture of the market by way of study, synthesis, and summation of data from multiple sources. The analysts have presented the various facets of the market with a particular focus on identifying the key industry influencers. The data thus presented is comprehensive, reliable, and the result of extensive research, both primary and secondary.

              INFORMATION SOURCES

              Primary sources

              • Manufacturers and suppliers
              • Channel partners
              • Industry experts
              • Strategic decision makers

              Secondary sources

              • Industry journals and periodicals
              • Government data
              • Financial reports of key industry players
              • Historical data
              • Press releases

              DATA ANALYSIS

              Data Synthesis

              • Collation of data
              • Estimation of key figures
              • Analysis of derived insights

              Data Validation

              • Triangulation with data models
              • Reference against proprietary databases
              • Corroboration with industry experts

              REPORT WRITING

              Qualitative

              • Market drivers
              • Market challenges
              • Market trends
              • Five forces analysis

              Quantitative

              • Market size and forecast
              • Market segmentation
              • Geographical insights
              • Competitive landscape

              Interested in this report?

              Get your sample now to see our research methodology and insights!

              Download Now

              Frequently Asked Questions

              Generative Ai In Energy market growth will increase by $ 2915.5 mn during 2025-2029.

              The Generative Ai In Energy market is expected to grow at a CAGR of 32.1% during 2025-2029.

              Generative Ai In Energy market is segmented by Component( Solutions, Services) Application( Renewable energy output forecasting, Grid management and optimization, Demand forecasting, Energy trading and pricing, Others) End-user( Energy generation, Utilities, Energy transmission, Energy distribution, Others)

              ABB Ltd., Accenture PLC, BIDGELY INC., C3.ai Inc., Enel Spa, Fluence Energy LLC, General Electric Co., GridX Inc., Honeywell International Inc., International Business Machines Corp., Microsoft Corp., Oracle Corp., Schneider Electric SE, Siemens AG, SparkCognition Inc., Stem Inc., Uptake Technologies Inc. are a few of the key vendors in the Generative Ai In Energy market.

              APAC will register the highest growth rate of 41% among the other regions. Therefore, the Generative Ai In Energy market in APAC is expected to garner significant business opportunities for the vendors during the forecast period.

              China, India, Japan, South Korea, Germany, UK, France, US, Canada, Brazil

              • Imperative to manage the unprecedented complexity of the global energy transitionA paramount driver for the adoption of generative AI in the energy market is the profound and accelerating complexity stemming from the global energy transition. This transition is defined by three interconnected megatrends: decarbonization is the driving factor this market.
              • decentralization is the driving factor this market.
              • and digitalization. Each trend introduces challenges that traditional analytical tools and operational paradigms are ill equipped to handle is the driving factor this market.
              • creating a compelling need for the advanced simulation and content generation capabilities of AI. Decarbonization is the driving factor this market.
              • the shift away from fossil fuels toward renewable energy sources like wind and solar is the driving factor this market.
              • fundamentally alters the physics of grid management. The inherent intermittency and variability of these sources require a paradigm shift from deterministic planning to probabilistic is the driving factor this market.
              • risk based operations. Generative AI is uniquely suited to this challenge by enabling the creation of vast ensembles of realistic future weather scenarios. This capability is the driving factor this market.
              • far superior to single point forecasts is the driving factor this market.
              • allows for more sophisticated bidding strategies in energy markets and more resilient grid planning. Google DeepMind is a technology research company is the driving factor this market.
              • but its tools are critical enablers for the energy sector. Similarly is the driving factor this market.
              • the NVIDIA Earth-2 platform is the driving factor this market.
              • announced in March 2024 is the driving factor this market.
              • allows for the generation of ultra high resolution climate and weather simulations is the driving factor this market.
              • enabling energy companies to stress test their renewable portfolios against generated scenarios of extreme and rare weather events. NVIDIA Corporation is a technology hardware and software company providing foundational platforms. Decentralization further compounds this complexity with the mass proliferation of distributed energy resources (DERs) such as rooftop solar panels is the driving factor this market.
              • battery storage systems is the driving factor this market.
              • and electric vehicle chargers. These millions of small is the driving factor this market.
              • independent assets transform consumers into prosumers and create bidirectional power flows that can destabilize local distribution networks. Generative AI provides a solution by simulating the aggregate behavior of these DERs. A utility can generate thousands of plausible scenarios for electric vehicle charging patterns in a specific neighborhood to predict potential transformer overloads or use the technology to generate optimal control strategies for a virtual power plant. The launch of the C3 Generative AI Suite by C3.ai Inc. in March 2023 provides utilities with a platform to query their vast datasets using natural language to generate these critical insights. This capability is essential for modern distribution system operators to maintain grid stability and defer costly infrastructure upgrades. Digitalization is the driving factor this market.
              • the third pillar is the driving factor this market.
              • results in an exponential increase in data from smart meters is the driving factor this market.
              • IoT sensors is the driving factor this market.
              • and grid edge devices. Generative AI is the key to unlocking the value within this data deluge is the driving factor this market.
              • not just by analyzing it but by synthesizing it into actionable intelligence is the driving factor this market.
              • reports is the driving factor this market.
              • and operational plans is the driving factor this market.
              • thus making the complexity of the modern energy system manageable. is the driving factor this market.

              The Generative Ai In Energy market vendors should focus on grabbing business opportunities from the Solutions segment as it accounted for the largest market share in the base year.
              RIA - Research AI Assistant
              Ask RIA