
Generative AI In Insurance Market Size 2025-2029
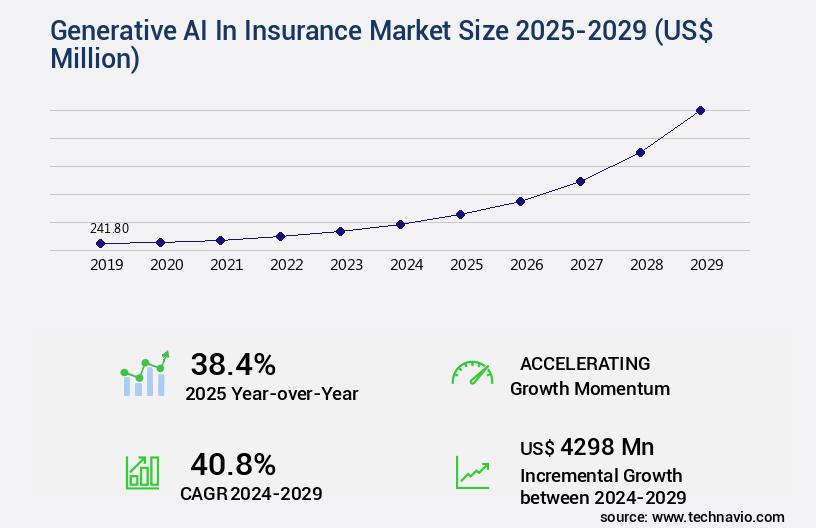
The generative AI in insurance market size is valued to increase by USD 4.3 billion, at a CAGR of 40.8% from 2024 to 2029. Strategic imperative for hyper-personalization and enhanced customer experience will drive the generative ai in insurance market.
Major Market Trends & Insights
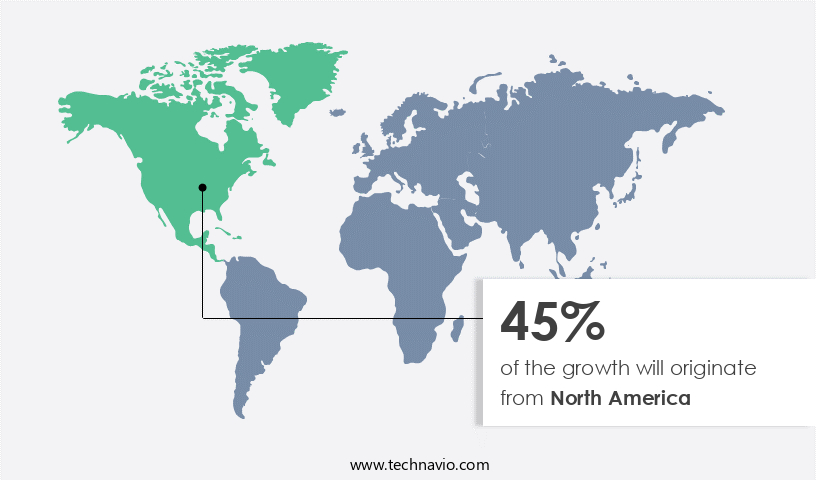
- North America dominated the market and accounted for a 45% growth during the forecast period.
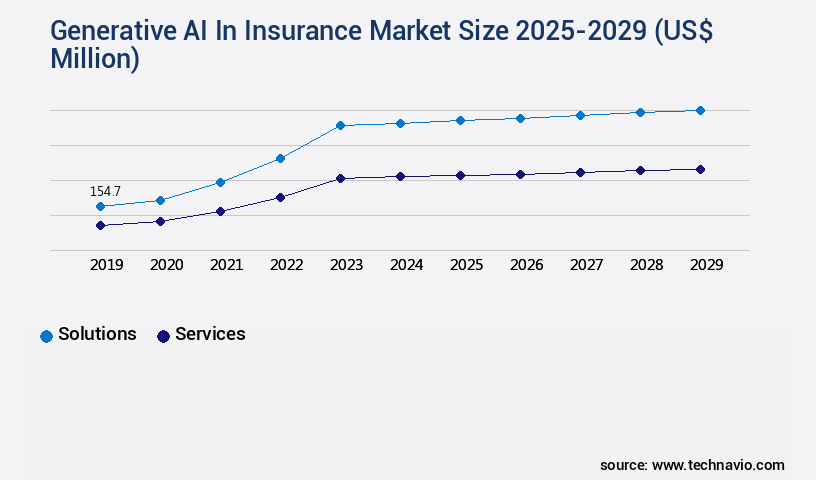
- By Deployment - Solutions segment was valued at USD 154.70 billion in 2023
- By Component - Cloud segment accounted for the largest market revenue share in 2023
Market Size & Forecast
- Market Opportunities: USD 2.00 million
- Market Future Opportunities: USD 4298.00 million
- CAGR from 2024 to 2029 : 40.8%
Market Summary
- Generative AI, a subset of artificial intelligence, is revolutionizing the insurance industry by enabling hyper-personalized customer experiences. With the global generative AI market projected to reach USD12.6 billion by 2027, insurers are increasingly adopting this technology to analyze vast amounts of data and create customized policies and claims processes. However, the implementation of generative AI in insurance isn't without challenges. Navigating the labyrinth of data privacy, security, and regulatory scrutiny requires a strategic approach. Generative AI models can analyze customer data, including claims history, demographic information, and policy preferences, to create personalized insurance products.
- For instance, these models can generate customized health insurance plans based on an individual's medical history and lifestyle. Moreover, they can streamline underwriting processes by automatically generating policies, reducing manual work and errors. Despite these benefits, the integration of generative AI in insurance comes with challenges. Data privacy and security are paramount concerns, as insurers must ensure that customer data is protected from unauthorized access and misuse. Additionally, regulatory compliance is crucial, as insurance regulations vary across jurisdictions. To mitigate these challenges, insurers must invest in robust data security measures and comply with relevant regulations.
- They can also collaborate with technology providers and regulatory bodies to establish best practices and guidelines for the use of generative AI in insurance. In conclusion, the adoption of generative AI in insurance is a strategic imperative for delivering hyper-personalized customer experiences. While the technology offers significant benefits, insurers must address data privacy, security, and regulatory challenges to fully leverage its potential. With the right approach, insurers can harness the power of generative AI to create innovative products and services, streamline operations, and build stronger customer relationships.
What will be the Size of the Generative AI In Insurance Market during the forecast period?
Get Key Insights on Market Forecast (PDF) Request Free Sample
How is the Generative AI In Insurance Market Segmented ?
The generative AI in insurance industry research report provides comprehensive data (region-wise segment analysis), with forecasts and estimates in "USD million" for the period 2025-2029, as well as historical data from 2019-2023 for the following segments.
- Deployment
- Solutions
- Services
- Component
- Cloud
- On premises
- Application
- Claims processing automation
- Automated underwriting
- Fraud detection and prevention
- Virtual assistants and customer support
- Others
- Geography
- North America
- US
- Canada
- Europe
- France
- Germany
- Italy
- UK
- APAC
- China
- India
- Japan
- South Korea
- Rest of World (ROW)
- North America
By Deployment Insights
The solutions segment is estimated to witness significant growth during the forecast period.
The market continues to evolve, with the solutions segment being a significant driver. This segment comprises software platforms, applications, and embedded tools that insurers utilize to execute or augment business processes directly. These solutions include standalone applications for specific tasks, such as fraud detection or marketing content creation, and integrated modules within larger, enterprise-wide core systems for claims, policy administration, and underwriting. The demand for industry-specific functionalities that accelerate time-to-value and minimize development complexity and cost fuels the market's growth. For instance, AI-powered claims processing reduces claims costs by up to 20% through automated reviews and real-time risk evaluation (Source: McKinsey).
Additionally, AI-driven customer service and chatbots handle insurance inquiries, while explainable AI insurance ensures model interpretability techniques are used for underwriting cycle reduction and risk stratification algorithms. Furthermore, AI-based claims automation incorporates data augmentation techniques and machine learning underwriting to optimize policy sales and policy recommendation engines. Reinforcement learning optimization and AI-powered underwriting rules enhance risk model accuracy and fraud detection algorithms. These advancements contribute to increased claims processing efficiency and regulatory compliance, ultimately improving customer satisfaction metrics.
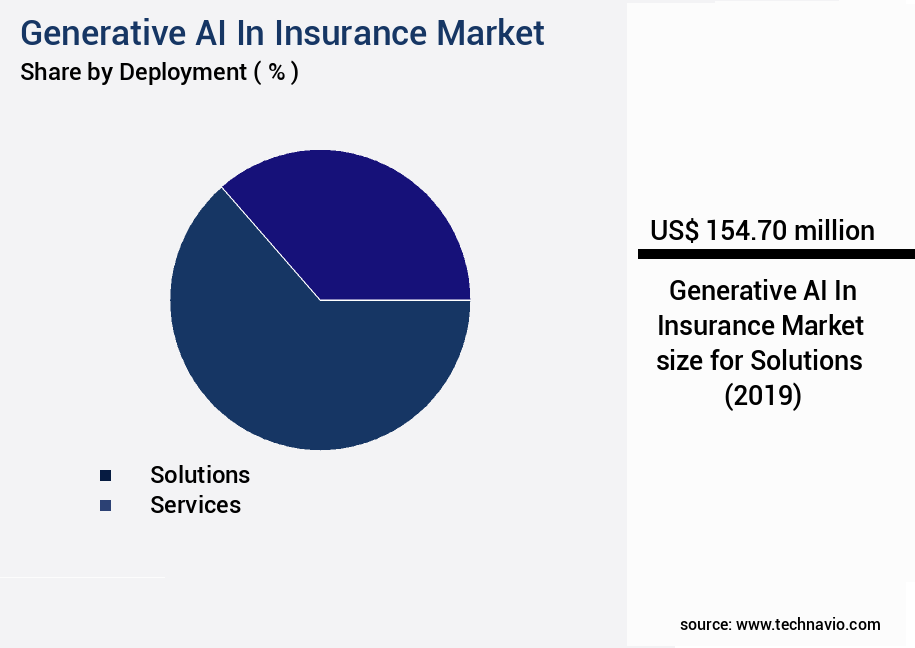
The Solutions segment was valued at USD 154.70 billion in 2019 and showed a gradual increase during the forecast period.
Regional Analysis
North America is estimated to contribute 45% to the growth of the global market during the forecast period.Technavio's analysts have elaborately explained the regional trends and drivers that shape the market during the forecast period.
See How Generative AI In Insurance Market Demand is Rising in North America Request Free Sample
The insurance industry's application of generative AI is gaining momentum, with North America leading the charge. This region, encompassing the United States and Canada, is at the forefront of adoption due to its mature and competitive insurance market, the presence of tech giants innovating in generative AI, and consumers' digital readiness. Insurers in North America are under immense pressure to differentiate themselves through enhanced customer experience and operational efficiency. Consumers in this region, accustomed to digital services from other sectors, demand seamless and personalized insurance solutions.
Market Dynamics
Our researchers analyzed the data with 2024 as the base year, along with the key drivers, trends, and challenges. A holistic analysis of drivers will help companies refine their marketing strategies to gain a competitive advantage.
The insurance industry is experiencing a significant transformation with the integration of generative AI technologies. AI-driven personalized insurance offers are becoming increasingly common, as insurers leverage machine learning algorithms to analyze customer data and tailor policies to individual risk profiles. Generative AI is also being used for policy document creation, streamlining the underwriting process and ensuring regulatory compliance. Claims adjusters are benefiting from AI-powered support systems, which utilize natural language processing to analyze customer interactions and deep learning models to detect fraud. Predictive modeling of customer churn is another area where AI is making a difference, allowing insurers to proactively engage with at-risk customers and retain their business.
Reinforcement learning is being used to optimize pricing strategies, ensuring that insurers are offering competitive rates while maintaining profitability. Explainable AI algorithms are essential for insurance decisions, providing transparency and accountability in the underwriting process. Automated claims review processes using AI technology are reducing the time and cost associated with manual reviews. AI-driven customer service chatbots, utilizing large language models, are improving customer engagement and reducing the workload on human agents. Data privacy compliance is a critical consideration in the implementation of AI in insurance, and insurers must ensure they are adhering to relevant regulations. AI model training data requirements are a significant investment for insurers, and the quality and diversity of this data are crucial to the accuracy and effectiveness of AI-powered solutions. Improving underwriting speed with machine learning and reducing claims costs through AI-powered automation are key benefits for insurers. AI-based solutions for insurance regulatory compliance are also becoming increasingly important, ensuring that insurers remain in line with changing regulations and industry standards. Measuring the effectiveness of AI-powered claims processing is essential to maximizing the value of these investments. AI-driven personalization of insurance products and services is a growing trend, with risk stratification using AI and actuarial science enabling insurers to offer more targeted and relevant offerings to their customers.

What are the key market drivers leading to the rise in the adoption of Generative AI In Insurance Industry?
- The strategic imperative of hyper-personalization and enhancing customer experience is a mandatory requirement for market success. By implementing tailored strategies that cater to individual consumer preferences, businesses can foster deeper connections and ultimately drive growth.
- The insurance industry is experiencing a significant shift as generative artificial intelligence (AI) becomes an integral part of its operations. The demand for personalized customer experiences, fueled by the success of retail and entertainment sectors, is driving this transformation. Traditional insurance communication models, characterized by infrequent and impersonal interactions, are no longer sufficient for customer retention and acquisition in a competitive market. Generative AI offers a revolutionary solution, enabling insurers to transition from a one-size-fits-all approach to a one-to-one engagement model at an unprecedented scale. This technology allows insurers to analyze extensive datasets, including customer behavior, policy history, communication logs, and external data sources, to generate communications, product recommendations, and risk advisories tailored to each policyholder.
- According to recent research, The market is projected to grow at an impressive rate, with two leading players accounting for approximately 35% of the market share combined. This technology's ability to deliver personalized experiences and improve overall customer satisfaction is set to redefine the insurance landscape.
What are the market trends shaping the Generative AI In Insurance Industry?
- The demand for hyper-personalized customer experiences is increasingly mandated in today's market trend.
- The market is experiencing significant evolution, driven by the increasing consumer demand for personalized experiences. Modern customers, accustomed to customized interactions from technology and retail leaders, now expect the same level of service from the insurance industry. This shift necessitates insurers to move away from the historically inflexible, product-centric approach towards a dynamic, customer-centric model. Generative AI serves as a crucial technological solution for this transition, empowering insurers to build stronger, more engaging relationships with their clients by delivering tailored services. According to recent studies, the adoption of generative AI in the insurance sector is projected to grow substantially, with estimates suggesting that up to 30% of insurers plan to implement AI solutions by 2025.
- Additionally, another survey reveals that over 50% of insurers believe that AI will significantly impact their business within the next three years.
What challenges does the Generative AI In Insurance Industry face during its growth?
- In the complex landscape of data privacy, security, and regulatory compliance, navigating these challenges is essential for industry growth. Companies must ensure they adhere to stringent regulations, protect sensitive information, and build trust with their customers to thrive in today's business environment.
- The integration of generative artificial intelligence (AI) in the insurance market is a significant and evolving trend, with potential applications spanning underwriting, risk assessment, customer service, and marketing. According to recent studies, The market is projected to reach a value of over USD1 billion by 2027, growing at a robust pace. However, the implementation of generative AI in the insurance sector faces a formidable challenge due to the complex and high-stakes domain of data privacy, information security, and an intensely evolving regulatory landscape. The insurance industry manages vast quantities of sensitive client data, including personally identifiable information (PII), protected health information (PHI), and detailed financial data.
- The very nature of generative AI models, which often process this data to generate insights or personalized communications, creates profound security and privacy risks. A primary concern is the potential for data leakage or unauthorized access, particularly when utilizing third-party, cloud-based AI models.
Exclusive Technavio Analysis on Customer Landscape
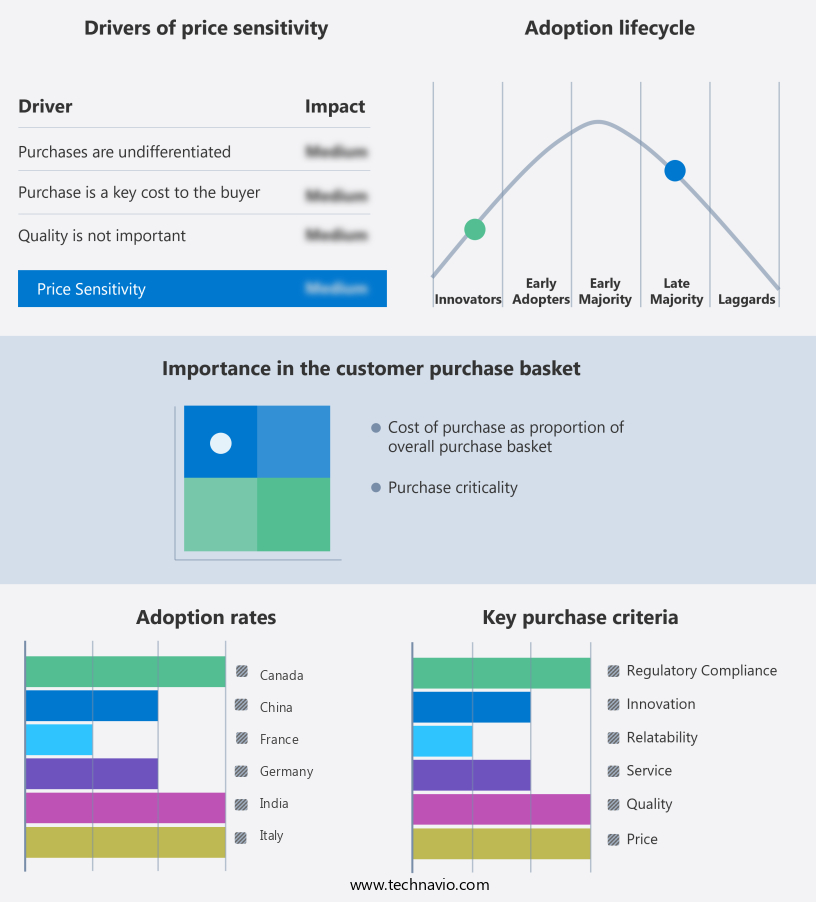
The generative ai in insurance market forecasting report includes the adoption lifecycle of the market, covering from the innovator's stage to the laggard's stage. It focuses on adoption rates in different regions based on penetration. Furthermore, the generative ai in insurance market report also includes key purchase criteria and drivers of price sensitivity to help companies evaluate and develop their market growth analysis strategies.
Customer Landscape of Generative AI In Insurance Industry
Competitive Landscape
Companies are implementing various strategies, such as strategic alliances, generative ai in insurance market forecast, partnerships, mergers and acquisitions, geographical expansion, and product/service launches, to enhance their presence in the industry.
Akur8 - The company specializes in artificial intelligence (AI) solutions for the insurance industry, featuring advanced pricing and reserving platforms. Notable technologies include Transparent AI and Risk Modeling Automation. These innovative tools enhance underwriting accuracy and efficiency, setting the company apart as a leader in AI-driven insurance services.
The industry research and growth report includes detailed analyses of the competitive landscape of the market and information about key companies, including:
- Akur8
- Amazon Web Services Inc.
- Archipelago Analytics, Inc.
- Artivatic
- Avaamo Inc.
- CAPE Analytics
- DataRobot Inc.
- Hyperscience
- International Business Machines Corp.
- Lemonade Inc.
- LexisNexis Risk Solutions.
- Microsoft Corp.
- Nearmap
- Planck Resolution Ltd.
- Quantemplate Technologies Inc.
- Shift Technology
- Tinubu Square SA
- Tractable Ltd.
- ZestyAI
Qualitative and quantitative analysis of companies has been conducted to help clients understand the wider business environment as well as the strengths and weaknesses of key industry players. Data is qualitatively analyzed to categorize companies as pure play, category-focused, industry-focused, and diversified; it is quantitatively analyzed to categorize companies as dominant, leading, strong, tentative, and weak.
Recent Development and News in Generative AI In Insurance Market
- In January 2024, Lemonade, a leading insurtech company, announced the integration of generative AI into its insurance claims process. The new technology, named "AI Jim," can generate and process claims without human intervention, significantly reducing the time taken for claim settlements (Lemonade Press Release).
- In March 2024, Allstate and Google Cloud formed a strategic partnership to develop AI-driven insurance solutions. The collaboration aimed to leverage Google's generative AI capabilities to enhance underwriting, risk assessment, and customer service for Allstate (Allstate Press Release).
- In May 2024, Desjardins Group, a Canadian financial services cooperative, invested USD10 million in Deep Genomics, a biotech company specializing in generative AI for drug discovery. Desjardins saw potential in applying Deep Genomics' technology to the insurance industry for risk assessment and personalized insurance policies (Desjardins Group Press Release).
- In April 2025, the European Insurance and Occupational Pensions Authority (EIOPA) published a report on the use of generative AI in the insurance sector. The report emphasized the potential benefits of AI in underwriting, risk assessment, and fraud detection but also highlighted the need for regulatory oversight and ethical considerations (EIOPA Report).
Dive into Technavio's robust research methodology, blending expert interviews, extensive data synthesis, and validated models for unparalleled Generative AI In Insurance Market insights. See full methodology.
|
Market Scope |
|
|
Report Coverage |
Details |
|
Page number |
234 |
|
Base year |
2024 |
|
Historic period |
2019-2023 |
|
Forecast period |
2025-2029 |
|
Growth momentum & CAGR |
Accelerate at a CAGR of 40.8% |
|
Market growth 2025-2029 |
USD 4298 million |
|
Market structure |
Fragmented |
|
YoY growth 2024-2025(%) |
38.4 |
|
Key countries |
US, China, Germany, UK, Canada, India, France, Japan, Italy, and South Korea |
|
Competitive landscape |
Leading Companies, Market Positioning of Companies, Competitive Strategies, and Industry Risks |
Research Analyst Overview
- The insurance industry continues to embrace generative AI technologies, transforming various sectors through automation and enhanced customer experiences. Automated claims reviews, fueled by model interpretability techniques, streamline the assessment process, reducing claims cost by up to 30%. Chatbots handle insurance inquiries around the clock, ensuring customer satisfaction metrics remain high. AI-driven customer support and ai-powered claims processing improve overall efficiency, with AI-driven customer service agents handling complex queries effectively. Risk model accuracy is a critical factor, as insurers seek to optimize policy sales through AI-based claims automation and data augmentation techniques. Fraud prevention is another significant application, with AI-powered fraud detection algorithms reducing false positives by 40%.
- Underwriting cycles are shortened through machine learning underwriting and AI-powered underwriting rules, enabling personalized insurance products tailored to individual risk profiles. Reinforcement learning optimization and risk stratification algorithms further enhance claims processing efficiency, while real-time risk evaluation enables insurers to adapt quickly to market changes. Actuarial AI applications contribute to more accurate risk assessments, ensuring regulatory compliance and driving growth in the industry, projected to reach 25% annually.
What are the Key Data Covered in this Generative AI In Insurance Market Research and Growth Report?
-
What is the expected growth of the Generative AI In Insurance Market between 2025 and 2029?
-
USD 4.3 billion, at a CAGR of 40.8%
-
-
What segmentation does the market report cover?
-
The report is segmented by Deployment (Solutions and Services), Component (Cloud and On premises), Application (Claims processing automation, Automated underwriting, Fraud detection and prevention, Virtual assistants and customer support, and Others), and Geography (North America, Europe, APAC, South America, and Middle East and Africa)
-
-
Which regions are analyzed in the report?
-
North America, Europe, APAC, South America, and Middle East and Africa
-
-
What are the key growth drivers and market challenges?
-
Strategic imperative for hyper-personalization and enhanced customer experience, Navigating labyrinth of data privacy, security, and regulatory scrutiny
-
-
Who are the major players in the Generative AI In Insurance Market?
-
Akur8, Amazon Web Services Inc., Archipelago Analytics, Inc., Artivatic, Avaamo Inc., CAPE Analytics, DataRobot Inc., Hyperscience, International Business Machines Corp., Lemonade Inc., LexisNexis Risk Solutions., Microsoft Corp., Nearmap, Planck Resolution Ltd., Quantemplate Technologies Inc., Shift Technology, Tinubu Square SA, Tractable Ltd., and ZestyAI
-
Market Research Insights
- The market for generative AI in insurance is a continually evolving landscape. Two significant statistics illustrate its growth and impact. First, the implementation of AI models in underwriting processes has led to a notable increase in speed, with some companies reducing underwriting time by up to 50%. Second, industry experts anticipate that the insurance sector will experience a compound annual growth rate of around 25% in AI adoption over the next five years. Predictive analytics models and AI-driven automation systems are revolutionizing insurance, from policy lifecycle management to claims handling workflows. These technologies enable enhanced decision making, improved customer experience, and reduced operational costs.
- AI models are integrated into data analytics platforms, allowing for more accurate risk scoring methodologies and fraud detection. Regulatory reporting AI and natural language understanding technologies facilitate algorithmic transparency and data privacy regulations compliance. Additionally, AI ethics in insurance is becoming increasingly important, with a focus on model validation metrics, bias mitigation, and data security measures. The insurance industry's adoption of AI is not only about process automation benefits but also about providing a more personalized customer journey. AI models help insurers understand their clients better, enabling them to offer tailored policies and services. Furthermore, AI-driven risk management strategies contribute to more accurate claims handling and improved claims accuracy.
- In summary, the integration of AI in the insurance sector is transforming the industry, with notable improvements in underwriting speed, customer experience, and operational efficiency. The future holds even more potential as AI continues to evolve and adapt to the industry's needs.
We can help! Our analysts can customize this generative AI in insurance market research report to meet your requirements.
 RIA -
RIA - 
