Generative AI In Retail Market Size 2025-2029
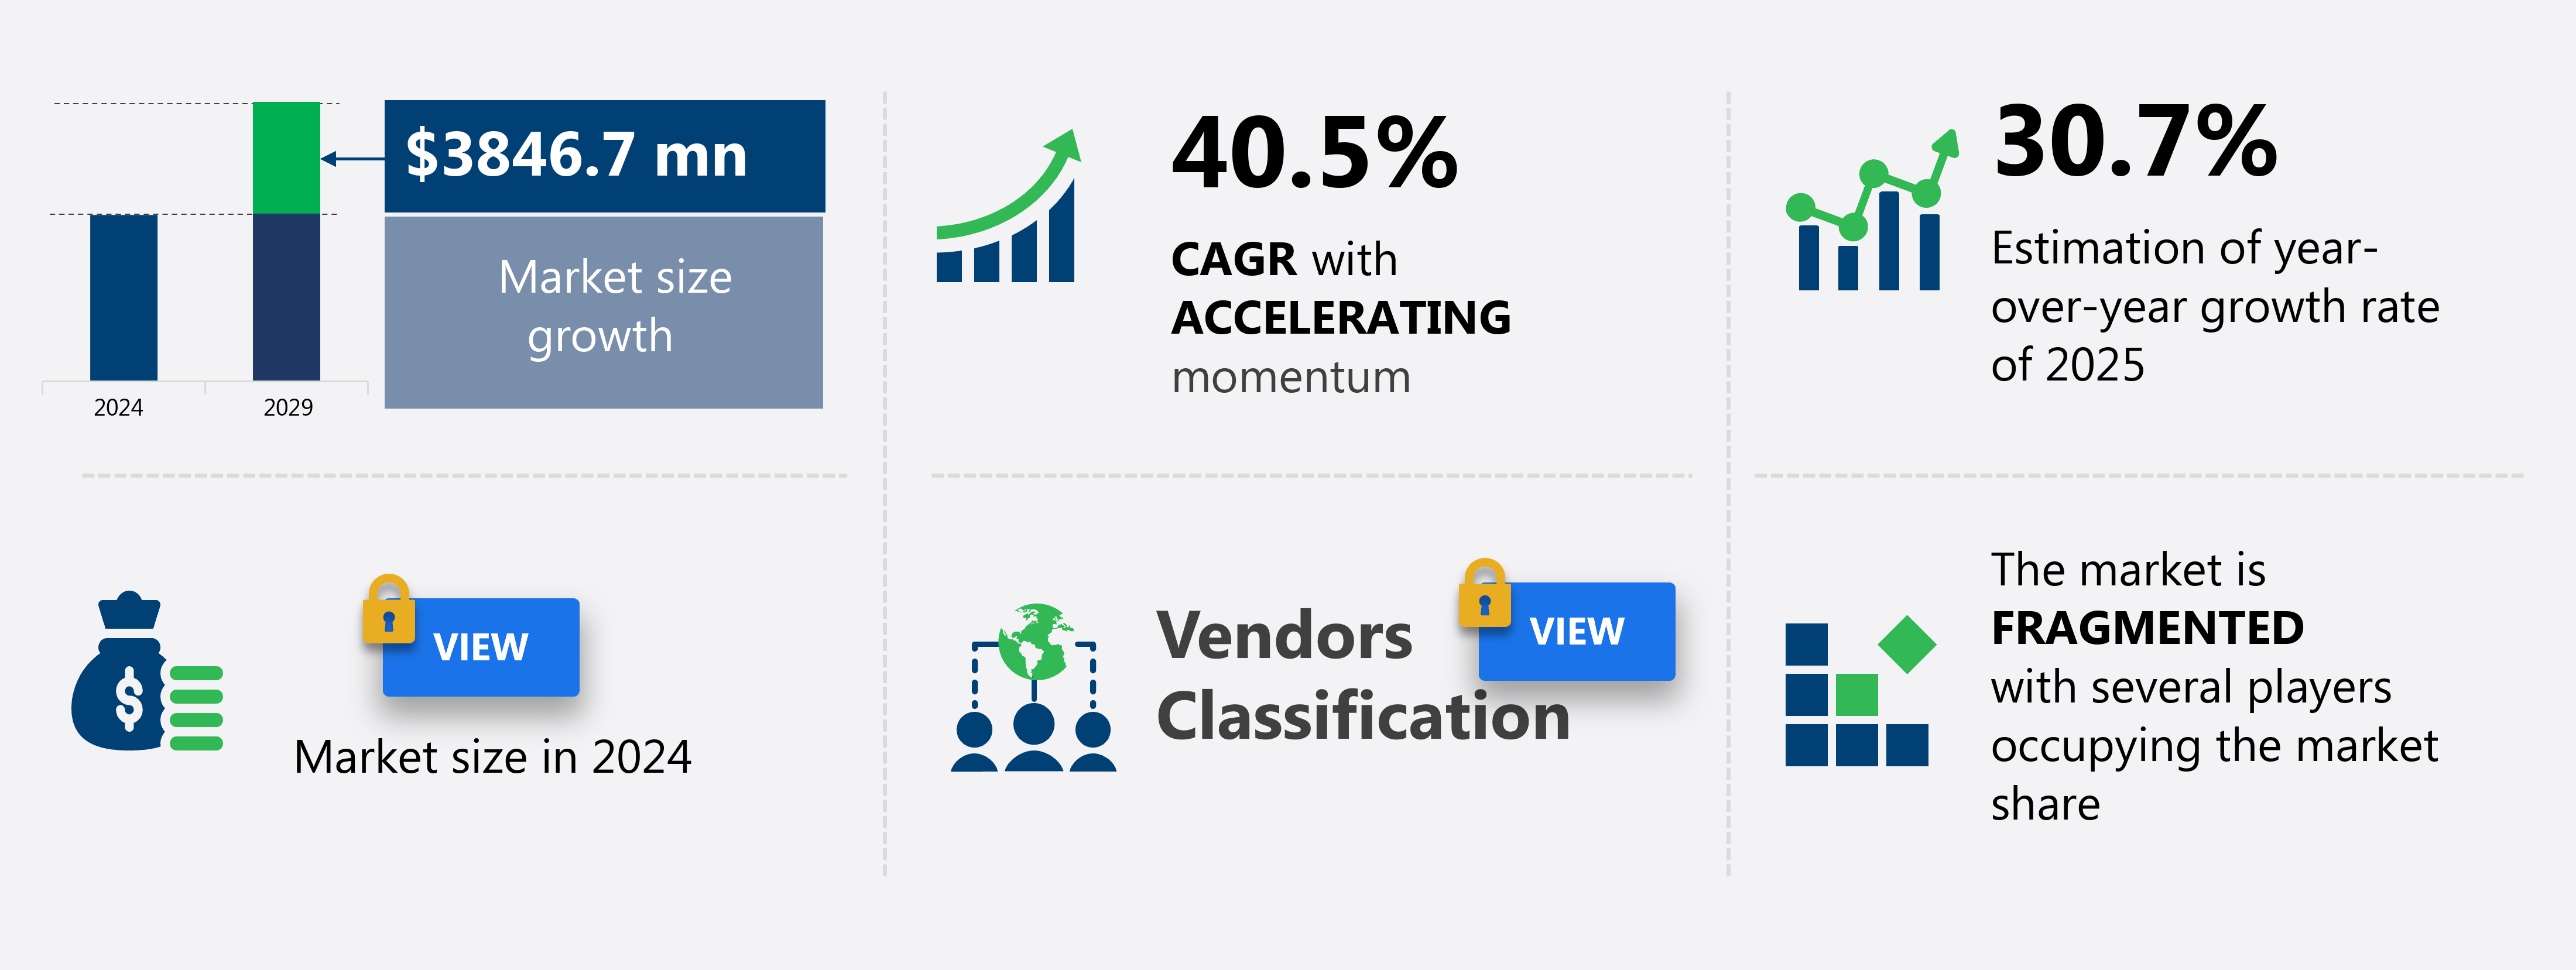
The generative AI in retail market size is forecast to increase by USD 3.85 billion, at a CAGR of 40.5% between 2024 and 2029.
- The market is driven by the imperative for hyper-personalization and enhanced customer experience. Retailers are increasingly leveraging Generative AI to create tailored product recommendations, personalized marketing campaigns, and customized shopping experiences. This trend is further fueled by the rise of multimodal AI for engaging and interactive commerce, enabling seamless integration of text, voice, and visual data. However, the market faces significant challenges. Data security, privacy, and navigating the complex ethical landscape are critical concerns.
- Additionally, they must address ethical considerations, such as bias in AI algorithms and the potential impact on employment. Effective management of these challenges will be essential for retailers seeking to capitalize on the opportunities presented by Generative AI and deliver superior customer experiences. Retailers must ensure that AI applications respect consumer privacy and comply with data protection regulations. E-commerce platforms benefit from e-commerce personalization and real-time recommendation engine implementation, which increase relevance and engagement.
What will be the Size of the Generative AI In Retail Market during the forecast period?
Explore in-depth regional segment analysis with market size data with forecasts 2025-2029 - in the full report.
Request Free Sample
- The market for generative AI in retail continues to evolve, with applications spanning various sectors and driving significant advancements. Customer feedback analysis and supply chain visibility are key areas of focus, enabling retailers to enhance customer retention strategies and optimize inventory levels. AI-driven retail solutions, such as store operations efficiency, pricing strategy optimization, and product assortment planning, are revolutionizing brick-and-mortar businesses. Online shopping experiences are being personalized through AI-driven recommendations and checkout optimization strategies, while staff scheduling software and risk management strategies ensure operational efficiency. Deep learning applications, including computer vision systems and smart shelf technology, are transforming in-store experiences and inventory management.
- Loyalty program optimization, data mining techniques, and mobile app engagement are essential components of modern customer segmentation models. Sales forecasting accuracy and brand reputation management are critical for retailers, with AI-driven solutions expected to contribute to a 15% industry growth by 2025. For instance, a leading retailer achieved a 10% increase in sales by implementing AI-driven pricing strategies and product assortment planning.
How is this Generative AI In Retail Market segmented?
The generative AI in retail market research report provides comprehensive data (region-wise segment analysis), with forecasts and estimates in "USD million" for the period 2025-2029,for the following segments.
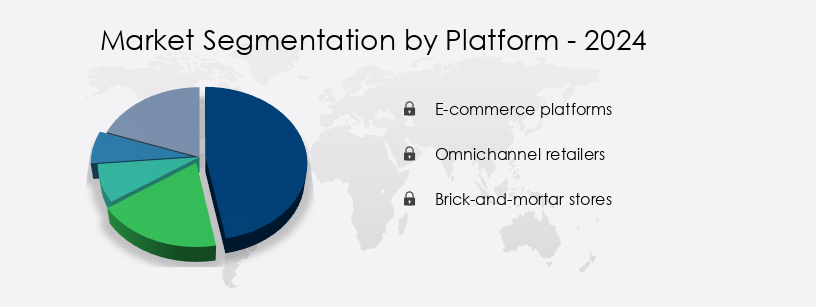
- Platform
- E-commerce platforms
- Omnichannel retailers
- Brick-and-mortar stores
- Technology
- NLP
- Computer vision
- Multimodal AI
- LLMs
- Reinforcement learning
- Application
- Personalization and customer experience
- Inventory and supply chain optimization
- Content generation
- Customer support
- Others
- Geography
- North America
- US
- Canada
- Europe
- France
- Germany
- UK
- APAC
- Australia
- China
- India
- Japan
- South America
- Brazil
- Rest of World (ROW)
- North America
By Platform Insights
The E-commerce platforms segment is estimated to witness significant growth during the forecast period. E-commerce retail is witnessing a significant rise in the adoption of generative AI technology. With digital platforms generating and accumulating massive amounts of structured and unstructured data, AI models are being leveraged to deliver hyper-personalized user experiences. This includes dynamic homepage layouts, custom product recommendations, and targeted promotions, resulting in a unique shopping journey for each visitor. Additionally, generative AI is revolutionizing content creation and merchandising. Machine learning algorithms and natural language processing enable the generation of product descriptions, while image recognition technology powers visual search implementation. Conversational commerce is enhanced through chatbot integration and voice-activated shopping, offering a seamless and engaging customer experience.
Predictive analytics retail plays a crucial role in demand forecasting and inventory management, ensuring stock availability and optimizing supply chain operations. Omnichannel customer engagement is harmonized through AI-powered personalization, augmented reality retail, and sentiment analysis tools. Data privacy compliance is maintained through advanced fraud detection systems and loss prevention technology. Marketing campaign optimization and real-time recommendation engines are instrumental in increasing sales, with one study reporting a 15% uplift in conversions through personalized product recommendations. The retail industry is expected to grow by over 10% annually as businesses continue to harness the power of generative AI to create engaging, efficient, and profitable customer experiences.
Get Key Insights on Market Forecast (PDF)- Request Free Sample
Regional Analysis
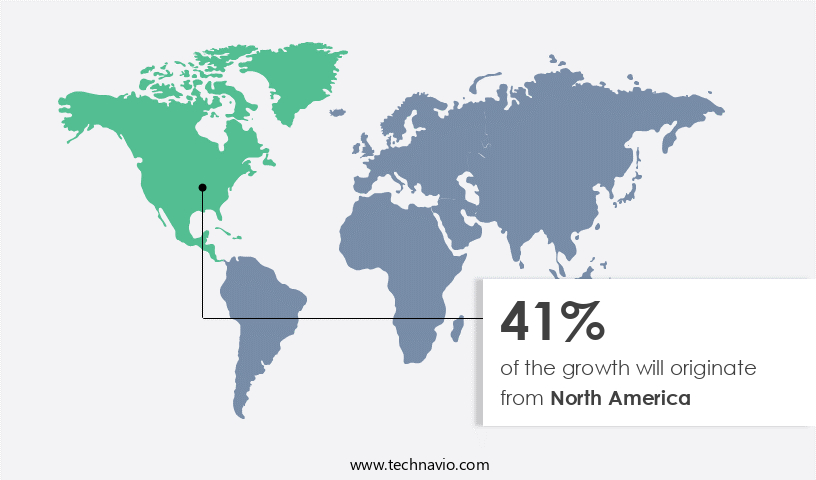
North America is estimated to contribute 41% to the growth of the global market during the forecast period. Technavio's analysts have elaborately explained the regional trends and drivers that shape the market during the forecast period.
See How generative AI in retail market Demand is Rising in North America Request Free Sample
In the dynamic retail industry, North America leads the global generative AI market, fueled by advanced technological infrastructure, high consumer readiness, and a robust ecosystem of tech giants and startups. The United States, specifically, is a hub for foundational model developers, cloud service providers, and semiconductor companies that underpin the generative AI industry. Retailers face intense competition from industry leaders like Amazon, Walmart, and Target, who invest heavily in AI to stay ahead. This rivalry propels innovation, with AI applications transforming various retail touchpoints. Predictive analytics and real-time recommendation engines personalize shopping experiences, while demand forecasting models optimize inventory and pricing strategies.
Omnichannel customer engagement is enhanced through chatbots, sentiment analysis tools, and conversational commerce. Supply chain optimization and customer service automation streamline operations, while data privacy compliance ensures security. Virtual try-on features, visual search implementation, and augmented reality retail create engaging shopping experiences. AI-driven inventory management, product description generation, and machine learning algorithms power backend operations. One study projects the retail AI market to grow by 20% in the next five years, underscoring its transformative potential. For instance, a major retailer reported a 15% increase in sales after implementing an AI-powered personalization strategy.
Market Dynamics
Our researchers analyzed the data with 2024 as the base year, along with the key drivers, trends, and challenges. A holistic analysis of drivers will help companies refine their marketing strategies to gain a competitive advantage. The Generative AI in Retail Market is undergoing a rapid transformation as retailers embrace intelligent technologies to enhance operational efficiency, customer engagement, and personalized experiences. Among the most impactful applications is customer journey mapping, which is being revolutionized through AI-enhanced customer journey mapping tools, enabling deeper insights into consumer behavior and preferences. Retailers use retail analytics dashboard and data-driven insights for retail operations to monitor performance and guide strategic decisions. Store layout optimization is another critical area where AI is improving traffic flow and maximizing sales potential.
Retailers are leveraging chatbot integration retail and conversational AI for customer service to ensure seamless communication across platforms. Natural language processing in chatbots and automated chatbot responses retail allow for instant, intelligent interactions, while virtual assistants retail enhance both online and in-store experience enhancement. In product innovation, generative AI product design is streamlining creation processes, and generative AI for product description creation ensures consistent, compelling content. Generative AI for personalized offers is reshaping promotional strategies, contributing to personalized shopping experience and personalized promotions that drive higher conversion rates.
Retailers also utilize AI-powered visual search integration and computer vision for virtual try-on to improve the online shopping experience, while image recognition technology for product identification streamlines digital cataloging. On the pricing and promotion front, AI-driven dynamic pricing models retail and dynamic pricing strategies respond in real-time to market trends, while personalized email marketing campaigns AI and automated email marketing enhance customer engagement. Operationally, machine learning for demand forecasting and predictive analytics for retail inventory ensure accurate stock levels, supported by inventory optimization tools and AI-driven supply chain optimization strategies. These tools help improve efficiency and support return rate reduction through better stock accuracy.
Security and compliance are also addressed with AI-powered fraud detection systems implementation and AI-powered loss prevention in retail, protecting assets while maintaining customer trust. Ethical implementation remains a cornerstone, with growing emphasis on AI ethics in retail to ensure transparent, responsible use of AI technologies. Lastly, social media marketing AI and sentiment analysis tools for customer feedback help brands stay connected to evolving customer sentiments, fostering loyalty and long-term value. These strategies directly impact customer lifetime value, solidifying the importance of AI in future retail success. Big data analytics retail supports these functions by processing vast consumer datasets to detect patterns and forecast needs.
What are the key market drivers leading to the rise in the adoption of Generative AI In Retail Industry?
- Maintaining a professional tone, the imperative factors driving market growth are hyper-personalization and the enhancement of customer experience. The retail industry is experiencing a paradigm shift, with generative AI emerging as a primary catalyst for innovation. Consumers today seek personalized and engaging shopping experiences, making it crucial for brands to adapt. Traditional segmented approaches to marketing and customer interaction are no longer sufficient. Generative AI offers an unparalleled technological solution, moving beyond static segmentation to enable true one-to-one engagement at scale.
- For instance, a leading retailer reported a 10% increase in sales after implementing generative AI-driven personalized product recommendations. This underscores the transformative impact of generative AI on retail, allowing businesses to deliver tailored experiences that resonate with consumers. This technology generates unique product recommendations, customized marketing copy for emails and ads, and even offers individualized styling advice based on a shopper's preferences and history. According to recent studies, the global generative AI market in retail is projected to grow by over 25% in the next five years, signifying significant potential for businesses.
What are the market trends shaping the Generative AI In Retail Industry?
- The rise of multimodal AI is becoming a significant trend in engaging and interactive commerce. Multimodal artificial intelligence is set to shape the future of commerce with its engaging and interactive capabilities. The retail industry is witnessing a transformative shift as generative AI technology advances from text-based models to multimodal systems. This evolution enables AI to process and generate content across various formats, including text, images, video, and 3D models.
- According to industry reports, the retail AI market is expected to grow by over 20% in the next year, underscoring its significant potential. This growth is driven by the increasing demand for personalized shopping experiences and the ability of multimodal AI to deliver them. This trend is revolutionizing digital retail interfaces, making them more intuitive, visual, and engaging. A notable outcome of this trend is the ability for customers to upload a photograph of a furniture piece and receive AI-generated images of that item in their own living room, with different color schemes and complementary decor.
What challenges does the Generative AI In Retail Industry face during its growth?
- Ensuring data privacy, security, and navigating intricate ethical landscapes are essential requirements for the industry, posing significant challenges that can impact its growth. The generative AI market in retail faces a significant challenge in balancing data privacy, security, and ethical considerations. Retailers possess vast amounts of sensitive customer data, which, when integrated with AI models, can lead to potential security vulnerabilities and privacy risks. Data breaches or unintended disclosure of confidential information during training or inference processes pose substantial threats.
- For instance, a study revealed that a popular retailer's AI-driven product recommendations showed a 25% bias towards certain demographic groups. The retail industry is projected to grow by over 11% annually, driven by the increasing adoption of AI technologies. However, addressing data privacy, security, and ethical considerations will be crucial for market success. Ethical concerns also arise due to algorithmic bias, which can result in discriminatory or unfair outcomes, such as biased personalized recommendations or exclusionary marketing content.
Exclusive Customer Landscape
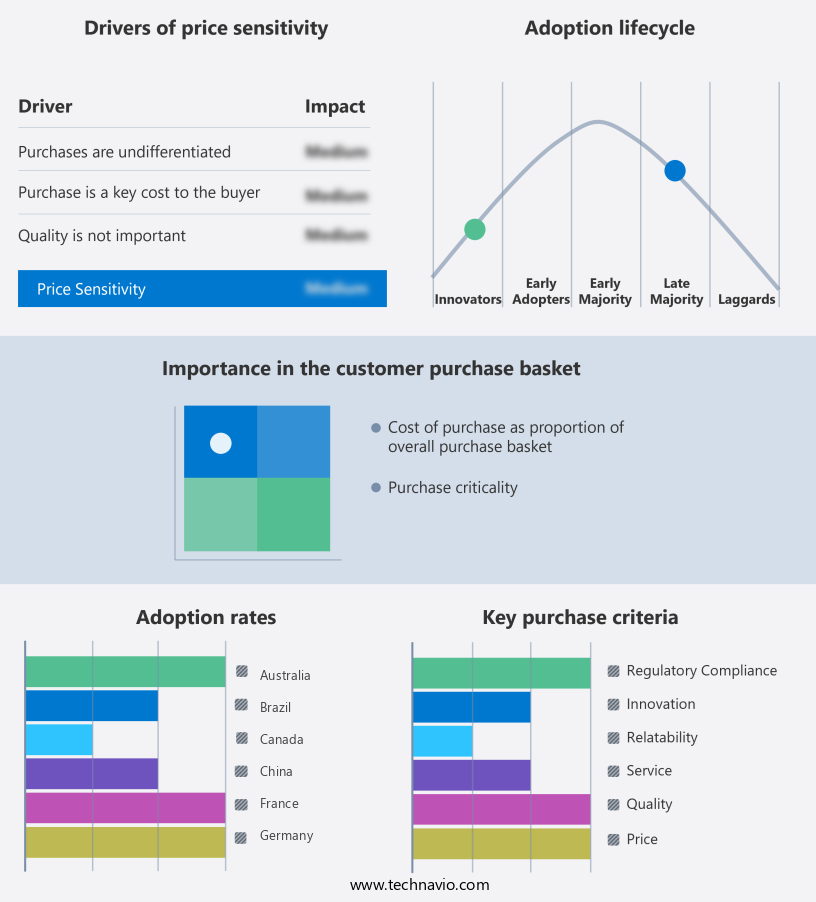
The generative AI in retail market forecasting report includes the adoption lifecycle of the market, covering from the innovator's stage to the laggard's stage. It focuses on adoption rates in different regions based on penetration. Furthermore, the generative AI in retail market report also includes key purchase criteria and drivers of price sensitivity to help companies evaluate and develop their market growth analysis strategies.
Customer Landscape
Key Companies & Market Insights
Companies are implementing various strategies, such as strategic alliances, generative AI in retail market forecast, partnerships, mergers and acquisitions, geographical expansion, and product/service launches, to enhance their presence in the industry.
A Mad Street Den - The company offers a comprehensive generative AI platform tailored for the retail sector, enabling end-to-end solutions in catalog management, product tagging, personalized search, customer experience automation, and demand forecasting for eCommerce and consumer retail businesses.
The industry research and growth report includes detailed analyses of the competitive landscape of the market and information about key companies, including:
- A Mad Street Den
- Adobe Inc.
- Amazon Web Services Inc.
- Constructor
- COVEO
- Dynamic Yield Ltd.
- Google LLC
- HIVERY
- Klevu
- Lily AI
- Microsoft Corp.
- Persado Holdings plc
- Salesforce Inc.
- Shopify Inc.
- Stylumia Intelligence Technology Pvt Ltd
- Syte
- Zebra Technologies Corp.
- Zeta Global Holdings Corp.
Qualitative and quantitative analysis of companies has been conducted to help clients understand the wider business environment as well as the strengths and weaknesses of key industry players. Data is qualitatively analyzed to categorize companies as pure play, category-focused, industry-focused, and diversified; it is quantitatively analyzed to categorize companies as dominant, leading, strong, tentative, and weak.
Recent Development and News in Generative AI In Retail Market
- In January 2024, American multinational technology company Microsoft announced the integration of its Azure OpenAI service into its Dynamics 365 retail solution, enabling retailers to use generative AI for product recommendations and personalized marketing (Microsoft Press Release).
- In March 2024, UK-based supermarket chain Tesco partnered with AI company Blue Yonder to deploy AI and machine learning technologies across its supply chain and retail operations, aiming to improve inventory management and optimize pricing (Tesco Press Release).
- In May 2024, generative AI startup FashionCognition raised a USD 10 million Series A funding round led by Sequoia Capital India, to expand its AI-powered virtual fitting room technology to more retailers and brands (Crunchbase News).
- In April 2025, Walmart announced the acquisition of AI company Alert Innovation, which specializes in autonomous cart technology, to enhance its in-store shopping experience and improve inventory management (Walmart Press Release).
Research Analyst Overview
- The market for generative AI in retail continues to evolve, with applications spanning various sectors and driving significant advancements. Customer feedback analysis and supply chain visibility are key areas of focus, enabling retailers to enhance customer retention strategies and optimize inventory levels. AI-driven retail solutions, such as store operations efficiency, pricing strategy optimization, and product assortment planning, are revolutionizing brick-and-mortar businesses. Online shopping experiences are being personalized through AI-driven recommendations and checkout optimization strategies, while staff scheduling software and risk management strategies ensure operational efficiency. Deep learning applications, including computer vision systems and smart shelf technology, are transforming in-store experiences and inventory management.
- Loyalty program optimization, data mining techniques, and mobile app engagement are essential components of modern customer segmentation models. Sales forecasting accuracy and brand reputation management are critical for retailers, with AI-driven solutions expected to contribute to a 15% industry growth by 2025. For instance, a leading retailer achieved a 10% increase in sales by implementing AI-driven pricing strategies and product assortment planning.
Dive into Technavio's robust research methodology, blending expert interviews, extensive data synthesis, and validated models for unparalleled Generative AI In Retail Market insights. See full methodology.
|
Market Scope |
|
|
Report Coverage |
Details |
|
Page number |
237 |
|
Base year |
2024 |
|
Forecast period |
2025-2029 |
|
Growth momentum & CAGR |
Accelerate at a CAGR of 40.5% |
|
Market growth 2025-2029 |
USD 3.85 billion |
|
Market structure |
Fragmented |
|
YoY growth 2024-2025(%) |
30.7 |
|
Key countries |
US, Canada, China, India, Japan, Australia, UK, Germany, France, and Brazil |
|
Competitive landscape |
Leading Companies, Market Positioning of Companies, Competitive Strategies, and Industry Risks |
What are the Key Data Covered in this Generative AI In Retail Market Research and Growth Report?
- CAGR of the Generative AI In Retail industry during the forecast period
- Detailed information on factors that will drive the growth and forecasting between 2025 and 2029
- Precise estimation of the size of the market and its contribution of the industry in focus to the parent market
- Accurate predictions about upcoming growth and trends and changes in consumer behaviour
- Growth of the market across North America, APAC, Europe, South America, and Middle East and Africa
- Thorough analysis of the market's competitive landscape and detailed information about companies
- Comprehensive analysis of factors that will challenge the generative AI in retail market growth of industry companies
We can help! Our analysts can customize this generative AI in retail market research report to meet your requirements.
 RIA -
RIA - 
