
Global AI In Nanotechnology Market Size 2025-2029
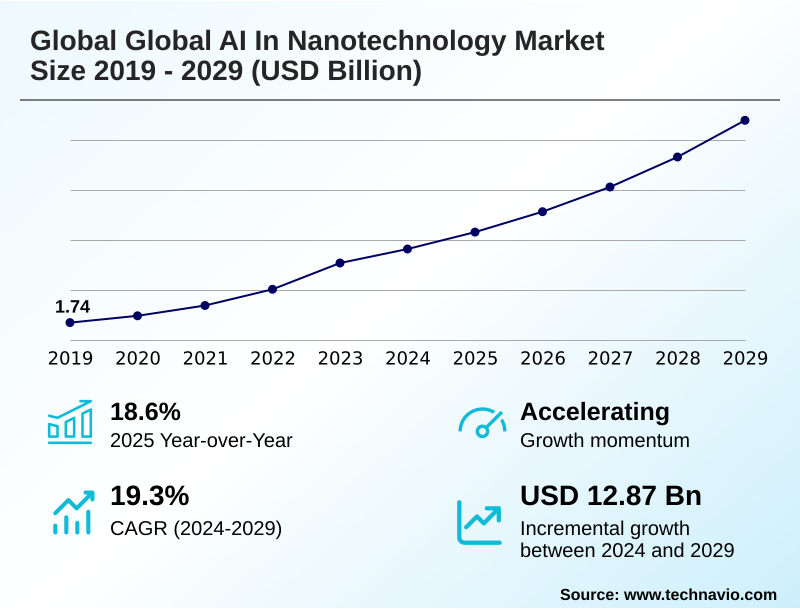
The global ai in nanotechnology market size is valued to increase by USD 12.87 billion, at a CAGR of 19.3% from 2024 to 2029. Accelerated pace of research and development and materials discovery will drive the global ai in nanotechnology market.
Major Market Trends & Insights
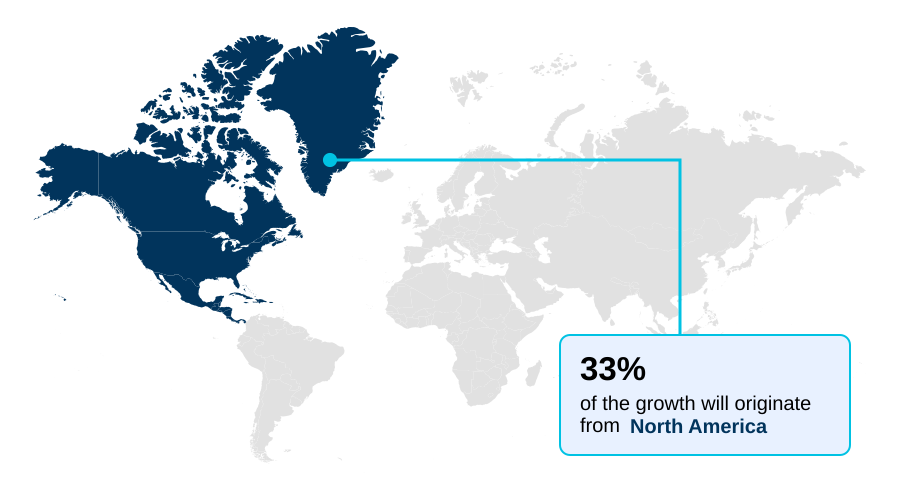
- North America dominated the market and accounted for a 33.1% growth during the forecast period.
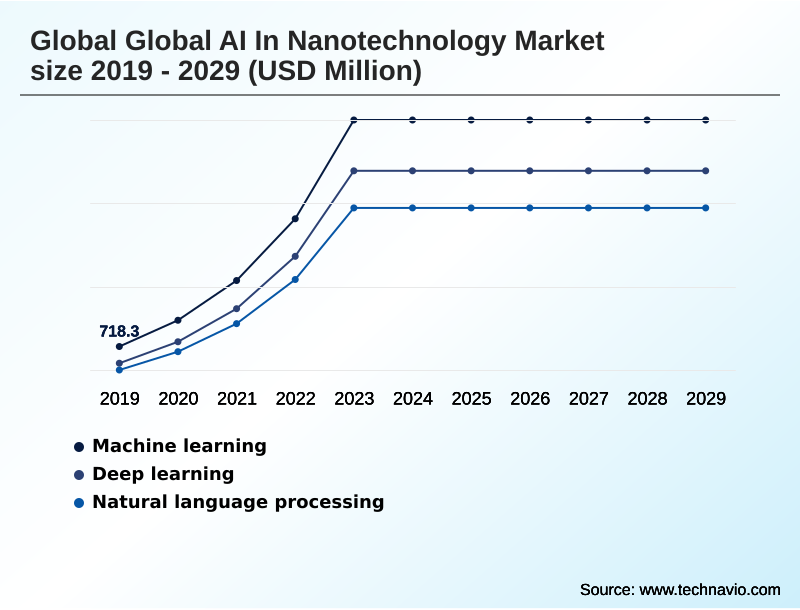
- By Technology - Machine learning segment was valued at USD 3.04 billion in 2023
- By Application - Nanoelectronics and optoelectronics segment accounted for the largest market revenue share in 2023
Market Size & Forecast
- Market Opportunities: USD 20.22 billion
- Market Future Opportunities: USD 12.87 billion
- CAGR from 2024 to 2029 : 19.3%
Market Summary
- The AI in nanotechnology market is undergoing a profound transformation, moving beyond academic research to become a cornerstone of industrial innovation. This convergence leverages artificial intelligence, including deep learning and machine learning, to decipher and manipulate matter at the molecular level, overcoming the limitations of traditional experimentation.
- The primary market dynamic is the ability of AI to drastically shorten innovation cycles and de-risk investment in novel nanomaterials and nanodevices. For example, in the pharmaceutical sector, a company can use AI for the high-throughput virtual screening of millions of potential drug compounds, identifying candidates with optimal binding affinity and low predicted toxicity in a fraction of the time.
- This accelerates the path to clinical trials. Key verticals like healthcare, electronics, and energy are the primary beneficiaries, using techniques like inverse design and process analytical technology to create next-generation products. However, progress is constrained by challenges in data quality and the high cost of implementation, alongside a shortage of interdisciplinary talent skilled in both AI and materials science.
- Success depends on creating robust digital twin models and autonomous laboratories to bridge the gap from simulation to scalable manufacturing.
What will be the Size of the Global AI In Nanotechnology Market during the forecast period?
Get Key Insights on Market Forecast (PDF) Get Free Sample
How is the Global AI In Nanotechnology Market Segmented?
The global ai in nanotechnology industry research report provides comprehensive data (region-wise segment analysis), with forecasts and estimates in "USD million" for the period 2025-2029, as well as historical data from 2019-2023 for the following segments.
- Technology
- Machine learning
- Deep learning
- Natural language processing
- Application
- Nanoelectronics and optoelectronics
- Nanomedicine and drug delivery
- Nanosensors and nanodevices
- End-user
- Electronics and semiconductor
- Healthcare and biomedical
- Energy and environment
- Geography
- North America
- US
- Canada
- Mexico
- APAC
- China
- Japan
- India
- Europe
- Germany
- UK
- France
- Middle East and Africa
- Saudi Arabia
- UAE
- South Africa
- South America
- Brazil
- Argentina
- Colombia
- Rest of World (ROW)
- North America
By Technology Insights
The machine learning segment is estimated to witness significant growth during the forecast period.
The global AI in nanotechnology market is segmented by several critical factors, including application, industry, and region. Machine learning constitutes the foundational technology segment, enabling predictive modeling from complex, high-dimensional data.
This capability is pivotal for establishing precise structure-property and process-property relationships, shifting research from trial-and-error to a data-driven science. Key applications include high-throughput virtual screening of nanomaterials and manufacturing process optimization.
For instance, in nanoelectronics, these algorithms improve defect detection in semiconductor fabrication by over 15%, a critical gain for maintaining production yields.
By leveraging techniques like generative AI, this segment also drives inverse design, where AI platforms propose novel chemical compositions and nanostructures to meet specific performance targets, accelerating the creation of advanced battery materials and high-performance composites.
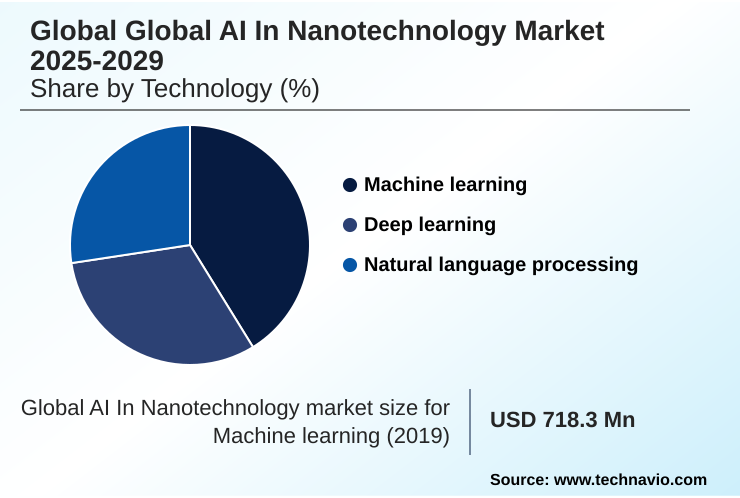
The Machine learning segment was valued at USD 3.04 billion in 2023 and showed a gradual increase during the forecast period.
Regional Analysis
North America is estimated to contribute 33.1% to the growth of the global market during the forecast period.Technavio’s analysts have elaborately explained the regional trends and drivers that shape the market during the forecast period.
See How Global AI In Nanotechnology Market Demand is Rising in North America Get Free Sample
The geographic landscape of the global AI in nanotechnology market is led by North America, which is poised to contribute 33.1% of the market's incremental growth.
This dominance is fueled by a robust ecosystem combining top-tier research institutions, substantial venture capital, and the presence of leading technology and biopharmaceutical firms, particularly in the United States.
Following closely, APAC is the fastest-growing region, accounting for 32.91% of the opportunity, driven by massive government investments and a world-leading electronics manufacturing base in countries like China, Japan, and South Korea.
These regions leverage technologies like graph neural networks and diffusion models to innovate in nanoelectronics and nanomedicine. Europe also holds a significant share, focusing on industrial applications, sustainable energy production, and the development of high-performance composites.
Market Dynamics
Our researchers analyzed the data with 2024 as the base year, along with the key drivers, trends, and challenges. A holistic analysis of drivers will help companies refine their marketing strategies to gain a competitive advantage.
- The strategic implementation of AI within nanotechnology is creating significant value by addressing complex, industry-specific challenges. The use of generative AI for de novo nanomaterials is transforming discovery, allowing companies to design materials with predefined properties. This is complemented by AI-driven closed-loop autonomous laboratories, which automate the entire research cycle from hypothesis to experimental validation, dramatically compressing timelines.
- For instance, companies using this approach report a twofold increase in the identification of viable R&D candidates compared to those using conventional screening. To ensure commercial viability, firms are integrating AI for nanotech process optimization, using digital twin models for nanomaterial production to bridge the gap between simulation and manufacturing.
- Machine learning in nanomedicine drug delivery is enabling personalized therapies, while AI models for nanoparticle toxicity prediction address critical safety and regulatory hurdles. In electronics, AI for nanoscale semiconductor fabrication is essential for creating next-generation chips.
- This comprehensive application, from AI-guided synthesis of high-performance nanocomposites and nanosensor data analysis with machine learning to quantum computing for nanoscale material simulation, underscores the technology's transformative potential across sectors. The ability to perform predictive modeling for nanoparticle biodistribution and use AI-based defect detection in nanoelectronics further solidifies its role as an indispensable tool for modern industry.
What are the key market drivers leading to the rise in the adoption of Global AI In Nanotechnology Industry?
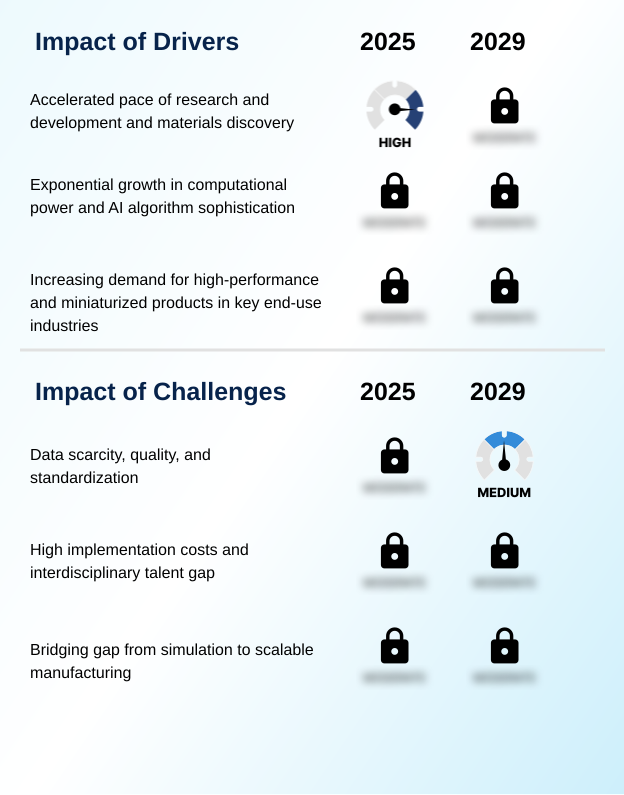
- The accelerated pace of research and development, particularly in novel materials discovery, serves as a primary driver for market growth.
- Key drivers are propelling the market forward by making advanced computational science more accessible and effective.
- The democratization of high-performance computing through scalable cloud platforms has reduced infrastructure setup costs by up to 90% for startups, fostering a diverse innovation ecosystem.
- This is coupled with the exponential growth in the sophistication of AI algorithms, such as those used for molecular dynamics simulation.
- These tools allow for the rapid discovery of materials with superior performance, with some AI-guided designs achieving a 20% improvement in desired properties compared to conventionally developed materials.
- Furthermore, intense demand from end-use industries for miniaturized and high-performance products, particularly in electronics and healthcare, creates a powerful market-pull dynamic, ensuring continued investment and development.
What are the market trends shaping the Global AI In Nanotechnology Industry?
- A key market trend is the emergence of generative AI for de novo materials design. This approach is shifting the paradigm from predictive modeling to the automated invention of novel nanomaterials.
- The market is increasingly defined by a strategic shift from pure materials discovery to integrating manufacturability and process optimization. This evolution addresses the critical lab-to-fab gap, ensuring that novel nanomaterials designed via simulation are viable for industrial-scale production. The adoption of AI is accelerating R&D timelines by over 50% in key sectors.
- This trend is embodied by the creation of closed-loop, autonomous laboratories, which automate the entire scientific method. The emergence of generative AI for de novo materials design represents a paradigm shift, enabling automated invention rather than mere screening.
- For instance, this approach allows for a 40% increase in the exploration of novel material candidates for applications in nanomedicine and drug delivery, fundamentally altering the innovation landscape.
What challenges does the Global AI In Nanotechnology Industry face during its growth?
- Significant challenges affecting industry growth include the scarcity, inconsistent quality, and lack of standardization of data required for robust AI model training.
- Despite its potential, the market faces significant operational hurdles. The primary challenge is the scarcity of high-quality, standardized data, which can increase the time required for data preparation by over 60%, creating a major bottleneck. AI models trained on inconsistent or incomplete data produce unreliable predictions, eroding confidence and leading to costly failed experiments.
- This data issue is compounded by high implementation costs and a severe interdisciplinary talent gap. The shortage of professionals with dual expertise in AI and materials science extends project timelines by an average of 35%.
- Finally, bridging the gap from simulation to scalable manufacturing remains a critical challenge, as lab-scale synthesis protocols often fail to translate to industrial production, risking the commercial viability of discoveries.
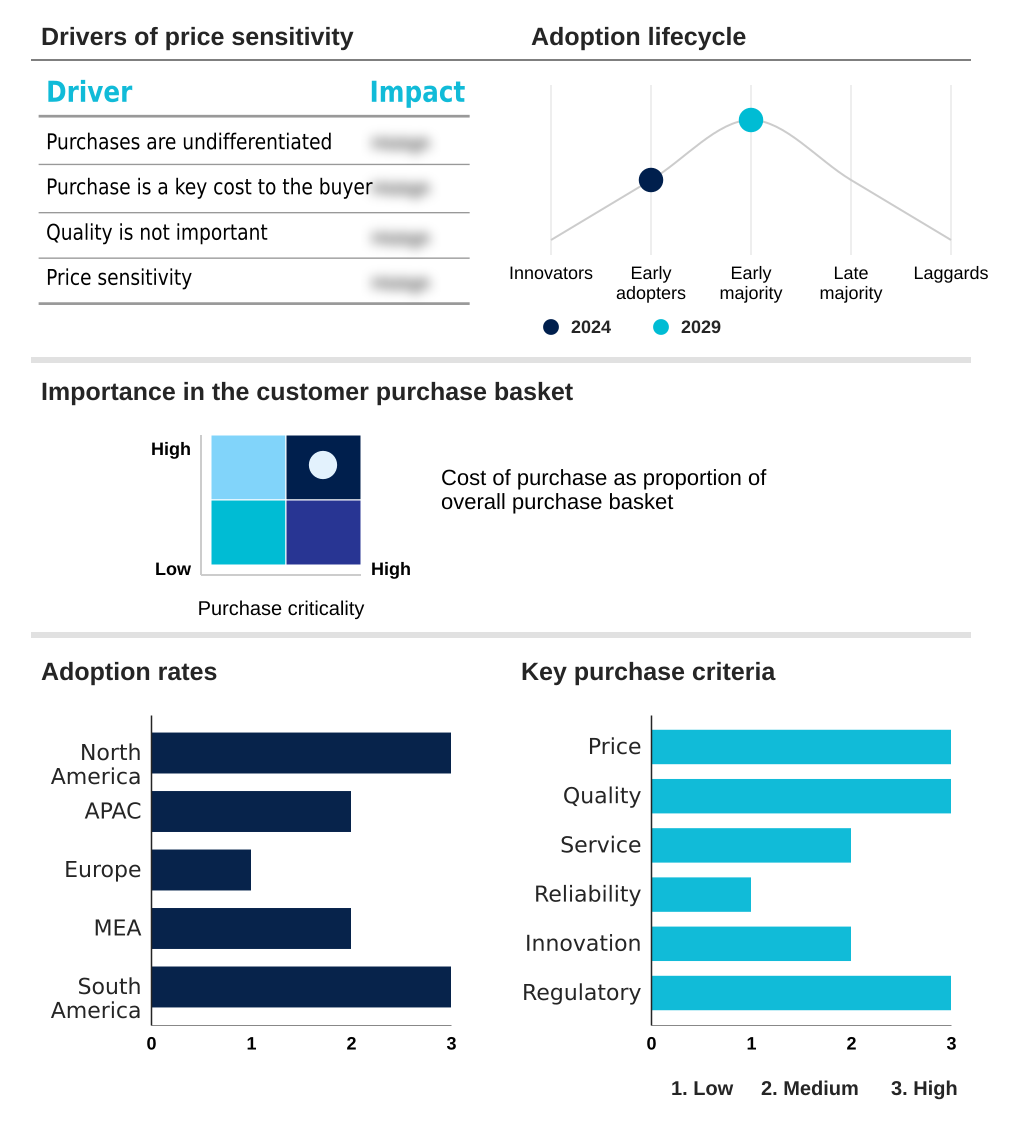
Exclusive Technavio Analysis on Customer Landscape
The global ai in nanotechnology market forecasting report includes the adoption lifecycle of the market, covering from the innovator’s stage to the laggard’s stage. It focuses on adoption rates in different regions based on penetration. Furthermore, the global ai in nanotechnology market report also includes key purchase criteria and drivers of price sensitivity to help companies evaluate and develop their market growth analysis strategies.
Customer Landscape of Global AI In Nanotechnology Industry
Competitive Landscape
Companies are implementing various strategies, such as strategic alliances, global ai in nanotechnology market forecast, partnerships, mergers and acquisitions, geographical expansion, and product/service launches, to enhance their presence in the industry.
ABB Ltd. - Offers agentic AI and generative AI platforms, enabling scalable simulations and data-driven innovation in nanotechnology research through cloud-based infrastructure and advanced toolkits.
The industry research and growth report includes detailed analyses of the competitive landscape of the market and information about key companies, including:
- ABB Ltd.
- Agilent Technologies Inc.
- Amazon Web Services Inc.
- Cisco Systems Inc.
- Cognex Corp.
- Dell Technologies Inc.
- Fujitsu Ltd.
- General Electric Co.
- Google LLC
- Hewlett Packard
- Hitachi Ltd.
- Intel Corp.
- IBM Corp.
- Microsoft Corp.
- NanoString Technologies Inc.
- NVIDIA Corp.
- Qualcomm Inc.
- Samsung Electronics Co. Ltd.
- Siemens AG
- Thermo Fisher Scientific Inc.
Qualitative and quantitative analysis of companies has been conducted to help clients understand the wider business environment as well as the strengths and weaknesses of key industry players. Data is qualitatively analyzed to categorize companies as pure play, category-focused, industry-focused, and diversified; it is quantitatively analyzed to categorize companies as dominant, leading, strong, tentative, and weak.
Recent Development and News in Global ai in nanotechnology market
- In September 2024, Absci announced an expanded collaboration with the pharmaceutical company Almirall to leverage its integrated drug creation platform, which uses generative AI to discover and design novel antibody candidates for dermatological indications.
- In November 2024, Mitra Chem, a battery materials company, formalized a partnership with a major automotive OEM to use its AI-powered platform to accelerate the development and manufacturing of iron-based cathodes for next-generation electric vehicle batteries.
- In February 2025, NVIDIA Corp. launched a significant update to its cuLitho software library, enhancing its deep learning capabilities to further accelerate computational lithography and enable the design and manufacturing of more advanced semiconductor chips at the nanometer scale.
- In May 2025, Fujitsu Ltd., in partnership with RIKEN and the University of Tokyo, released initial findings from their collaborative effort to develop generative AI for scientific discovery, demonstrating an AI model that successfully proposed novel material structures with high synthesizability scores.
Dive into Technavio’s robust research methodology, blending expert interviews, extensive data synthesis, and validated models for unparalleled Global AI In Nanotechnology Market insights. See full methodology.
| Market Scope | |
|---|---|
| Page number | 308 |
| Base year | 2024 |
| Historic period | 2019-2023 |
| Forecast period | 2025-2029 |
| Growth momentum & CAGR | Accelerate at a CAGR of 19.3% |
| Market growth 2025-2029 | USD 12867.4 million |
| Market structure | Fragmented |
| YoY growth 2024-2025(%) | 18.6% |
| Key countries | US, Canada, Mexico, China, Japan, India, South Korea, Australia, Indonesia, Germany, UK, France, Italy, Spain, The Netherlands, Saudi Arabia, UAE, South Africa, Israel, Turkey, Brazil, Argentina and Colombia |
| Competitive landscape | Leading Companies, Market Positioning of Companies, Competitive Strategies, and Industry Risks |
Research Analyst Overview
- The global AI in nanotechnology market is defined by its capacity to solve immense complexity at the atomic scale, transitioning from a research concept to a commercially vital tool. Boardroom decisions on budgeting and product strategy are now directly influenced by this technology's ability to compress innovation timelines.
- For example, the integration of AI has been shown to reduce material discovery cycles by up to 40% compared to traditional empirical methods. This market leverages technologies like machine learning, deep learning, and natural language processing to enable breakthroughs. Key activities include high-throughput virtual screening of nanoparticles and the use of graph neural networks and transformer models for inverse design.
- In practice, this means designing novel nanomaterials like quantum dots, carbon nanotubes, and lipid nanoparticles (LNP) from the ground up. This extends to creating self-driving labs and autonomous laboratories that integrate process analytical technology (PAT) and digital twins for nanomedicine and nanoelectronics development, accelerating the path from de novo materials design to scalable nanofabrication, ensuring both high performance and biocompatibility.
What are the Key Data Covered in this Global AI In Nanotechnology Market Research and Growth Report?
-
What is the expected growth of the Global AI In Nanotechnology Market between 2025 and 2029?
-
USD 12.87 billion, at a CAGR of 19.3%
-
-
What segmentation does the market report cover?
-
The report is segmented by Technology (Machine learning, Deep learning, Natural language processing ), Application (Nanoelectronics and optoelectronics, Nanomedicine and drug delivery, Nanosensors and nanodevices), End-user (Electronics and semiconductor, Healthcare and biomedical, Energy and environment) and Geography (North America, APAC, Europe, Middle East and Africa, South America)
-
-
Which regions are analyzed in the report?
-
North America, APAC, Europe, Middle East and Africa and South America
-
-
What are the key growth drivers and market challenges?
-
Accelerated pace of research and development and materials discovery, Data scarcity, quality, and standardization
-
-
Who are the major players in the Global AI In Nanotechnology Market?
-
ABB Ltd., Agilent Technologies Inc., Amazon Web Services Inc., Cisco Systems Inc., Cognex Corp., Dell Technologies Inc., Fujitsu Ltd., General Electric Co., Google LLC, Hewlett Packard, Hitachi Ltd., Intel Corp., IBM Corp., Microsoft Corp., NanoString Technologies Inc., NVIDIA Corp., Qualcomm Inc., Samsung Electronics Co. Ltd., Siemens AG and Thermo Fisher Scientific Inc.
-
Market Research Insights
- The market dynamics are defined by a powerful synergy between AI advancements and the demand for high-performance products. This integration allows for the accelerated pace of research and development, with automated nanorobot control reducing experimental cycles by over 60% in some cases.
- The ability to de-risk investment is a major draw, as predictive modeling improves the success rate of identifying viable materials by 30% compared to conventional methods. This drives adoption in sectors focused on next-generation semiconductors and personalized medicine. Companies can optimize manufacturing processes, achieving higher yields and greater product consistency.
- This focus on tangible outcomes fuels a self-reinforcing cycle where more data generation leads to more sophisticated AI, solidifying its role in modern industrial science.
We can help! Our analysts can customize this global ai in nanotechnology market research report to meet your requirements.
 RIA -
RIA - 
