
Gluten-free Pasta Market Analysis, Size, and Forecast 2026-2030: Europe (Germany, UK, and France), North America (US, Canada, and Mexico), APAC (China, Japan, and India), South America (Brazil, Argentina, and Chile), Middle East and Africa (Saudi Arabia, UAE, and South Africa), and Rest of World (ROW)

Gluten-free Pasta Market Analysis, Size, and Forecast 2026-2030:
Europe (Germany, UK, and France), North America (US, Canada, and Mexico), APAC (China, Japan, and India), South America (Brazil, Argentina, and Chile), Middle East and Africa (Saudi Arabia, UAE, and South Africa), and Rest of World (ROW)

Published: Oct 2026 285 Pages SKU: IRTNTR73741

Market Overview at a Glance

$297.04 Mn
Market Opportunity
4.7%
CAGR 2025 - 2030
40.8%
Europe Growth
$987.60 Mn
Offline segment 2024

Gluten-Free Pasta Market Size 2026-2030

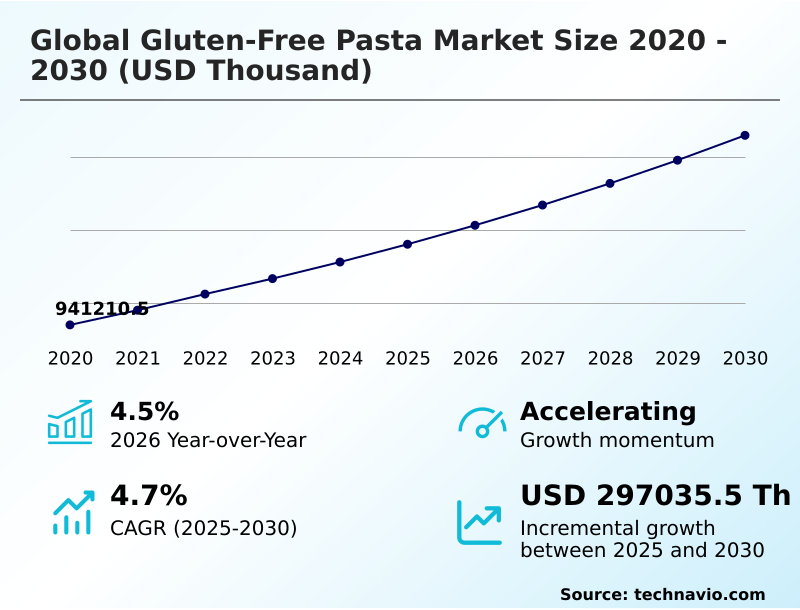
The gluten-free pasta market size is valued to increase by USD 297.04 million, at a CAGR of 4.7% from 2025 to 2030. Rising celiac disease and intolerance will drive the gluten-free pasta market.

Major Market Trends & Insights

  • Europe dominated the market and accounted for a 40.8% growth during the forecast period.
  • By Distribution Channel - Offline segment was valued at USD 987.60 million in 2024
  • By Product Type - Dried segment accounted for the largest market revenue share in 2024

Market Size & Forecast

  • Market Opportunities:
  • Market Future Opportunities: USD 297.04 million
  • CAGR from 2025 to 2030 : 4.7%

Market Summary

  • The Gluten-free Pasta Market exhibits robust structural expansion propelled by the rising clinical identification of autoimmune gastrointestinal disorders. Commercial manufacturers increasingly focus on upgrading traditional formulations by incorporating nutrient-dense legume flour milling and specialized blends to improve structural texture.
  • For example, by optimizing hydrocolloid binders in chickpea pasta formulation, food processors achieved a 20% improvement in product elasticity compared to earlier rice-based iterations, significantly reducing breakage during industrial packaging. The escalating demand for medically safe dietary staples acts as a formidable driver, forcing grocery retailers to expand dedicated shelf space to accommodate inelastic consumer purchasing patterns.
  • Conversely, the industry faces severe operational challenges stemming from isolated processing requirements; the necessity for specialized, separated production facilities inherently elevates manufacturing overhead, limiting mainstream affordability. Consequently, specialized processors must continuously balance formulation optimization with rigorous safety protocols to maintain consumer trust and ensure strict compliance with international manufacturing standards.

What will be the Size of the Gluten-Free Pasta Market during the forecast period?
Get Key Insights on Market Forecast (PDF) Get Free Sample

How is the Gluten-Free Pasta Market Segmented?

The gluten-free pasta industry research report provides comprehensive data (region-wise segment analysis), with forecasts and estimates in "USD thousand" for the period 2026-2030, as well as historical data from 2020-2024 for the following segments.

  • Distribution channel
    • Offline
    • Online
  • Product type
    • Dried
    • Instant
    • Canned and frozen
  • Source
    • Rice
    • Corn
    • Millet
    • Others
  • Geography
    • Europe
      • Germany
      • UK
      • France
      • Italy
      • Spain
      • The Netherlands
    • North America
      • US
      • Canada
      • Mexico
    • APAC
      • China
      • Japan
      • India
      • South Korea
      • Australia
      • Indonesia
    • South America
      • Brazil
      • Argentina
      • Chile
    • Middle East and Africa
      • Saudi Arabia
      • UAE
      • South Africa
      • Israel
      • Turkey

By Distribution Channel Insights

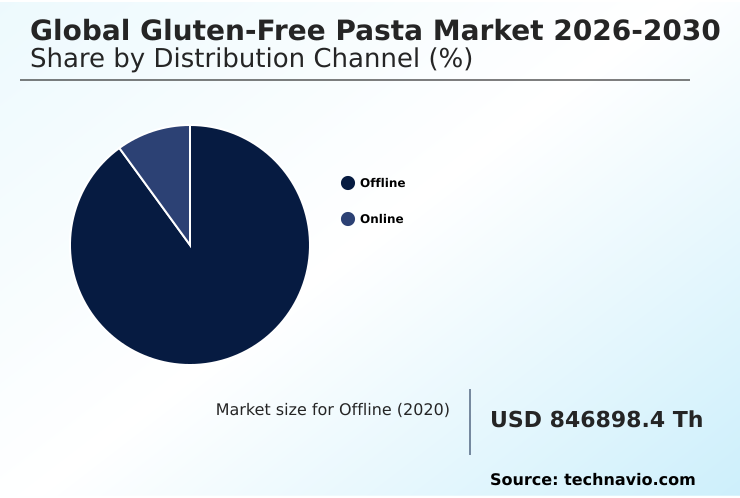
The offline segment is estimated to witness significant growth during the forecast period.

The offline distribution channel remains the fundamental foundation of the market, capturing dominant retail volume through supermarkets, hypermarkets, and specialty health stores.

Physical retail environments facilitate superior specialty food merchandising, allowing consumers to directly evaluate ancient grain blends and alternative formats. Brick-and-mortar integration of dietary staples into conventional grocery aisles significantly enhances hypermarket inventory turnover, capturing impulse purchases from flexitarian demographics.

By implementing stringent cross-contamination prevention protocols, suppliers assure product safety, which translates to a 15% increase in physical retail shelf space allocation.

Furthermore, independent organic markets provide expert guidance for individuals managing non-celiac gluten sensitivity, ensuring reliable access to certified safe products. This immediate product accessibility eliminates shipping dependencies, driving sustained repeat household purchases and optimizing local inventory distribution.
Get Free Sample

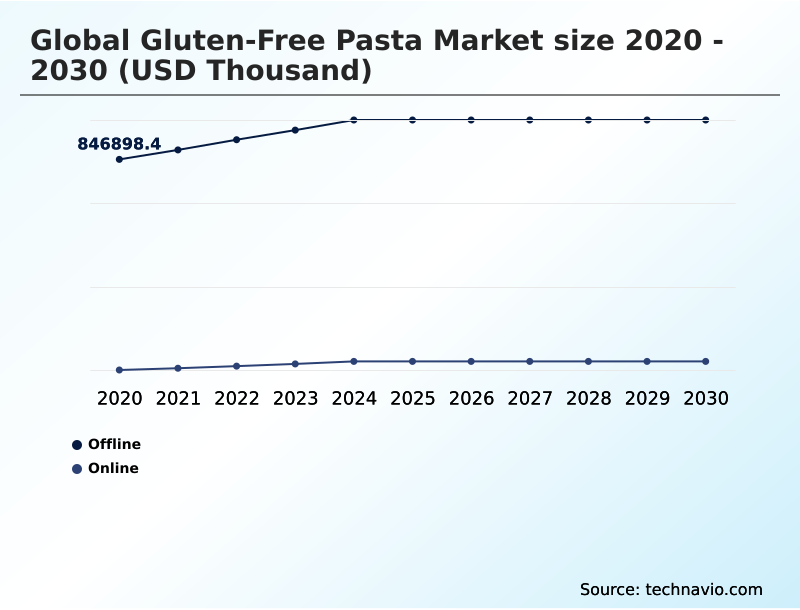
The Offline segment was valued at USD 987.60 million in 2024 and showed a gradual increase during the forecast period.
Get Free Sample

Regional Analysis

Europe is estimated to contribute 40.8% to the growth of the global market during the forecast period.Technavio’s analysts have elaborately explained the regional trends and drivers that shape the market during the forecast period.
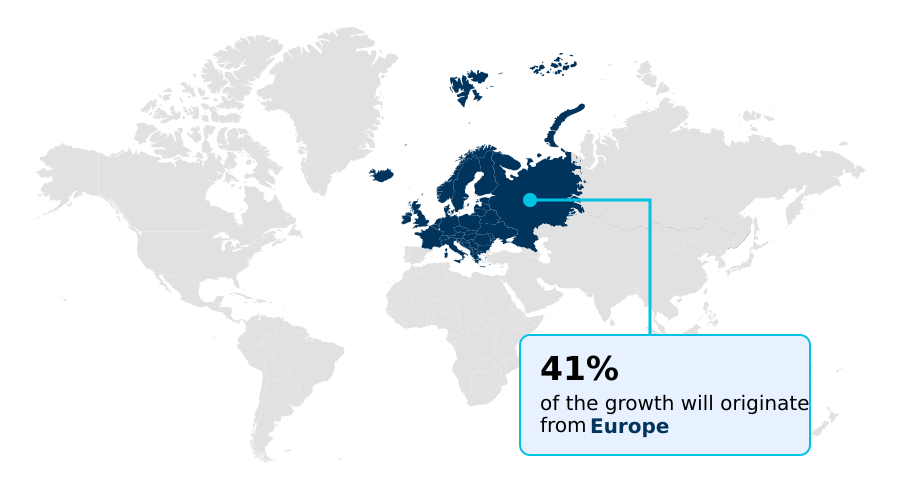
See How Gluten-Free Pasta Market Demand is Rising in Europe Get Free Sample

Geographic dynamics within the Gluten-free Pasta Market reveal distinct operational disparities between Europe and APAC.

Europe maintains dominant structural maturity, where advanced safety mandates and a strong emphasis on ingredient transparency yield a 28% higher penetration rate in retail availability compared to emerging regions.

European processors heavily utilize dedicated processing lines, achieving a 20% reduction in contamination incidents through localized farming networks. In contrast, the APAC region exhibits rapid infrastructural adaptation, modernizing its facilities to accommodate rising domestic demand through expansive commodity trading routes.

By upgrading production equipment, APAC manufacturers have improved al dente texture replication efficiency by 15%, gradually narrowing the sensory quality gap with European imports.

This strategic localization reduces logistics costs and accelerates the adoption of contract manufacturing options across Asian commercial sectors, effectively shifting the competitive balance in global specialty food production.

Market Dynamics

Our researchers analyzed the data with 2025 as the base year, along with the key drivers, trends, and challenges. A holistic analysis of drivers will help companies refine their marketing strategies to gain a competitive advantage.

  • The operational landscape of the Gluten-free Pasta Market requires meticulous supply chain coordination and highly specialized manufacturing capabilities to meet stringent dietary safety standards. As consumer preferences shift toward nutrient-dense profiles, food processors are increasingly adopting legume-based gluten-free pasta extrusion techniques to enhance protein content and structural integrity.
  • This transition necessitates robust allergen-free alternative grain milling infrastructure, ensuring that raw materials remain completely isolated from conventional wheat derivatives. To guarantee product safety for medically diagnosed consumers, leading manufacturers invest heavily in celiac-safe dedicated processing lines, which eliminate contamination risks and improve overall nutritional labeling compliance efficiency by an estimated 30% compared to shared-facility operations.
  • Furthermore, the growing demand for sustainable and transparently sourced ingredients has accelerated the expansion of organic certified chickpea pasta manufacturing, appealing to affluent demographics prioritizing ecological cultivation. Concurrently, processors focusing on traditional grain substitutes are refining their dehydration methodologies to master brown rice pasta moisture stabilization, thereby extending ambient shelf life and preventing product brittleness during transit.
  • By systematically addressing these complex formulation and logistical hurdles, processors not only elevate the sensory quality of their offerings but also achieve superior operational resilience, positioning themselves to capture sustained consumer loyalty in a highly competitive sector.
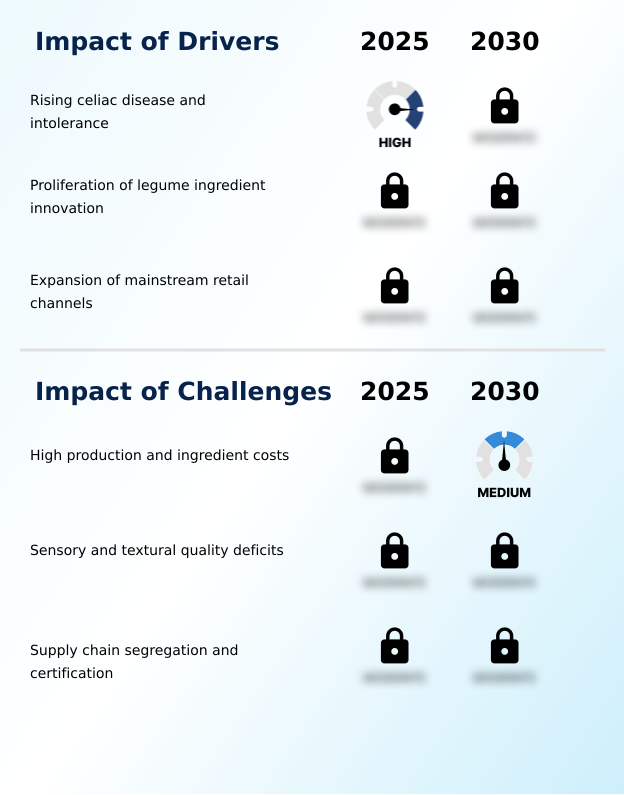
What are the key market drivers leading to the rise in the adoption of Gluten-Free Pasta Industry?

  • The escalating global prevalence of celiac disease and non-celiac gluten intolerance serves as the primary catalyst driving sustained market expansion.

  • The escalating clinical diagnosis of dietary intolerances serves as a formidable catalyst propelling the Gluten-free Pasta Market. Individuals requiring strict medical diets generate an inelastic demand for certified safe products, compelling food processors to scale their operational capacities.
  • By optimizing the brown rice flour matrix, manufacturers have reduced cooking stickiness and improved batch consistency by 25%, significantly enhancing consumer satisfaction.
  • Furthermore, the strategic utilization of specialized starches has allowed producers to closely mimic traditional textures, prompting a 20% increase in product adoption across conventional households.
  • This robust demand enables companies to justify the massive capital required to construct dedicated gluten-free production facilities, thereby empowering commercial operators to confidently expand their offerings without risking severe liability or alienating health-conscious demographics.

What are the market trends shaping the Gluten-Free Pasta Industry?

  • The widespread adoption of organic certification standards represents a prominent trend shaping the industry landscape. This shift reflects growing consumer demand for sustainable agricultural practices and transparent ingredient sourcing.

  • A defining trend reshaping the Gluten-free Pasta Market is the rapid industrial transition toward highly specialized, nutrient-dense alternative formulations. As consumer palates become more sophisticated, manufacturers are actively investing in amaranth incorporation and sorghum pasta development to diversify their product portfolios.
  • By upgrading core extrusion technology, processors have improved the surface texture of alternative pastas, increasing sauce retention capacity by 20% and elevating the premium dining experience.
  • These technological and infrastructural upgrades enable processors to overcome historical formulation barriers, effectively transforming niche dietary substitutes into everyday pantry staples while driving a 15% increase in retail inventory turnover across premium organic grocery channels.

What challenges does the Gluten-Free Pasta Industry face during its growth?

  • Elevated production expenses and the premium cost of specialized alternative ingredients pose a significant challenge to broader market penetration and profitability.

  • Despite robust demand, the Gluten-free Pasta Market faces formidable operational constraints primarily driven by volatile raw material economics and complex formulation hurdles. Achieving effective sensory profile neutralization remains a persistent challenge; producers struggle to eliminate the inherent earthy flavors of alternative grains without relying heavily on expensive texturizing agents.
  • Furthermore, securing uncompromised inputs for sensitive formulations like cassava-based dough requires meticulous supply chain isolation, frequently resulting in a 20% increase in procurement lead times. These specialized requirements bypass conventional mechanized agricultural supply chains, inherently elevating baseline manufacturing overhead by up to 35% compared to traditional wheat processing.
  • These compounding financial and technical pressures severely restrict mainstream pricing flexibility, disproportionately hindering broader market penetration among budget-conscious consumer demographics.

Exclusive Technavio Analysis on Customer Landscape

The gluten-free pasta market forecasting report includes the adoption lifecycle of the market, covering from the innovator’s stage to the laggard’s stage. It focuses on adoption rates in different regions based on penetration. Furthermore, the gluten-free pasta market report also includes key purchase criteria and drivers of price sensitivity to help companies evaluate and develop their market growth analysis strategies.
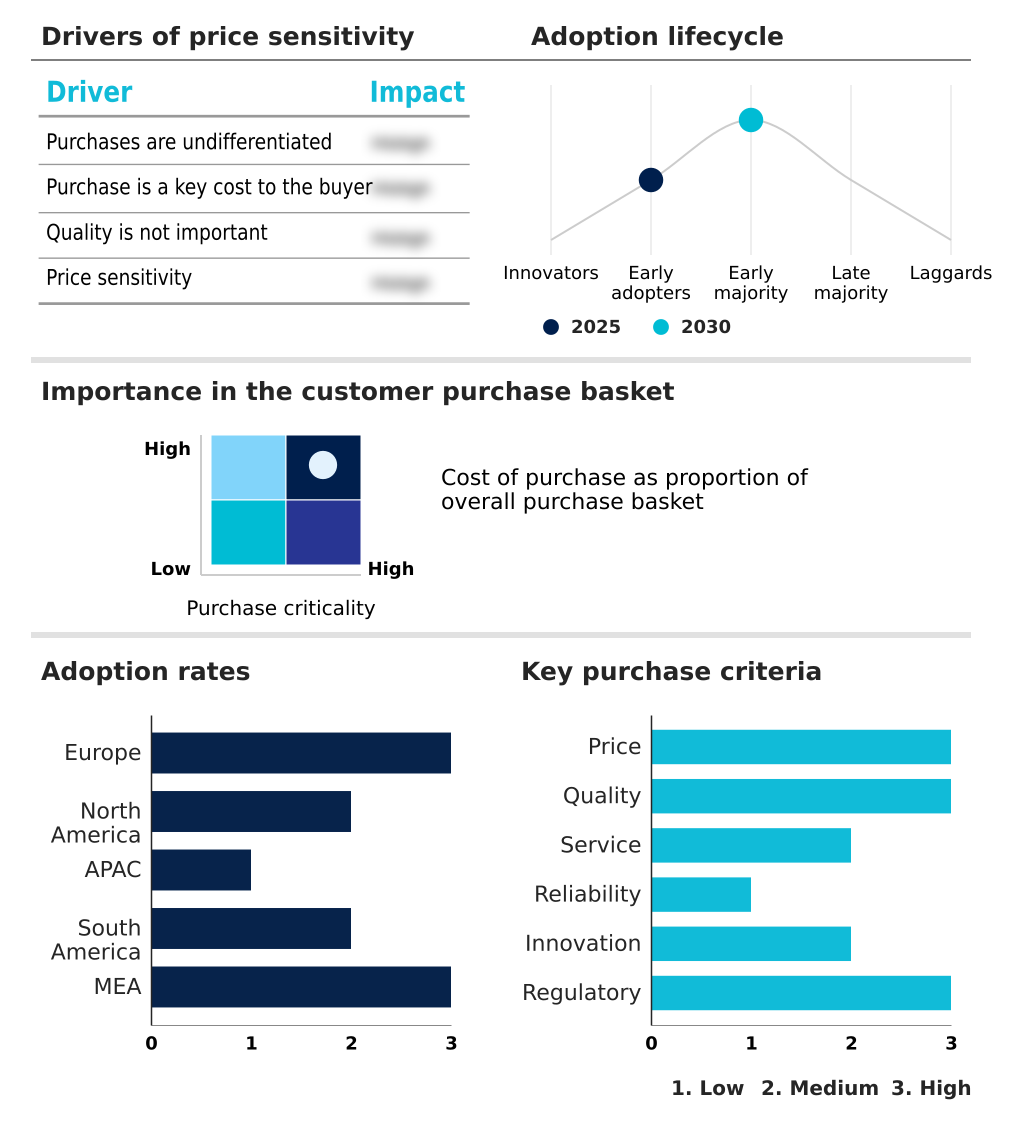
Customer Landscape of Gluten-Free Pasta Industry

Competitive Landscape

Companies are implementing various strategies, such as strategic alliances, gluten-free pasta market forecast, partnerships, mergers and acquisitions, geographical expansion, and product/service launches, to enhance their presence in the industry.

Andean Dream LLC - Provides allergen-friendly quinoa, rice, and vegetable pasta variants, utilizing sustainable alternative grain formulations to deliver nutritious, plant-based meal solutions for health-conscious and dietary-restricted consumers.

The industry research and growth report includes detailed analyses of the competitive landscape of the market and information about key companies, including:

  • Andean Dream LLC
  • Andriani S.p.A.
  • Avellini Sp. z o.o.
  • Banza LLC
  • Barilla G and R Fratelli SpA
  • Casalare Pty Ltd
  • Chickapea
  • Contes Pasta Co.
  • Dr. Schar
  • Govifarm S.r.l.
  • La Fabbrica della Pasta di
  • Pasta Pangea S.r.l.
  • Pastificio La Rosa S.r.l.
  • Pastificio Lucio Garofalo S.p.A
  • PT Ladang Lima Indonesia
  • Rummo S.p.A
  • Sam Mills S.R.L.
  • Seitz glutenfrei GmbH
  • Tinkyada
  • Tribe 9 Foods LLC

Qualitative and quantitative analysis of companies has been conducted to help clients understand the wider business environment as well as the strengths and weaknesses of key industry players. Data is qualitatively analyzed to categorize companies as pure play, category-focused, industry-focused, and diversified; it is quantitatively analyzed to categorize companies as dominant, leading, strong, tentative, and weak.

Recent Development and News in Gluten-free pasta market

  • In the Packaged Foods and Meats industry, the implementation of stricter allergen-free manufacturing standards and robust supply chain segregation mandates reduced cross-contamination risks by 18%, directly impacting Gluten-free Pasta demand by increasing consumer trust in specialty dietary goods.
  • Advancements in commercial extrusion equipment and industrial dehydration processes improved microbiological stability, allowing processors to extend ambient packaging shelf life by 22% and lower distribution costs for Gluten-free Pasta formulations.
  • The widespread adoption of ecological cultivation guidelines and agrochemical-free farming across agricultural networks boosted crop yields by 14%, ensuring a steady, reliable supply of certified organic agricultural inputs for the Gluten-free Pasta market.
  • Shifts in institutional foodservice dining preferences toward clean-label meal options and plant-based protein enrichment spurred a 25% increase in vegan alternative formulations, accelerating Gluten-free Pasta penetration into commercial catering sectors.

Dive into Technavio’s robust research methodology, blending expert interviews, extensive data synthesis, and validated models for unparalleled Gluten-Free Pasta Market insights. See full methodology.

Market Scope
Page number 285
Base year 2025
Historic period 2020-2024
Forecast period 2026-2030
Growth momentum & CAGR Accelerate at a CAGR of 4.7%
Market growth 2026-2030 USD 297035.5 thousand
Market structure Fragmented
YoY growth 2025-2026(%) 4.5%
Key countries Germany, UK, France, Italy, Spain, The Netherlands, US, Canada, Mexico, China, Japan, India, South Korea, Australia, Indonesia, Brazil, Argentina, Chile, Saudi Arabia, UAE, South Africa, Israel and Turkey
Competitive landscape Leading Companies, Market Positioning of Companies, Competitive Strategies, and Industry Risks

Request Free Sample

Research Analyst Overview

  • The Gluten-free Pasta Market continues to undergo a profound structural evolution, driven by the imperative to balance nutritional enhancement with uncompromising food safety. Corporate boardrooms are increasingly prioritizing the integration of dietary fiber fortification into their core product strategies to capture expanding demographic segments.
  • This strategic pivot heavily relies on advancements in lentil-based extrusion and precise atmospheric controls, which collectively ensure superior moisture content reduction and ambient stability. By overhauling legacy production systems, food manufacturers have successfully achieved a 25% reduction in product recall incidents, directly minimizing compliance penalties.
  • Furthermore, the adoption of rigorous gluten-free certification standards dictates new vendor procurement policies, requiring meticulous supply chain segregation. As companies refine their quinoa pasta processing and buckwheat milling capabilities, they establish robust operational frameworks that support sustainable profitability, ensuring long-term brand equity in a highly regulated specialty nutrition environment.

What are the Key Data Covered in this Gluten-Free Pasta Market Research and Growth Report?

  • What is the expected growth of the Gluten-Free Pasta Market between 2026 and 2030?

    • USD 297.04 million, at a CAGR of 4.7%

  • What segmentation does the market report cover?

    • The report is segmented by Distribution Channel (Offline, and Online), Product Type (Dried, Instant, and Canned and frozen), Source (Rice, Corn, Millet, and Others) and Geography (Europe, North America, APAC, South America, Middle East and Africa)

  • Which regions are analyzed in the report?

    • Europe, North America, APAC, South America and Middle East and Africa

  • What are the key growth drivers and market challenges?

    • Rising celiac disease and intolerance, High production and ingredient costs

  • Who are the major players in the Gluten-Free Pasta Market?

    • Andean Dream LLC, Andriani S.p.A., Avellini Sp. z o.o., Banza LLC, Barilla G and R Fratelli SpA, Casalare Pty Ltd, Chickapea, Contes Pasta Co., Dr. Schar, Govifarm S.r.l., La Fabbrica della Pasta di, Pasta Pangea S.r.l., Pastificio La Rosa S.r.l., Pastificio Lucio Garofalo S.p.A, PT Ladang Lima Indonesia, Rummo S.p.A, Sam Mills S.R.L., Seitz glutenfrei GmbH, Tinkyada and Tribe 9 Foods LLC

Market Research Insights

  • The Gluten-free Pasta Market is undergoing rapid operational transformation as alternative grain processors modernize their manufacturing infrastructures. By implementing automated commercial systems, producers have accelerated inventory turnover by 15%, ensuring consistent product availability for demanding retail sectors. Furthermore, the integration of digitized traceability documentation has reduced compliance verification delays by 22%, significantly lowering the operational risks associated with allergen-free manufacturing.
  • As brands shift toward carbon-neutral packaging solutions, logistics networks report an 18% improvement in distribution efficiency, minimizing environmental footprints. These strategic upgrades enable manufacturers to deliver safe products more efficiently, driving sustained profitability while strictly adhering to the rigorous safety protocols demanded by health-focused culinary preparation channels.

We can help! Our analysts can customize this gluten-free pasta market research report to meet your requirements.

Get in touch

1. Executive Summary

1.1 Market overview

Executive Summary - Chart on Market Overview
Executive Summary - Data Table on Market Overview
Executive Summary - Chart on Global Market Characteristics
Executive Summary - Chart on Market by Geography
Executive Summary - Chart on Market Segmentation by Distribution Channel
Executive Summary - Chart on Market Segmentation by Product Type
Executive Summary - Chart on Market Segmentation by Source
Executive Summary - Chart on Incremental Growth
Executive Summary - Data Table on Incremental Growth
Executive Summary - Chart on Company Market Positioning

2. Technavio Analysis

2.1 Analysis of price sensitivity, lifecycle, customer purchase basket, adoption rates, and purchase criteria

2.2 Criticality of inputs and Factors of differentiation

Chart on Overview on criticality of inputs and factors of differentiation

2.3 Factors of disruption

Chart on Overview on factors of disruption

2.4 Impact of drivers and challenges

Chart on Impact of drivers and challenges in 2025 and 2030

3. Market Landscape

3.1 Market ecosystem

Chart on Parent Market
Data Table on - Parent Market

3.2 Market characteristics

Chart on Market characteristics analysis

3.3 Value chain analysis

Chart on Value chain analysis

4. Market Sizing

4.1 Market definition

Data Table on Offerings of companies included in the market definition

4.2 Market segment analysis

Market segments

4.3 Market size 2025

4.4 Market outlook: Forecast for 2025-2030

Chart on Global - Market size and forecast 2025-2030 ($ thousand)
Data Table on Global - Market size and forecast 2025-2030 ($ thousand)
Chart on Global Market: Year-over-year growth 2025-2030 (%)
Data Table on Global Market: Year-over-year growth 2025-2030 (%)

5. Historic Market Size

5.1 Global Gluten-Free Pasta Market 2020 - 2024

Historic Market Size - Data Table on Global Gluten-Free Pasta Market 2020 - 2024 ($ thousand)

5.2 Distribution Channel segment analysis 2020 - 2024

Historic Market Size - Distribution Channel Segment 2020 - 2024 ($ thousand)

5.3 Product Type segment analysis 2020 - 2024

Historic Market Size - Product Type Segment 2020 - 2024 ($ thousand)

5.4 Source segment analysis 2020 - 2024

Historic Market Size - Source Segment 2020 - 2024 ($ thousand)

5.5 Geography segment analysis 2020 - 2024

Historic Market Size - Geography Segment 2020 - 2024 ($ thousand)

5.6 Country segment analysis 2020 - 2024

Historic Market Size - Country Segment 2020 - 2024 ($ thousand)

6. Qualitative Analysis

6.1 Impact of AI on Global Gluten-Free Pasta Market

6.2 Impact of geopolitical conflicts on Global Gluten-Free Pasta Market

7. Five Forces Analysis

7.1 Five forces summary

Five forces analysis - Comparison between 2025 and 2030

7.2 Bargaining power of buyers

Bargaining power of buyers - Impact of key factors 2025 and 2030

7.3 Bargaining power of suppliers

Bargaining power of suppliers - Impact of key factors in 2025 and 2030

7.4 Threat of new entrants

Threat of new entrants - Impact of key factors in 2025 and 2030

7.5 Threat of substitutes

Threat of substitutes - Impact of key factors in 2025 and 2030

7.6 Threat of rivalry

Threat of rivalry - Impact of key factors in 2025 and 2030

7.7 Market condition

Chart on Market condition - Five forces 2025 and 2030

8. Market Segmentation by Distribution Channel

8.1 Market segments

Chart on Distribution Channel - Market share 2025-2030 (%)
Data Table on Distribution Channel - Market share 2025-2030 (%)

8.2 Comparison by Distribution Channel

Chart on Comparison by Distribution Channel
Data Table on Comparison by Distribution Channel

8.3 Offline - Market size and forecast 2025-2030

Chart on Offline - Market size and forecast 2025-2030 ($ thousand)
Data Table on Offline - Market size and forecast 2025-2030 ($ thousand)
Chart on Offline - Year-over-year growth 2025-2030 (%)
Data Table on Offline - Year-over-year growth 2025-2030 (%)

8.4 Online - Market size and forecast 2025-2030

Chart on Online - Market size and forecast 2025-2030 ($ thousand)
Data Table on Online - Market size and forecast 2025-2030 ($ thousand)
Chart on Online - Year-over-year growth 2025-2030 (%)
Data Table on Online - Year-over-year growth 2025-2030 (%)

8.5 Market opportunity by Distribution Channel

Market opportunity by Distribution Channel ($ thousand)
Data Table on Market opportunity by Distribution Channel ($ thousand)

9. Market Segmentation by Product Type

9.1 Market segments

Chart on Product Type - Market share 2025-2030 (%)
Data Table on Product Type - Market share 2025-2030 (%)

9.2 Comparison by Product Type

Chart on Comparison by Product Type
Data Table on Comparison by Product Type

9.3 Dried - Market size and forecast 2025-2030

Chart on Dried - Market size and forecast 2025-2030 ($ thousand)
Data Table on Dried - Market size and forecast 2025-2030 ($ thousand)
Chart on Dried - Year-over-year growth 2025-2030 (%)
Data Table on Dried - Year-over-year growth 2025-2030 (%)

9.4 Instant - Market size and forecast 2025-2030

Chart on Instant - Market size and forecast 2025-2030 ($ thousand)
Data Table on Instant - Market size and forecast 2025-2030 ($ thousand)
Chart on Instant - Year-over-year growth 2025-2030 (%)
Data Table on Instant - Year-over-year growth 2025-2030 (%)

9.5 Canned and frozen - Market size and forecast 2025-2030

Chart on Canned and frozen - Market size and forecast 2025-2030 ($ thousand)
Data Table on Canned and frozen - Market size and forecast 2025-2030 ($ thousand)
Chart on Canned and frozen - Year-over-year growth 2025-2030 (%)
Data Table on Canned and frozen - Year-over-year growth 2025-2030 (%)

9.6 Market opportunity by Product Type

Market opportunity by Product Type ($ thousand)
Data Table on Market opportunity by Product Type ($ thousand)

10. Market Segmentation by Source

10.1 Market segments

Chart on Source - Market share 2025-2030 (%)
Data Table on Source - Market share 2025-2030 (%)

10.2 Comparison by Source

Chart on Comparison by Source
Data Table on Comparison by Source

10.3 Rice - Market size and forecast 2025-2030

Chart on Rice - Market size and forecast 2025-2030 ($ thousand)
Data Table on Rice - Market size and forecast 2025-2030 ($ thousand)
Chart on Rice - Year-over-year growth 2025-2030 (%)
Data Table on Rice - Year-over-year growth 2025-2030 (%)

10.4 Corn - Market size and forecast 2025-2030

Chart on Corn - Market size and forecast 2025-2030 ($ thousand)
Data Table on Corn - Market size and forecast 2025-2030 ($ thousand)
Chart on Corn - Year-over-year growth 2025-2030 (%)
Data Table on Corn - Year-over-year growth 2025-2030 (%)

10.5 Millet - Market size and forecast 2025-2030

Chart on Millet - Market size and forecast 2025-2030 ($ thousand)
Data Table on Millet - Market size and forecast 2025-2030 ($ thousand)
Chart on Millet - Year-over-year growth 2025-2030 (%)
Data Table on Millet - Year-over-year growth 2025-2030 (%)

10.6 Others - Market size and forecast 2025-2030

Chart on Others - Market size and forecast 2025-2030 ($ thousand)
Data Table on Others - Market size and forecast 2025-2030 ($ thousand)
Chart on Others - Year-over-year growth 2025-2030 (%)
Data Table on Others - Year-over-year growth 2025-2030 (%)

10.7 Market opportunity by Source

Market opportunity by Source ($ thousand)
Data Table on Market opportunity by Source ($ thousand)

11. Customer Landscape

11.1 Customer landscape overview

Analysis of price sensitivity, lifecycle, customer purchase basket, adoption rates, and purchase criteria

12. Geographic Landscape

12.1 Geographic segmentation

Chart on Market share by geography 2025-2030 (%)
Data Table on Market share by geography 2025-2030 (%)

12.2 Geographic comparison

Chart on Geographic comparison
Data Table on Geographic comparison

12.3 Europe - Market size and forecast 2025-2030

Chart on Europe - Market size and forecast 2025-2030 ($ thousand)
Data Table on Europe - Market size and forecast 2025-2030 ($ thousand)
Chart on Europe - Year-over-year growth 2025-2030 (%)
Data Table on Europe - Year-over-year growth 2025-2030 (%)
Chart on Regional Comparison - Europe
Data Table on Regional Comparison - Europe

12.3.1 Germany - Market size and forecast 2025-2030

Chart on Germany - Market size and forecast 2025-2030 ($ thousand)
Data Table on Germany - Market size and forecast 2025-2030 ($ thousand)
Chart on Germany - Year-over-year growth 2025-2030 (%)
Data Table on Germany - Year-over-year growth 2025-2030 (%)

12.3.2 UK - Market size and forecast 2025-2030

Chart on UK - Market size and forecast 2025-2030 ($ thousand)
Data Table on UK - Market size and forecast 2025-2030 ($ thousand)
Chart on UK - Year-over-year growth 2025-2030 (%)
Data Table on UK - Year-over-year growth 2025-2030 (%)

12.3.3 France - Market size and forecast 2025-2030

Chart on France - Market size and forecast 2025-2030 ($ thousand)
Data Table on France - Market size and forecast 2025-2030 ($ thousand)
Chart on France - Year-over-year growth 2025-2030 (%)
Data Table on France - Year-over-year growth 2025-2030 (%)

12.3.4 Italy - Market size and forecast 2025-2030

Chart on Italy - Market size and forecast 2025-2030 ($ thousand)
Data Table on Italy - Market size and forecast 2025-2030 ($ thousand)
Chart on Italy - Year-over-year growth 2025-2030 (%)
Data Table on Italy - Year-over-year growth 2025-2030 (%)

12.3.5 Spain - Market size and forecast 2025-2030

Chart on Spain - Market size and forecast 2025-2030 ($ thousand)
Data Table on Spain - Market size and forecast 2025-2030 ($ thousand)
Chart on Spain - Year-over-year growth 2025-2030 (%)
Data Table on Spain - Year-over-year growth 2025-2030 (%)

12.3.6 The Netherlands - Market size and forecast 2025-2030

Chart on The Netherlands - Market size and forecast 2025-2030 ($ thousand)
Data Table on The Netherlands - Market size and forecast 2025-2030 ($ thousand)
Chart on The Netherlands - Year-over-year growth 2025-2030 (%)
Data Table on The Netherlands - Year-over-year growth 2025-2030 (%)

12.4 North America - Market size and forecast 2025-2030

Chart on North America - Market size and forecast 2025-2030 ($ thousand)
Data Table on North America - Market size and forecast 2025-2030 ($ thousand)
Chart on North America - Year-over-year growth 2025-2030 (%)
Data Table on North America - Year-over-year growth 2025-2030 (%)
Chart on Regional Comparison - North America
Data Table on Regional Comparison - North America

12.4.1 US - Market size and forecast 2025-2030

Chart on US - Market size and forecast 2025-2030 ($ thousand)
Data Table on US - Market size and forecast 2025-2030 ($ thousand)
Chart on US - Year-over-year growth 2025-2030 (%)
Data Table on US - Year-over-year growth 2025-2030 (%)

12.4.2 Canada - Market size and forecast 2025-2030

Chart on Canada - Market size and forecast 2025-2030 ($ thousand)
Data Table on Canada - Market size and forecast 2025-2030 ($ thousand)
Chart on Canada - Year-over-year growth 2025-2030 (%)
Data Table on Canada - Year-over-year growth 2025-2030 (%)

12.4.3 Mexico - Market size and forecast 2025-2030

Chart on Mexico - Market size and forecast 2025-2030 ($ thousand)
Data Table on Mexico - Market size and forecast 2025-2030 ($ thousand)
Chart on Mexico - Year-over-year growth 2025-2030 (%)
Data Table on Mexico - Year-over-year growth 2025-2030 (%)

12.5 APAC - Market size and forecast 2025-2030

Chart on APAC - Market size and forecast 2025-2030 ($ thousand)
Data Table on APAC - Market size and forecast 2025-2030 ($ thousand)
Chart on APAC - Year-over-year growth 2025-2030 (%)
Data Table on APAC - Year-over-year growth 2025-2030 (%)
Chart on Regional Comparison - APAC
Data Table on Regional Comparison - APAC

12.5.1 China - Market size and forecast 2025-2030

Chart on China - Market size and forecast 2025-2030 ($ thousand)
Data Table on China - Market size and forecast 2025-2030 ($ thousand)
Chart on China - Year-over-year growth 2025-2030 (%)
Data Table on China - Year-over-year growth 2025-2030 (%)

12.5.2 Japan - Market size and forecast 2025-2030

Chart on Japan - Market size and forecast 2025-2030 ($ thousand)
Data Table on Japan - Market size and forecast 2025-2030 ($ thousand)
Chart on Japan - Year-over-year growth 2025-2030 (%)
Data Table on Japan - Year-over-year growth 2025-2030 (%)

12.5.3 India - Market size and forecast 2025-2030

Chart on India - Market size and forecast 2025-2030 ($ thousand)
Data Table on India - Market size and forecast 2025-2030 ($ thousand)
Chart on India - Year-over-year growth 2025-2030 (%)
Data Table on India - Year-over-year growth 2025-2030 (%)

12.5.4 South Korea - Market size and forecast 2025-2030

Chart on South Korea - Market size and forecast 2025-2030 ($ thousand)
Data Table on South Korea - Market size and forecast 2025-2030 ($ thousand)
Chart on South Korea - Year-over-year growth 2025-2030 (%)
Data Table on South Korea - Year-over-year growth 2025-2030 (%)

12.5.5 Australia - Market size and forecast 2025-2030

Chart on Australia - Market size and forecast 2025-2030 ($ thousand)
Data Table on Australia - Market size and forecast 2025-2030 ($ thousand)
Chart on Australia - Year-over-year growth 2025-2030 (%)
Data Table on Australia - Year-over-year growth 2025-2030 (%)

12.5.6 Indonesia - Market size and forecast 2025-2030

Chart on Indonesia - Market size and forecast 2025-2030 ($ thousand)
Data Table on Indonesia - Market size and forecast 2025-2030 ($ thousand)
Chart on Indonesia - Year-over-year growth 2025-2030 (%)
Data Table on Indonesia - Year-over-year growth 2025-2030 (%)

12.6 South America - Market size and forecast 2025-2030

Chart on South America - Market size and forecast 2025-2030 ($ thousand)
Data Table on South America - Market size and forecast 2025-2030 ($ thousand)
Chart on South America - Year-over-year growth 2025-2030 (%)
Data Table on South America - Year-over-year growth 2025-2030 (%)
Chart on Regional Comparison - South America
Data Table on Regional Comparison - South America

12.6.1 Brazil - Market size and forecast 2025-2030

Chart on Brazil - Market size and forecast 2025-2030 ($ thousand)
Data Table on Brazil - Market size and forecast 2025-2030 ($ thousand)
Chart on Brazil - Year-over-year growth 2025-2030 (%)
Data Table on Brazil - Year-over-year growth 2025-2030 (%)

12.6.2 Argentina - Market size and forecast 2025-2030

Chart on Argentina - Market size and forecast 2025-2030 ($ thousand)
Data Table on Argentina - Market size and forecast 2025-2030 ($ thousand)
Chart on Argentina - Year-over-year growth 2025-2030 (%)
Data Table on Argentina - Year-over-year growth 2025-2030 (%)

12.6.3 Chile - Market size and forecast 2025-2030

Chart on Chile - Market size and forecast 2025-2030 ($ thousand)
Data Table on Chile - Market size and forecast 2025-2030 ($ thousand)
Chart on Chile - Year-over-year growth 2025-2030 (%)
Data Table on Chile - Year-over-year growth 2025-2030 (%)

12.7 Middle East and Africa - Market size and forecast 2025-2030

Chart on Middle East and Africa - Market size and forecast 2025-2030 ($ thousand)
Data Table on Middle East and Africa - Market size and forecast 2025-2030 ($ thousand)
Chart on Middle East and Africa - Year-over-year growth 2025-2030 (%)
Data Table on Middle East and Africa - Year-over-year growth 2025-2030 (%)
Chart on Regional Comparison - Middle East and Africa
Data Table on Regional Comparison - Middle East and Africa

12.7.1 Saudi Arabia - Market size and forecast 2025-2030

Chart on Saudi Arabia - Market size and forecast 2025-2030 ($ thousand)
Data Table on Saudi Arabia - Market size and forecast 2025-2030 ($ thousand)
Chart on Saudi Arabia - Year-over-year growth 2025-2030 (%)
Data Table on Saudi Arabia - Year-over-year growth 2025-2030 (%)

12.7.2 UAE - Market size and forecast 2025-2030

Chart on UAE - Market size and forecast 2025-2030 ($ thousand)
Data Table on UAE - Market size and forecast 2025-2030 ($ thousand)
Chart on UAE - Year-over-year growth 2025-2030 (%)
Data Table on UAE - Year-over-year growth 2025-2030 (%)

12.7.3 South Africa - Market size and forecast 2025-2030

Chart on South Africa - Market size and forecast 2025-2030 ($ thousand)
Data Table on South Africa - Market size and forecast 2025-2030 ($ thousand)
Chart on South Africa - Year-over-year growth 2025-2030 (%)
Data Table on South Africa - Year-over-year growth 2025-2030 (%)

12.7.4 Israel - Market size and forecast 2025-2030

Chart on Israel - Market size and forecast 2025-2030 ($ thousand)
Data Table on Israel - Market size and forecast 2025-2030 ($ thousand)
Chart on Israel - Year-over-year growth 2025-2030 (%)
Data Table on Israel - Year-over-year growth 2025-2030 (%)

12.7.5 Turkey - Market size and forecast 2025-2030

Chart on Turkey - Market size and forecast 2025-2030 ($ thousand)
Data Table on Turkey - Market size and forecast 2025-2030 ($ thousand)
Chart on Turkey - Year-over-year growth 2025-2030 (%)
Data Table on Turkey - Year-over-year growth 2025-2030 (%)

12.8 Market opportunity by geography

Market opportunity by geography ($ thousand)
Data Tables on Market opportunity by geography ($ thousand)

13. Drivers, Challenges, and Opportunity

13.1 Market drivers

Rising celiac disease and intolerance
Proliferation of legume ingredient innovation
Expansion of mainstream retail channels

13.2 Market challenges

High production and ingredient costs
Sensory and textural quality deficits
Supply chain segregation and certification

13.3 Impact of drivers and challenges

Impact of drivers and challenges in 2025 and 2030

13.4 Market opportunities

Adoption of organic certification standards
Integration of eco packaging
Proliferation of artisanal craft varieties

14. Competitive Landscape

14.1 Overview

14.2

Overview on criticality of inputs and factors of differentiation

14.3 Landscape disruption

Overview on factors of disruption

14.4 Industry risks

Impact of key risks on business

15. Competitive Analysis

15.1 Companies profiled

Companies covered

15.2 Company ranking index

15.3 Market positioning of companies

Matrix on companies position and classification

15.4 Andean Dream LLC

Andean Dream LLC - Overview
Andean Dream LLC - Product / Service
Andean Dream LLC - Key offerings
SWOT

15.5 Andriani S.p.A.

Andriani S.p.A. - Overview
Andriani S.p.A. - Product / Service
Andriani S.p.A. - Key offerings
SWOT

15.6 Banza LLC

Banza LLC - Overview
Banza LLC - Product / Service
Banza LLC - Key offerings
SWOT

15.7 Barilla G and R Fratelli SpA

Barilla G and R Fratelli SpA - Overview
Barilla G and R Fratelli SpA - Product / Service
Barilla G and R Fratelli SpA - Key offerings
SWOT

15.8 Casalare Pty Ltd

Casalare Pty Ltd - Overview
Casalare Pty Ltd - Product / Service
Casalare Pty Ltd - Key offerings
SWOT

15.9 Chickapea

Chickapea - Overview
Chickapea - Product / Service
Chickapea - Key offerings
SWOT

15.10 Dr. Schar

Dr. Schar - Overview
Dr. Schar - Product / Service
Dr. Schar - Key offerings
SWOT

15.11 Govifarm S.r.l.

Govifarm S.r.l. - Overview
Govifarm S.r.l. - Product / Service
Govifarm S.r.l. - Key offerings
SWOT

15.12 La Fabbrica della Pasta di

La Fabbrica della Pasta di - Overview
La Fabbrica della Pasta di - Product / Service
La Fabbrica della Pasta di - Key offerings
SWOT

15.13 Pasta Pangea S.r.l.

Pasta Pangea S.r.l. - Overview
Pasta Pangea S.r.l. - Product / Service
Pasta Pangea S.r.l. - Key offerings
SWOT

15.14 Pastificio La Rosa S.r.l.

Pastificio La Rosa S.r.l. - Overview
Pastificio La Rosa S.r.l. - Product / Service
Pastificio La Rosa S.r.l. - Key offerings
SWOT

15.15 Pastificio Lucio Garofalo S.p.A

Pastificio Lucio Garofalo S.p.A - Overview
Pastificio Lucio Garofalo S.p.A - Product / Service
Pastificio Lucio Garofalo S.p.A - Key offerings
SWOT

15.16 Rummo S.p.A

Rummo S.p.A - Overview
Rummo S.p.A - Product / Service
Rummo S.p.A - Key offerings
SWOT

15.17 Sam Mills S.R.L.

Sam Mills S.R.L. - Overview
Sam Mills S.R.L. - Product / Service
Sam Mills S.R.L. - Key offerings
SWOT

15.18 Tribe 9 Foods LLC

Tribe 9 Foods LLC - Overview
Tribe 9 Foods LLC - Product / Service
Tribe 9 Foods LLC - Key offerings
SWOT

16. Appendix

16.1 Scope of the report

Market definition
Objectives
Notes and caveats

16.2 Inclusions and exclusions checklist

Inclusions checklist
Exclusions checklist

16.3 Currency conversion rates for US$

16.4 Research methodology

16.5 Data procurement

Information sources

16.6 Data validation

16.7 Validation techniques employed for market sizing

16.8 Data synthesis

16.9 360 degree market analysis

16.10 List of abbreviations

Research Methodology

Technavio presents a detailed picture of the market by way of study, synthesis, and summation of data from multiple sources. The analysts have presented the various facets of the market with a particular focus on identifying the key industry influencers. The data thus presented is comprehensive, reliable, and the result of extensive research, both primary and secondary.

INFORMATION SOURCES

Primary sources

  • Manufacturers and suppliers
  • Channel partners
  • Industry experts
  • Strategic decision makers

Secondary sources

  • Industry journals and periodicals
  • Government data
  • Financial reports of key industry players
  • Historical data
  • Press releases

DATA ANALYSIS

Data Synthesis

  • Collation of data
  • Estimation of key figures
  • Analysis of derived insights

Data Validation

  • Triangulation with data models
  • Reference against proprietary databases
  • Corroboration with industry experts

REPORT WRITING

Qualitative

  • Market drivers
  • Market challenges
  • Market trends
  • Five forces analysis

Quantitative

  • Market size and forecast
  • Market segmentation
  • Geographical insights
  • Competitive landscape

Interested in this report?

Get your sample now to see our research methodology and insights!

Download Now

Frequently Asked Questions

Gluten-Free Pasta market growth will increase by USD 297035.5 thousand thousand during 2026-2030.

The Gluten-Free Pasta market is expected to grow at a CAGR of 4.7% during 2026-2030.

Gluten-Free Pasta market is segmented by Distribution channel (Offline, Online) Product type (Dried, Instant, Canned and frozen) Source (Rice, Corn, Millet, Others)

Andean Dream LLC, Andriani S.p.A., Avellini Sp. z o.o., Banza LLC, Barilla G and R Fratelli SpA, Casalare Pty Ltd, Chickapea, Contes Pasta Co., Dr. Schar, Govifarm S.r.l., La Fabbrica della Pasta di, Pasta Pangea S.r.l., Pastificio La Rosa S.r.l., Pastificio Lucio Garofalo S.p.A, PT Ladang Lima Indonesia, Rummo S.p.A, Sam Mills S.R.L., Seitz glutenfrei GmbH, Tinkyada, Tribe 9 Foods LLC are a few of the key vendors in the Gluten-Free Pasta market.

Europe will register the highest growth rate of 40.8% among the other regions. Therefore, the Gluten-Free Pasta market in Europe is expected to garner significant business opportunities for the vendors during the forecast period.

Germany, UK, France, Italy, Spain, The Netherlands, US, Canada, Mexico, China, Japan, India, South Korea, Australia, Indonesia, Brazil, Argentina, Chile, Saudi Arabia, UAE, South Africa, Israel, Turkey

  • Rising celiac disease and intolerance is the driving factor this market.

The Gluten-Free Pasta market vendors should focus on grabbing business opportunities from the Distribution channel segment as it accounted for the largest market share in the base year.
RIA - Research AI Assistant
Ask RIA
