
Governance Risk And Compliance (GRC) Platform Market Size 2026-2030
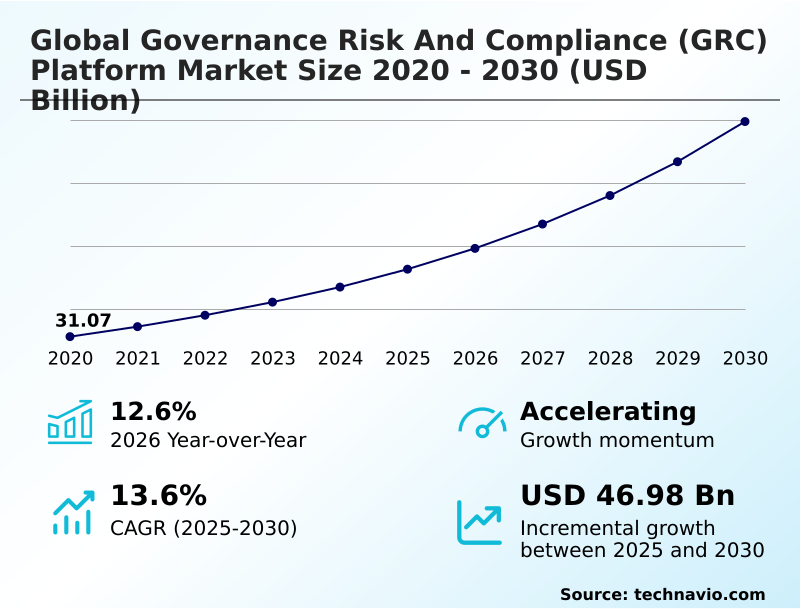
The governance risk and compliance (grc) platform market size is valued to increase by USD 46.98 billion, at a CAGR of 13.6% from 2025 to 2030. Increased need to comply with regulatory requirements will drive the governance risk and compliance (grc) platform market.
Major Market Trends & Insights
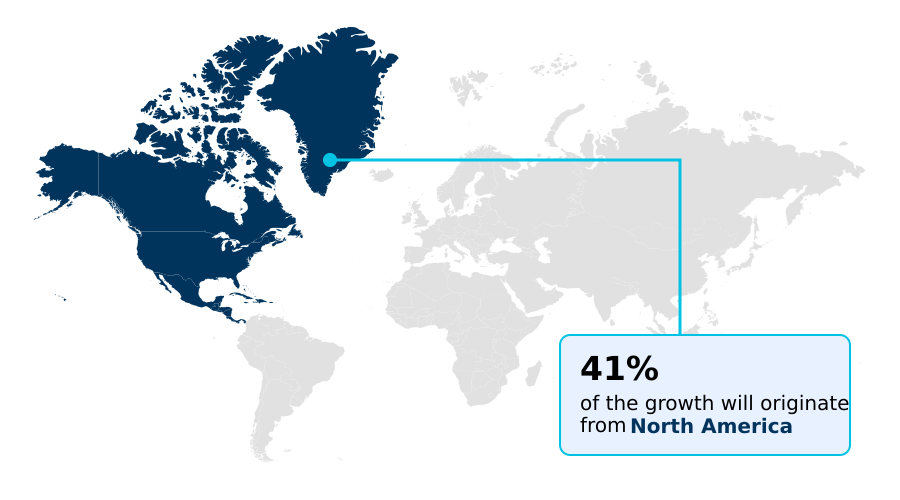
- North America dominated the market and accounted for a 40.8% growth during the forecast period.
- By Deployment - On-premises segment was valued at USD 23.75 billion in 2024
- By Component - Software segment accounted for the largest market revenue share in 2024
Market Size & Forecast
- Market Opportunities: USD 68.44 billion
- Market Future Opportunities: USD 46.98 billion
- CAGR from 2025 to 2030 : 13.6%
Market Summary
- The Governance Risk and Compliance (GRC) Platform market is expanding as organizations navigate an increasingly complex regulatory environment. Enterprises are adopting integrated risk management frameworks to unify disparate functions, moving away from siloed approaches. The core of this shift is compliance automation, which streamlines adherence to standards like sarbanes-oxley (sox) compliance and GDPR.
- Modern GRC solutions incorporate predictive risk analytics and regulatory intelligence to offer proactive insights, enabling real-time risk monitoring. A key business application is in supply chain management, where vendor risk management and third-party risk assessment are automated to ensure partners meet stringent cybersecurity governance and data privacy frameworks.
- This approach, supported by audit management software and business continuity management tools, not only ensures compliance but also enhances operational resilience. The integration of it risk management and operational risk modeling allows businesses to manage a holistic risk profile, turning compliance from a cost center into a strategic advantage.
- Effective policy management solutions and incident response planning further solidify the enterprise's defensive posture, creating a more agile and secure operational environment for sustained success.
What will be the Size of the Governance Risk And Compliance (GRC) Platform Market during the forecast period?
Get Key Insights on Market Forecast (PDF) Get Free Sample
How is the Governance Risk And Compliance (GRC) Platform Market Segmented?
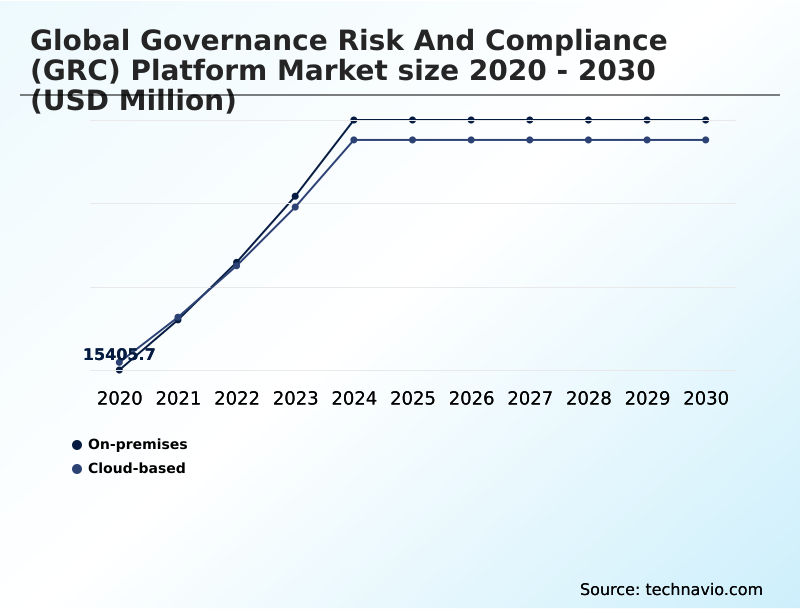
The governance risk and compliance (grc) platform industry research report provides comprehensive data (region-wise segment analysis), with forecasts and estimates in "USD million" for the period 2026-2030, as well as historical data from 2020-2024 for the following segments.
- Deployment
- On-premises
- Cloud-based
- Component
- Software
- Services
- End-user
- Large enterprises
- SMEs
- Geography
- North America
- US
- Canada
- Mexico
- Europe
- Germany
- UK
- France
- APAC
- China
- Japan
- India
- South America
- Brazil
- Argentina
- Middle East and Africa
- UAE
- Saudi Arabia
- South Africa
- Rest of World (ROW)
- North America
By Deployment Insights
The on-premises segment is estimated to witness significant growth during the forecast period.
The on-premises segment of the governance risk and compliance (GRC) platform market remains critical for enterprises in highly regulated sectors requiring absolute control over their data.
This deployment model, where the audit management software and policy management solutions are installed on an organization's servers, offers unparalleled security and customization.
It allows for deep integration with legacy systems and tailored automated control testing to meet specific financial reporting compliance needs like sarbanes-oxley (sox) compliance. Organizations gain complete ownership over data privacy frameworks, a key factor for entities handling sensitive information.
While cloud adoption grows, the need for data localization and granular system configuration sustains this segment. Firms using on-premises incident response planning tools report up to a 20% faster alignment with internal security protocols.
This control is vital for business continuity management and robust cybersecurity governance.
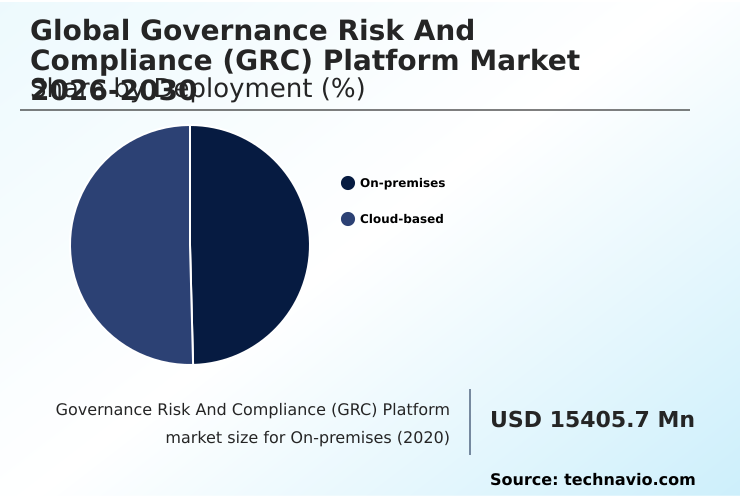
The On-premises segment was valued at USD 23.75 billion in 2024 and showed a gradual increase during the forecast period.
Regional Analysis
North America is estimated to contribute 40.8% to the growth of the global market during the forecast period.Technavio’s analysts have elaborately explained the regional trends and drivers that shape the market during the forecast period.
See How Governance Risk And Compliance (GRC) Platform Market Demand is Rising in North America Get Free Sample
The geographic landscape of the governance risk and compliance (GRC) platform market is characterized by varying adoption rates driven by regional regulatory pressures. North America leads due to stringent financial reporting compliance standards and a mature cybersecurity governance framework.
In Europe, the focus on data privacy frameworks like GDPR fuels demand for robust GRC solutions for data privacy and compliance obligation tracking. Organizations in this region report a 40% higher investment in regulatory change management compared to other regions.
APAC is emerging as a high-growth area, with a focus on IT governance frameworks and operational risk management in banking. Enterprises in APAC utilizing automated compliance for financial services have noted a 15% improvement in audit efficiency.
The Middle East shows increasing adoption in energy and finance, prioritizing supply chain risk monitoring and anti-money laundering (AML) solutions to align with international standards.
Market Dynamics
Our researchers analyzed the data with 2025 as the base year, along with the key drivers, trends, and challenges. A holistic analysis of drivers will help companies refine their marketing strategies to gain a competitive advantage.
- Organizations are increasingly focused on implementing a unified grc framework to manage a complex web of risks and regulations. A central part of this strategy involves automating compliance for financial services, where precision and efficiency are paramount. The necessity of a GRC platform for cybersecurity risk has become non-negotiable as digital threats evolve.
- This extends to the supply chain, where managing third-party supplier risk is a critical component of operational resilience. Concurrently, esg compliance and reporting solutions are gaining prominence, driven by investor and regulatory demands for transparency. Many are discovering the benefits of cloud-based grc platforms, which offer scalability and lower upfront costs.
- The process often begins with internal audit management software selection, a foundational step toward broader GRC maturity. For many, the journey involves adopting specific grc solutions for data privacy to address regulations like GDPR. Sarbanes-oxley act compliance automation remains a key use case, particularly in the US.
- In the financial sector, operational risk management in banking is being transformed by these platforms. Successful implementations often hinge on GRC platform integration with erp systems, which provides a holistic view of enterprise data. Understanding the key features of erm software and mastering incident management process automation are crucial for effective risk mitigation.
- Organizations that proactively engage in developing a business continuity plan integrated with their GRC system demonstrate significantly higher resilience, recovering operations twice as fast as peers after a disruption. Learning how to measure grc effectiveness and following vendor risk assessment best practices are vital for long-term success.
- IT compliance frameworks for healthcare highlight industry-specific needs, while the role of AI in governance risk and compliance promises a future of predictive insights. Even GRC software for small businesses is becoming more accessible, democratizing enterprise-level risk management. However, the challenges of grc platform implementation must be carefully managed to realize the full potential of these powerful tools.
What are the key market drivers leading to the rise in the adoption of Governance Risk And Compliance (GRC) Platform Industry?
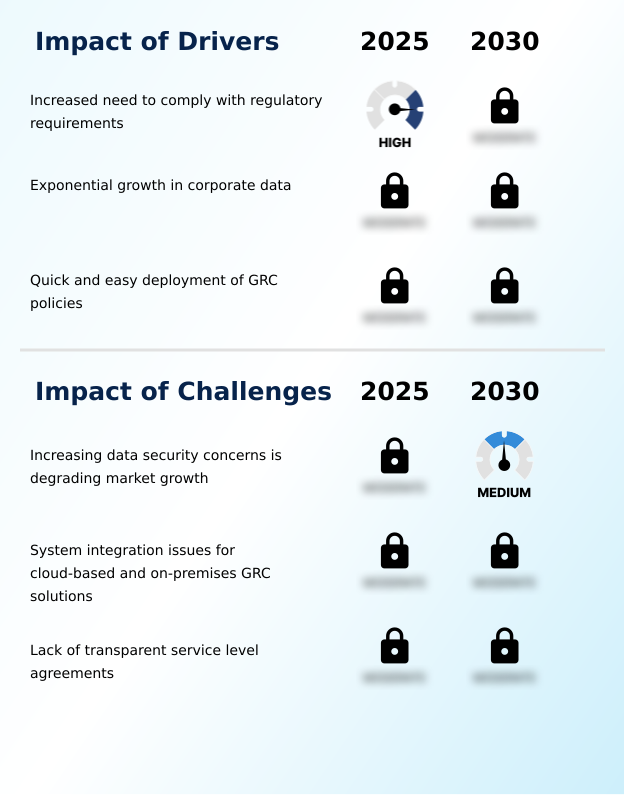
- A key driver of the market is the increased need for organizations to comply with regulatory requirements.
- The market is primarily driven by the increased need to comply with regulatory requirements globally. Organizations leveraging compliance obligation tracking and regulatory reporting automation achieve over 98% on-time filing rates.
- Another major driver is the exponential growth in corporate data, which necessitates sophisticated data governance policy enforcement and IT governance frameworks to manage risk.
- Firms that implement centralized data privacy frameworks through a GRC platform reduce data breach risks by up to 50%. Additionally, the demand for quick and easy deployment of GRC policies is accelerating the adoption of cloud-based solutions.
- These platforms can shorten implementation cycles by 60% compared to traditional on-premises systems, providing rapid value and agility.
What are the market trends shaping the Governance Risk And Compliance (GRC) Platform Industry?
- A key market trend is the increasing integration of governance, risk, and compliance platforms with third-platform technologies. This includes cloud computing, big data analytics, and artificial intelligence.
- A key trend shaping the governance risk and compliance (GRC) platform market is the integration of GRC platform with third-platform technologies, such as artificial intelligence and advanced analytics. This shift enables a move from reactive reporting to predictive risk analytics. Organizations leveraging AI-driven risk insights have reported a 25% improvement in the early detection of potential compliance breaches.
- The rise of cloud-based e-discovery solution market and cloud security compliance is another significant trend, with firms reporting up to a 40% reduction in infrastructure costs. Furthermore, the emergence of social media governance is compelling businesses to adopt new tools for monitoring and risk mitigation, with automated systems identifying reputational threats with 95% accuracy.
- Low-code GRC platforms are also gaining traction, empowering business users to create and manage workflows.
What challenges does the Governance Risk And Compliance (GRC) Platform Industry face during its growth?
- Increasing data security concerns is a key challenge affecting market growth.
- A primary challenge is the increasing data security concerns is degrading market growth, as platforms become centralized repositories of sensitive information. A single breach can be costly, with recovery expenses often exceeding initial software investments by 200%. System integration issues for cloud-based and on-premises GRC solutions also pose a significant hurdle.
- Organizations report that integration complexities can extend project timelines by an average of 45%, delaying ROI. Finally, the lack of transparent service level agreements creates uncertainty. Without clear metrics on uptime and support, businesses face unquantified operational risks.
- Ambiguous SLAs are cited as a key factor in 30% of post-implementation disputes with vendors, hindering trust and long-term partnerships in the market.
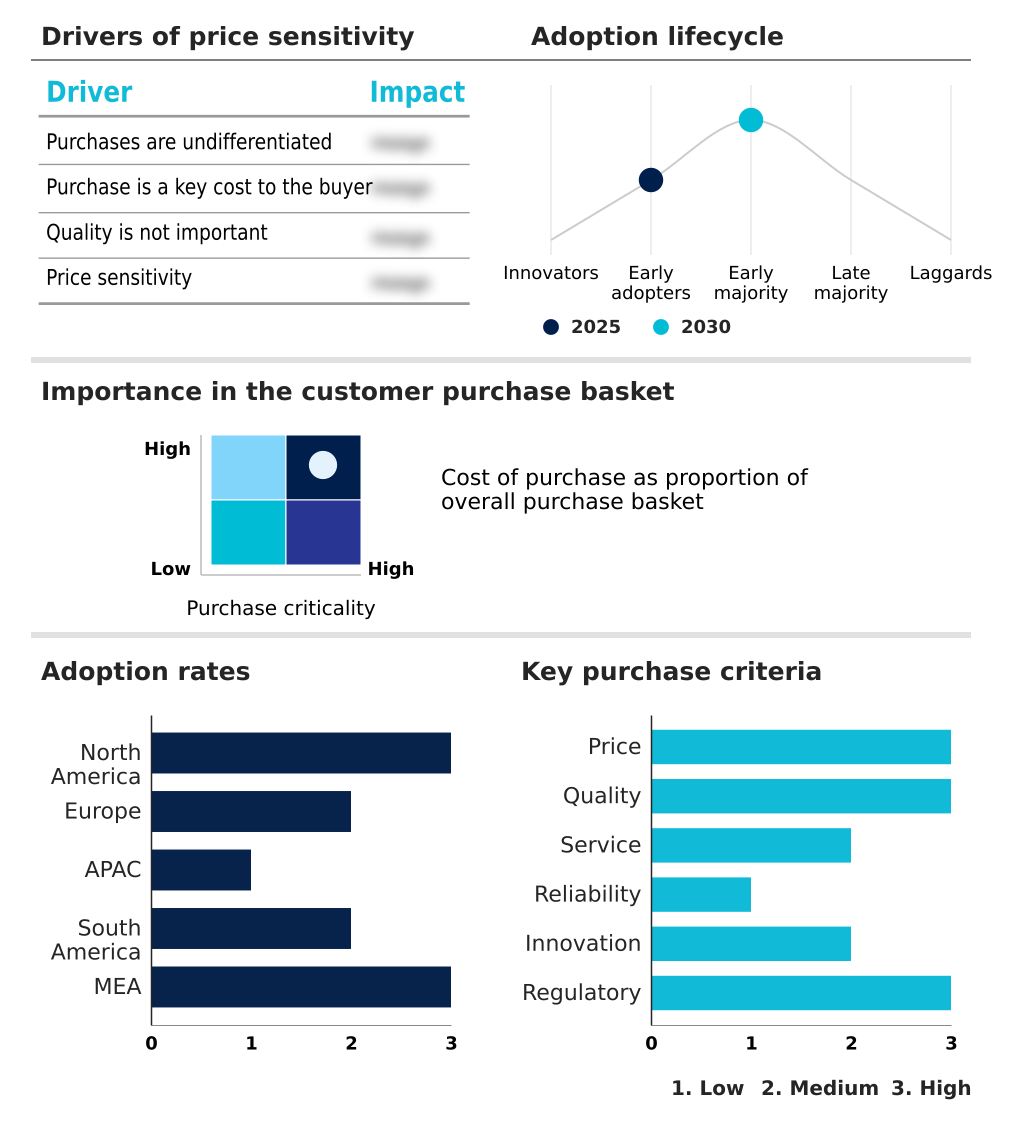
Exclusive Technavio Analysis on Customer Landscape
The governance risk and compliance (grc) platform market forecasting report includes the adoption lifecycle of the market, covering from the innovator’s stage to the laggard’s stage. It focuses on adoption rates in different regions based on penetration. Furthermore, the governance risk and compliance (grc) platform market report also includes key purchase criteria and drivers of price sensitivity to help companies evaluate and develop their market growth analysis strategies.
Customer Landscape of Governance Risk And Compliance (GRC) Platform Industry
Competitive Landscape
Companies are implementing various strategies, such as strategic alliances, governance risk and compliance (grc) platform market forecast, partnerships, mergers and acquisitions, geographical expansion, and product/service launches, to enhance their presence in the industry.
Diligent Corp. - The company provides a unified governance, risk, and compliance (GRC) platform designed to centralize oversight and automate complex regulatory workflows for enterprise-wide risk management.
The industry research and growth report includes detailed analyses of the competitive landscape of the market and information about key companies, including:
- Diligent Corp.
- Drata Inc.
- IBM Corp.
- Ideagen
- LogicGate Inc.
- LogicManager Inc.
- MetricStream Inc.
- Microsoft Corp.
- NAVEX Global Inc.
- OneTrust LLC
- Oracle Corp.
- ProcessUnity Inc.
- Resolver Inc.
- Riskonnect Inc.
- SAI360 Inc.
- SAP SE
- ServiceNow Inc.
- SoftwareOne AG
- Wolters Kluwer NV
- Workiva Inc.
Qualitative and quantitative analysis of companies has been conducted to help clients understand the wider business environment as well as the strengths and weaknesses of key industry players. Data is qualitatively analyzed to categorize companies as pure play, category-focused, industry-focused, and diversified; it is quantitatively analyzed to categorize companies as dominant, leading, strong, tentative, and weak.
Recent Development and News in Governance risk and compliance (grc) platform market
- In April 2025, Deloitte reported that several multinational firms significantly increased their spending on GRC technologies following tighter enforcement of data privacy regulations across Europe and Asia.
- In October 2025, ServiceNow expanded its integrated GRC suite, enabling enterprise clients to deploy compliance workflows for new cybersecurity regulations in significantly reduced timelines.
- In March 2025, Oracle reported a security vulnerability in one of its cloud compliance management modules, prompting several enterprise clients to temporarily suspend deployments and reassess their risk.
- In September 2025, Microsoft faced integration challenges reported by several enterprise clients during the expansion of its cloud-based compliance suite with existing on-premises ERP systems.
Dive into Technavio’s robust research methodology, blending expert interviews, extensive data synthesis, and validated models for unparalleled Governance Risk And Compliance (GRC) Platform Market insights. See full methodology.
| Market Scope | |
|---|---|
| Page number | 293 |
| Base year | 2025 |
| Historic period | 2020-2024 |
| Forecast period | 2026-2030 |
| Growth momentum & CAGR | Accelerate at a CAGR of 13.6% |
| Market growth 2026-2030 | USD 46975.1 million |
| Market structure | Fragmented |
| YoY growth 2025-2026(%) | 12.6% |
| Key countries | US, Canada, Mexico, Germany, UK, France, Italy, Spain, The Netherlands, China, Japan, India, Australia, South Korea, Singapore, Brazil, Argentina, Chile, UAE, Saudi Arabia, South Africa, Israel and Turkey |
| Competitive landscape | Leading Companies, Market Positioning of Companies, Competitive Strategies, and Industry Risks |
Research Analyst Overview
- The governance risk and compliance (GRC) platform market is evolving from a siloed toolset into a strategic enabler for enterprise resilience. Boardroom discussions now center on integrated risk management as a core business function, not just an IT or legal requirement.
- The adoption of comprehensive platforms combining enterprise risk management (ERM) with operational risk modeling allows for a holistic view of organizational threats. Compliance automation is fundamental, with policy management solutions and automated control testing becoming standard. These systems provide real-time risk monitoring and predictive risk analytics, essential for dynamic industries.
- For instance, firms using regulatory intelligence feeds integrated with regulatory change management workflows adapt to new rules 40% faster than those relying on manual processes. Key components include audit management software, vendor risk management for third-party risk assessment, and robust incident response planning tied to business continuity management.
- Cybersecurity governance and IT risk management are deeply embedded, supported by data privacy frameworks. Solutions addressing financial reporting compliance, such as Sarbanes-Oxley (SOX) compliance and HIPAA compliance tools, are crucial.
- The market also sees growth in specialized areas like ESG reporting software, anti-money laundering (AML) solutions, and managing new challenges through social media governance and e-discovery solutions, often enhanced by third-platform technologies integration and cloud security compliance.
- This integration solidifies the link between operational activities and strategic objectives, with a centralized policy repository, automated workflow engine, compliance reporting tools, and risk and control self-assessment providing the necessary infrastructure. Tracking key risk indicators (KRIs) and performing supply chain risk monitoring are now integral to proactive management.
What are the Key Data Covered in this Governance Risk And Compliance (GRC) Platform Market Research and Growth Report?
-
What is the expected growth of the Governance Risk And Compliance (GRC) Platform Market between 2026 and 2030?
-
USD 46.98 billion, at a CAGR of 13.6%
-
-
What segmentation does the market report cover?
-
The report is segmented by Deployment (On-premises, and Cloud-based), Component (Software, and Services), End-user (Large enterprises, and SMEs) and Geography (North America, Europe, APAC, South America, Middle East and Africa)
-
-
Which regions are analyzed in the report?
-
North America, Europe, APAC, South America and Middle East and Africa
-
-
What are the key growth drivers and market challenges?
-
Increased need to comply with regulatory requirements, Increasing data security concerns is degrading market growth
-
-
Who are the major players in the Governance Risk And Compliance (GRC) Platform Market?
-
Diligent Corp., Drata Inc., IBM Corp., Ideagen, LogicGate Inc., LogicManager Inc., MetricStream Inc., Microsoft Corp., NAVEX Global Inc., OneTrust LLC, Oracle Corp., ProcessUnity Inc., Resolver Inc., Riskonnect Inc., SAI360 Inc., SAP SE, ServiceNow Inc., SoftwareOne AG, Wolters Kluwer NV and Workiva Inc.
-
Market Research Insights
- The market is shaped by a move toward a unified compliance framework, with organizations seeking to consolidate oversight. Adoption of platforms offering automated evidence collection and continuous controls monitoring has led to a 30% reduction in audit preparation times. Firms implementing a formal risk appetite framework align strategic decisions with tolerance levels more effectively than those without.
- The use of regulatory reporting automation has been shown to improve submission accuracy by over 25%. Centralizing oversight through corporate governance software and IT governance frameworks enhances visibility, while issue and remediation management tools shorten resolution cycles.
- Furthermore, organizations utilizing regulatory horizon scanning are better prepared for upcoming legal changes, demonstrating a higher level of proactive risk management and strategic foresight. This shift reflects a broader trend towards data-driven governance.
We can help! Our analysts can customize this governance risk and compliance (grc) platform market research report to meet your requirements.
 RIA -
RIA - 
