
Enterprise Application Software Market Size 2025-2029
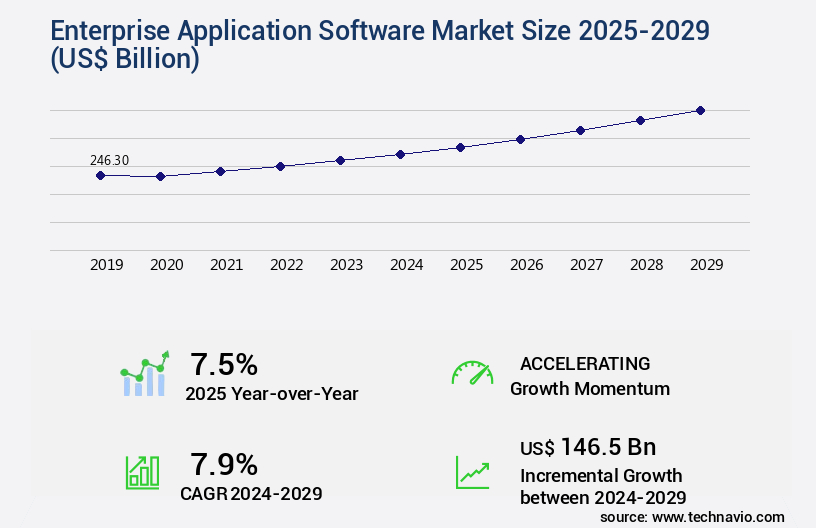
The enterprise application software market size is valued to increase USD 146.5 billion, at a CAGR of 7.9% from 2024 to 2029. Introduction of cloud-based deployment solutions will drive the enterprise application software market.
Major Market Trends & Insights
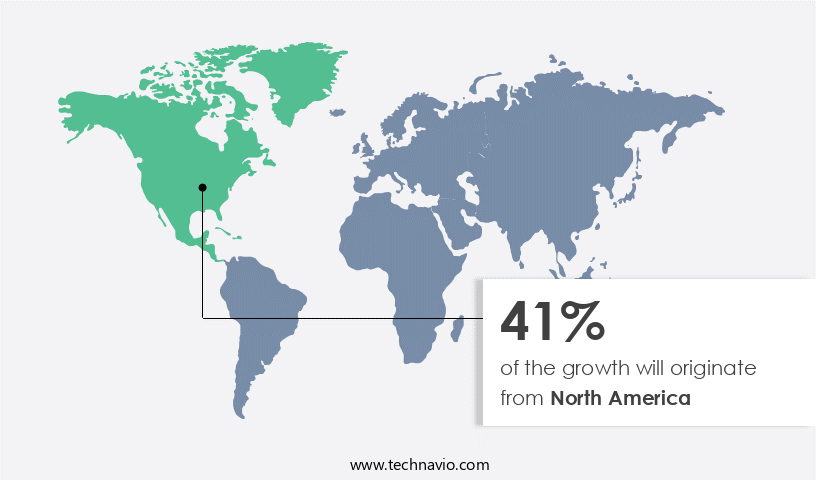
- North America dominated the market and accounted for a 41% growth during the forecast period.
- By Deployment - On-premises segment was valued at USD 126.80 billion in 2023
- By Solution - Enterprise resource planning segment accounted for the largest market revenue share in 2023
Market Size & Forecast
- Market Opportunities: USD 87.37 billion
- Market Future Opportunities: USD 146.50 billion
- CAGR from 2024 to 2029 : 7.9%
Market Summary
- Enterprise Application Software (EAS) market growth is fueled by the increasing adoption of cloud-deployed solutions, enabling businesses to streamline operations and enhance flexibility. Advanced technologies, such as artificial intelligence (AI) and machine learning (ML), are integrated into EAS, providing predictive analytics and automation capabilities. However, this market faces challenges from open-source software providers, offering cost-effective alternatives to proprietary solutions. According to recent reports, the global EAS market is valued at over USD200 billion, demonstrating its significant impact on businesses worldwide. This growth is driven by the need for digital transformation, as companies seek to optimize processes and improve customer experiences.
- EAS solutions enable organizations to manage core business functions, including finance, human resources, and supply chain management, more efficiently. Cloud-based deployment models have gained popularity due to their ease of implementation and scalability. This shift from on-premises solutions has led to increased competition and innovation within the market. However, the integration of advanced technologies and the emergence of open-source alternatives necessitate a strategic approach to EAS adoption. Businesses must consider factors such as security, customizability, and total cost of ownership when evaluating EAS solutions. As the market continues to evolve, it is essential for organizations to stay informed about the latest trends and developments to make informed decisions.
What will be the Size of the Enterprise Application Software Market during the forecast period?
Get Key Insights on Market Forecast (PDF) Request Free Sample
How is the Enterprise Application Software Market Segmented ?
The enterprise application software industry research report provides comprehensive data (region-wise segment analysis), with forecasts and estimates in "USD billion" for the period 2025-2029, as well as historical data from 2019-2023 for the following segments.
- Deployment
- On-premises
- Cloud-based
- Solution
- Enterprise resource planning
- Analytics and business intelligence
- Customer relationship management
- Supply chain management
- Others
- End-user
- BFSI
- IT and telecommunication
- Retail and e-commerce
- Government and public sector
- Others
- Geography
- North America
- US
- Canada
- Mexico
- Europe
- France
- Germany
- Italy
- UK
- APAC
- China
- India
- Japan
- Rest of World (ROW)
- North America
By Deployment Insights
The on-premises segment is estimated to witness significant growth during the forecast period.
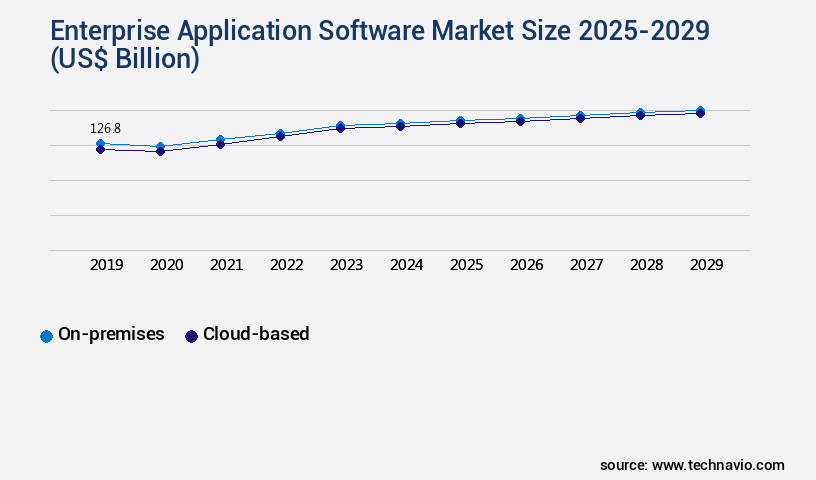
The market continues to evolve, with cloud-based applications and microservices architecture gaining significant traction. According to recent studies, cloud-based enterprise software is projected to grow at a compound annual growth rate (CAGR) of 12.5% between 2021 and 2026. In contrast, the on-premises model will experience slower growth during the forecast period, with a CAGR of only 1.5%. This shift towards cloud solutions is driven by the benefits they offer, such as scalability, flexibility, and cost savings. However, the on-premises model remains a viable option for large organizations that prioritize security and functionality. These organizations deal with critical data and are increasingly relying on this model due to its end-to-end quality control and lack of third-party interference.
Agile development methodology, artificial intelligence applications, and machine learning algorithms are integral components of modern enterprise software, enabling process optimization, predictive analytics, and real-time data processing. Containerization technologies, such as Docker, and serverless computing are also transforming the landscape. These technologies facilitate the development, deployment, and scaling of applications more efficiently. Cybersecurity measures, including application security, data encryption, and compliance regulations, are essential considerations in the market. User experience design, customer relationship management, knowledge management systems, and data visualization dashboards are other key areas of focus. Business intelligence platforms, software development lifecycle, and software licensing models are essential elements of enterprise software, with devops practices and project portfolio management streamlining the development process.
API integration, technical support services, and software maintenance services ensure the smooth operation of these applications. In conclusion, the market is characterized by continuous innovation and evolution. With a growing emphasis on cloud-based solutions, agile development, and advanced technologies like AI and machine learning, organizations can optimize their processes, improve user experiences, and gain valuable insights from their data.
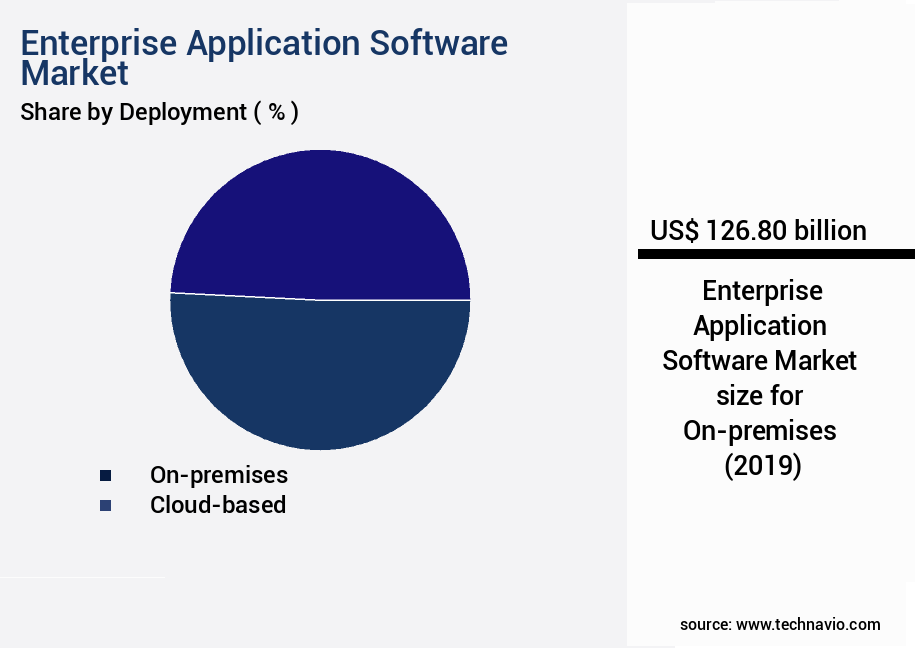
The On-premises segment was valued at USD 126.80 billion in 2019 and showed a gradual increase during the forecast period.
Regional Analysis
North America is estimated to contribute 41% to the growth of the global market during the forecast period.Technavio’s analysts have elaborately explained the regional trends and drivers that shape the market during the forecast period.
See How Enterprise Application Software Market Demand is Rising in North America Request Free Sample
The market in North America, with significant contributions from the US and Canada, exhibits a moderate growth trajectory due to market maturity. Early adoption of enterprise applications by local enterprises sets the region apart. Looking ahead, investments in advanced technologies such as blockchain, artificial intelligence (AI), Internet of things (IoT), and data analytics will fuel future growth. Companies offering in-built application programming interfaces (APIs) for these technologies stand to benefit from additional revenues through product upgrades and maintenance fees.
The integration of these advanced technologies with existing enterprise application software platforms is a key trend shaping the market's evolution.
Market Dynamics
Our researchers analyzed the data with 2024 as the base year, along with the key drivers, trends, and challenges. A holistic analysis of drivers will help companies refine their marketing strategies to gain a competitive advantage.
The market is experiencing significant growth as businesses seek to optimize their operations and gain a competitive edge. One key area of focus is ensuring the top-notch performance of software applications through the use of [software application performance monitoring tools]. These tools help identify and address issues in real-time, ensuring uninterrupted services and improved user experience. Another critical aspect is data security, with [enterprise-grade data encryption methods] and [secure cloud-based software deployment strategies] becoming essential for businesses. Agile development methodology implementation is also on the rise, enabling faster time-to-market and greater flexibility in responding to changing business needs. Advanced technologies such as [ai-powered predictive analytics applications] and [scalable microservices architecture design] are transforming the enterprise application landscape. Predictive analytics helps businesses anticipate trends and make informed decisions, while microservices enable the development and deployment of applications as independent services. The integration of [CRM and ERP systems] is another trend gaining traction, allowing businesses to streamline their processes and gain a more comprehensive view of their operations. Effective [knowledge management system implementation] is also crucial for businesses to ensure that valuable information is easily accessible to employees, enhancing productivity and decision-making capabilities. Data visualization for [business intelligence dashboards] is essential for gaining insights from the vast amounts of data generated by enterprise applications. Workflow automation using [AI and machine learning] further enhances efficiency by automating repetitive tasks and enabling more accurate and timely decision-making. Overall, the market is witnessing significant innovation and growth, driven by the need for better performance, security, and productivity.
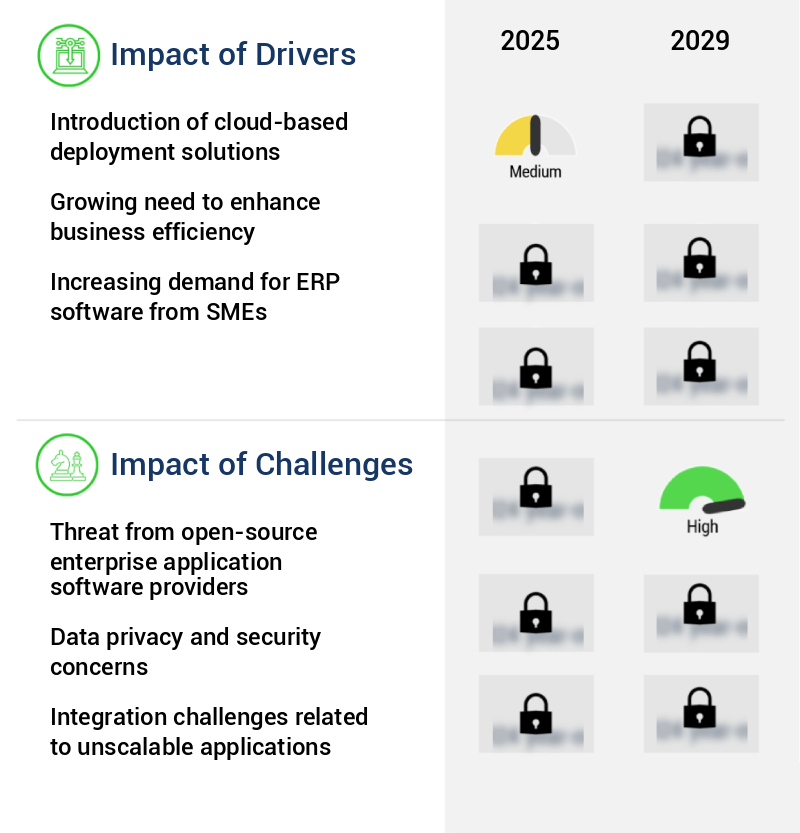
What are the key market drivers leading to the rise in the adoption of Enterprise Application Software Industry?
- The introduction of cloud-based deployment solutions serves as the primary catalyst for market growth. These solutions offer numerous advantages, including increased flexibility, efficiency, and scalability, making them an indispensable choice for businesses seeking to streamline their operations and remain competitive in today's dynamic business landscape.
- Cloud-based enterprise application software has witnessed a surging demand in the business world due to its ability to deliver agility and scalable IT infrastructure. These solutions, which are applications or software available remotely and hosted on a company server for customers, can be accessed via public, private, or hybrid clouds. The flexibility of cloud-based services helps businesses overcome the intricacies of hardware, license management, and software. Oracle Corp. Is among the numerous companies responding to this trend by providing cloud-based offerings, such as the Oracle Banking Virtual Account Management Cloud Service.
- This service enables banks to swiftly deploy a comprehensive range of banking services, allowing their corporate clients to effortlessly manage their cash positions and working capital around the clock. The adoption of cloud-based enterprise application software signifies a shift towards more efficient and adaptable IT solutions, catering to various sectors and industries.
What are the market trends shaping the Enterprise Application Software Industry?
- Advanced technologies are experiencing increasing adoption, representing the emerging market trend.
- In the dynamic business landscape of 2024, enterprise application software (EAS) is evolving with the adoption of advanced technologies, such as hybrid cloud solutions. Hybrid cloud-based EAS facilitates seamless application movement between public and private cloud environments. This setup includes an on-premises application acting as a replication engine to the cloud, offering potential recovery points for backup. Organizations opt for hybrid cloud solutions when they need to balance application efficiency, security, backup, privacy, and cost reduction. The hybrid cloud model combines the advantages of both public and private cloud deployments.
- For instance, it ensures application flexibility and cost savings of public clouds while maintaining control and security of private clouds. This trend underscores the growing importance of EAS in various sectors, with the global market projected to reach approximately 420 billion U.S. Dollars by 2026, representing a significant increase from its current size.
What challenges does the Enterprise Application Software Industry face during its growth?
- The growth of the industry is significantly impacted by the formidable challenge posed by providers of open-source enterprise application software.
- The market is characterized by a growing number of open-source providers, presenting both challenges and opportunities for businesses. Free, open-source alternatives exist for applications like CRM, ERP, and SCM, such as Bitrix24 and HubSpot CRM. These solutions enable enterprises to utilize essential functionalities without incurring costs. The market encompasses a multitude of open-source companies offering a wide array of enterprise application software tools and applications.
- By combining offerings from various providers, businesses can cover almost all the functionalities offered by traditional on-premises or cloud-based enterprise application software. This trend underscores the evolving nature of the enterprise application software landscape.
Exclusive Technavio Analysis on Customer Landscape
The enterprise application software market forecasting report includes the adoption lifecycle of the market, covering from the innovator’s stage to the laggard’s stage. It focuses on adoption rates in different regions based on penetration. Furthermore, the enterprise application software market report also includes key purchase criteria and drivers of price sensitivity to help companies evaluate and develop their market growth analysis strategies.
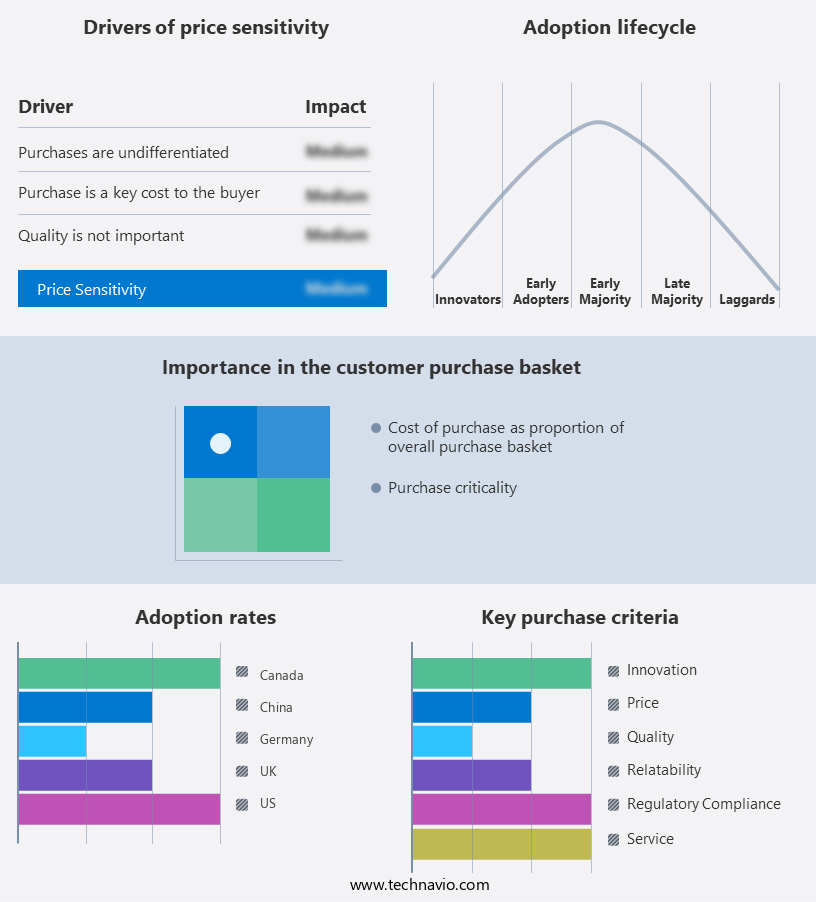
Customer Landscape of Enterprise Application Software Industry
Competitive Landscape
Companies are implementing various strategies, such as strategic alliances, enterprise application software market forecast, partnerships, mergers and acquisitions, geographical expansion, and product/service launches, to enhance their presence in the industry.
Accenture PLC - This company specializes in enterprise application software, delivering value-driven application management solutions. Their offerings enhance business efficiency and productivity through innovative technology and strategic implementation.
The industry research and growth report includes detailed analyses of the competitive landscape of the market and information about key companies, including:
- Accenture PLC
- BMC Software Inc.
- Broadcom Inc.
- Capgemini Service SAS
- Cognizant Technology Solutions Corp.
- Epicor Software Corp.
- Guidewire Software Inc.
- IFS World Operations AB
- Infor Inc.
- International Business Machines Corp.
- Intuit Inc.
- Microsoft Corp.
- Oracle Corp.
- QAD Inc.
- Salesforce Inc.
- SAP SE
- SYSPRO Pty. Ltd.
- TP and P Technology
- Virtusa Corp.
- Zendesk Inc.
- Zoho Corp. Pvt. Ltd.
Qualitative and quantitative analysis of companies has been conducted to help clients understand the wider business environment as well as the strengths and weaknesses of key industry players. Data is qualitatively analyzed to categorize companies as pure play, category-focused, industry-focused, and diversified; it is quantitatively analyzed to categorize companies as dominant, leading, strong, tentative, and weak.
Recent Development and News in Enterprise Application Software Market
- In January 2024, Microsoft announced the global availability of its new low-code application development platform, Power Apps Studio, aiming to simplify enterprise application development and enhance digital transformation initiatives (Microsoft Press Release).
- In March 2024, Salesforce and Google Cloud formed a strategic partnership, integrating Salesforce Customer 360 and Google Workspace to offer a seamless customer experience and improve productivity for businesses (Salesforce Press Release).
- In April 2024, Oracle completed the acquisition of NetSuite, a leading provider of cloud-based enterprise resource planning (ERP) and enterprise performance management (EPM) software, strengthening Oracle's position in the cloud applications market (Oracle Press Release).
- In May 2025, SAP launched S/4HANA Cloud, its next-generation enterprise resource planning solution, featuring advanced AI and machine learning capabilities, which was adopted by over 10,000 customers within the first month of its release (SAP Press Release).
Dive into Technavio’s robust research methodology, blending expert interviews, extensive data synthesis, and validated models for unparalleled Enterprise Application Software Market insights. See full methodology.
|
Market Scope |
|
|
Report Coverage |
Details |
|
Page number |
235 |
|
Base year |
2024 |
|
Historic period |
2019-2023 |
|
Forecast period |
2025-2029 |
|
Growth momentum & CAGR |
Accelerate at a CAGR of 7.9% |
|
Market growth 2025-2029 |
USD 146.5 billion |
|
Market structure |
Fragmented |
|
YoY growth 2024-2025(%) |
7.5 |
|
Key countries |
US, Canada, Germany, UK, China, France, Mexico, Japan, Italy, and India |
|
Competitive landscape |
Leading Companies, Market Positioning of Companies, Competitive Strategies, and Industry Risks |
Research Analyst Overview
- The market continues to evolve, driven by the adoption of innovative technologies and methodologies. Serverless computing and containerization technologies are transforming the way applications are developed and deployed, enabling businesses to build and scale applications more efficiently. Agile development methodology and artificial intelligence applications are streamlining development processes and enhancing business intelligence. Cybersecurity measures and data analytics tools are becoming increasingly important as businesses prioritize data protection and insights. User experience design and customer relationship management systems are also critical, as companies focus on delivering exceptional customer experiences. Knowledge management systems and data visualization dashboards are essential for effective information management and decision-making.
- Application security, workflow automation, and business intelligence platforms are key areas of investment for organizations seeking to optimize processes and improve productivity. Compliance regulations, process optimization, and technical support services are also crucial for maintaining regulatory compliance and ensuring smooth operations. Cloud-based applications, microservices architecture, and machine learning algorithms are revolutionizing enterprise software, enabling real-time data processing and predictive analytics. Supply chain management, human capital management, and database management systems are also benefiting from these advancements. According to recent estimates, the market is expected to grow by over 10% annually in the coming years, driven by the increasing adoption of these technologies and the need for business agility and efficiency.
- For instance, a leading retailer reported a 25% increase in sales through the implementation of a predictive analytics system.
What are the Key Data Covered in this Enterprise Application Software Market Research and Growth Report?
-
What is the expected growth of the Enterprise Application Software Market between 2025 and 2029?
-
USD 146.5 billion, at a CAGR of 7.9%
-
-
What segmentation does the market report cover?
-
The report is segmented by Deployment (On-premises and Cloud-based), Solution (Enterprise resource planning, Analytics and business intelligence, Customer relationship management, Supply chain management, and Others), End-user (BFSI, IT and telecommunication, Retail and e-commerce, Government and public sector, and Others), and Geography (North America, Europe, APAC, South America, and Middle East and Africa)
-
-
Which regions are analyzed in the report?
-
North America, Europe, APAC, South America, and Middle East and Africa
-
-
What are the key growth drivers and market challenges?
-
Introduction of cloud-based deployment solutions, Threat from open-source enterprise application software providers
-
-
Who are the major players in the Enterprise Application Software Market?
-
Accenture PLC, BMC Software Inc., Broadcom Inc., Capgemini Service SAS, Cognizant Technology Solutions Corp., Epicor Software Corp., Guidewire Software Inc., IFS World Operations AB, Infor Inc., International Business Machines Corp., Intuit Inc., Microsoft Corp., Oracle Corp., QAD Inc., Salesforce Inc., SAP SE, SYSPRO Pty. Ltd., TP and P Technology, Virtusa Corp., Zendesk Inc., and Zoho Corp. Pvt. Ltd.
-
Market Research Insights
- The market is a dynamic and ever-evolving landscape, encompassing various solutions such as software design principles, application programming interfaces, and both proprietary and open-source offerings. This market continues to expand, with industry analysts anticipating a growth rate of approximately 10% annually. For instance, the implementation of cloud security measures in enterprise applications has resulted in a significant increase in sales for related companies. Furthermore, the integration of multiple software solutions, including capacity planning, web application development, and system integration, has become a crucial aspect of modern business operations.
We can help! Our analysts can customize this enterprise application software market research report to meet your requirements.
 RIA -
RIA - 
