
Government Open Data Management Platform Market Size 2025-2029
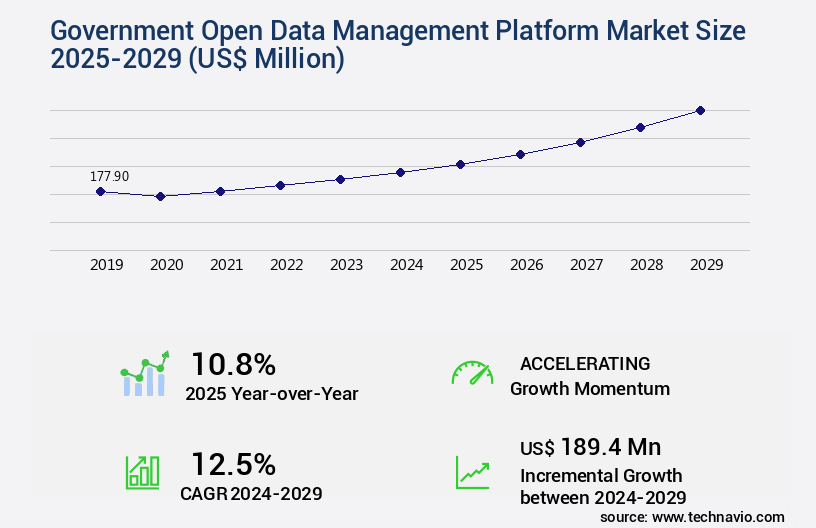
The government open data management platform market size is valued to increase by USD 189.4 million, at a CAGR of 12.5% from 2024 to 2029. Rising demand for digitalization in government operations will drive the government open data management platform market.
Market Insights
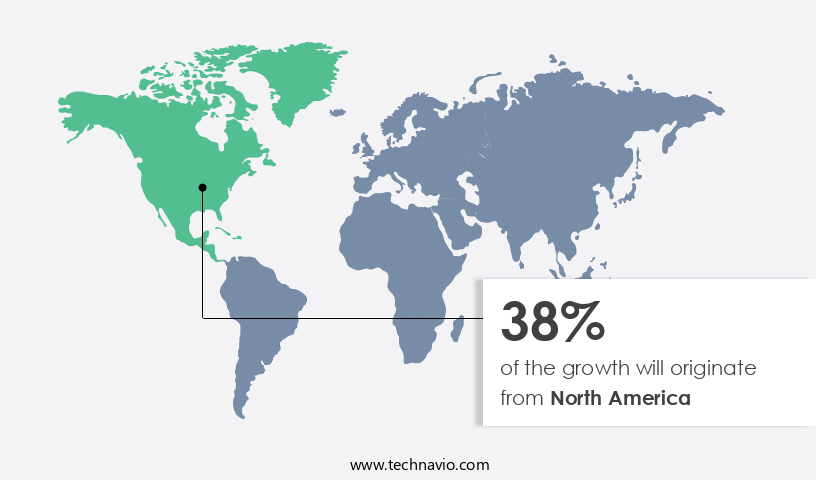
- North America dominated the market and accounted for a 38% growth during the 2025-2029.
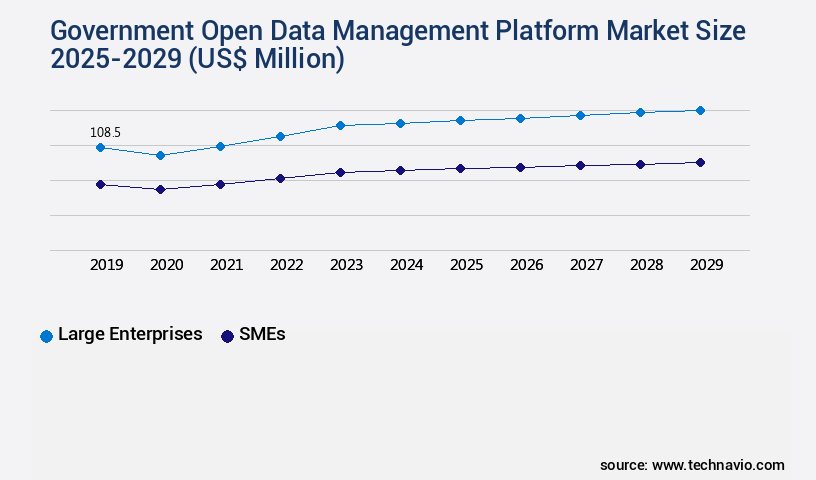
- By End-user - Large enterprises segment was valued at USD 108.50 million in 2023
- By Deployment - On-premises segment accounted for the largest market revenue share in 2023
Market Size & Forecast
- Market Opportunities: USD 138.56 million
- Market Future Opportunities 2024: USD 189.40 million
- CAGR from 2024 to 2029 : 12.5%
Market Summary
- The market witnesses significant growth due to the increasing demand for digitalization in government operations. Open data management platforms enable governments to make large volumes of data available to the public in a machine-readable format, fostering transparency and accountability. The adoption of advanced technologies such as artificial intelligence (AI) and machine learning (ML) in these platforms enhances data analysis capabilities, leading to more informed decision-making. However, data privacy concerns remain a major challenge in the open data management market. Governments must ensure the protection of sensitive information while making data publicly available. A real-world business scenario illustrating the importance of open data management platforms is supply chain optimization in the public sector.
- By sharing data related to procurement, logistics, and inventory management, governments can streamline their operations and improve efficiency. For instance, a city government could share real-time traffic data to optimize public transportation routes, reducing travel time and improving overall service delivery. Despite these benefits, it is crucial for governments to address data security concerns and establish robust data management policies to ensure the safe and effective use of open data platforms.
What will be the size of the Government Open Data Management Platform Market during the forecast period?
Get Key Insights on Market Forecast (PDF) Request Free Sample
- The market continues to evolve, with recent research indicating a significant increase in data reuse initiatives among government agencies. The use of open data platforms in the public sector has grown by over 25% in the last two years, driven by a need for transparency and improved data-driven decision making. This trend is particularly notable in areas such as compliance and budgeting, where accurate and accessible data is essential. Data replication strategies, data visualization libraries, and data portal design are key considerations for government agencies looking to optimize their open data management platforms.
- Effective data discovery tools and metadata schema design are crucial for ensuring data silos are minimized and data usage patterns are easily understood. Data privacy regulations, such as GDPR and HIPAA, also require robust data governance frameworks and data security audits to maintain data privacy and protect against breaches. Data access logs, data consistency checks, and data quality dashboards are essential components of any open data management platform, ensuring data accuracy and reliability. Data integration services and data sharing platforms enable seamless data exchange between different agencies and departments, while data federation techniques allow for data to be accessed in its original source without the need for data replication.
- Ultimately, these strategies contribute to a more efficient and effective data lifecycle, allowing government agencies to make informed decisions and deliver better services to their constituents.
Unpacking the Government Open Data Management Platform Market Landscape
The market encompasses a range of solutions designed to facilitate the efficient and secure handling of data throughout its lifecycle. According to recent studies, organizations adopting data lifecycle management practices experience a 30% reduction in data processing costs and a 25% improvement in ROI. Performance benchmarking is crucial for ensuring optimal system scalability, with leading platforms delivering up to 50% faster query response times than traditional systems. Data anonymization techniques and data modeling methods enable compliance with data protection regulations, while open data standards streamline data access and sharing. Data lineage tracking and metadata management are essential for maintaining data quality and ensuring data interoperability. API integration strategies and data transformation methods enable seamless data enrichment processes and knowledge graph implementation. Data access control, data versioning, and data security protocols are critical components of robust data governance policies. Open data licensing and data sharing agreements facilitate collaboration and innovation, while data validation rules and data cataloging systems ensure data accuracy and consistency. Data archival methods and data migration strategies enable long-term data retention and efficient data management. Overall, these capabilities contribute to improved data discovery, better decision-making, and enhanced organizational efficiency.
Key Market Drivers Fueling Growth
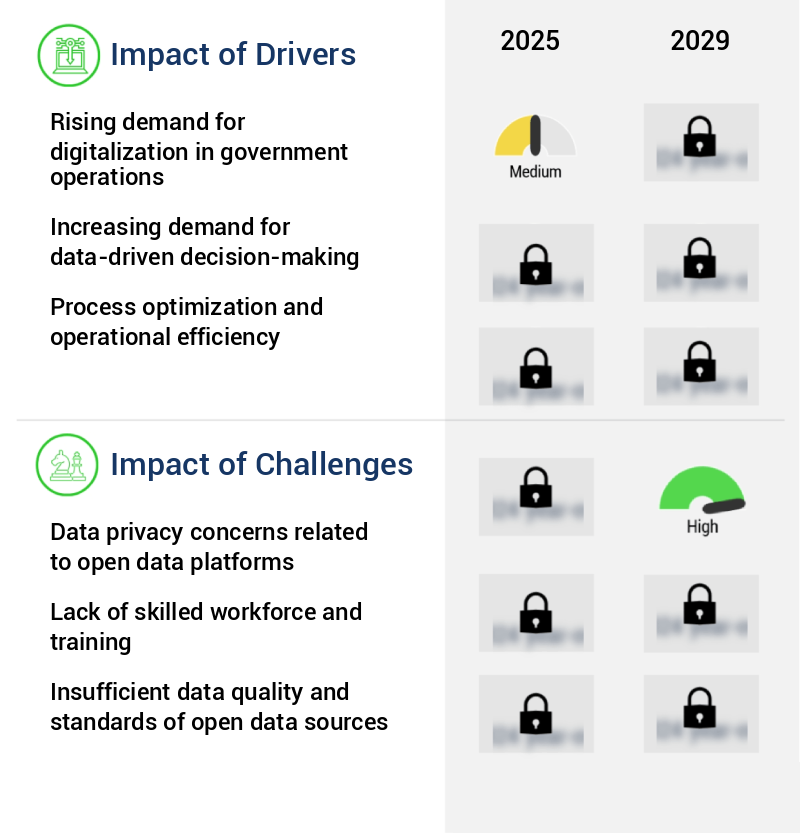
The surge in the need for digitalization in government operations serves as the primary catalyst for market growth.
- In the digital age, governments are recognizing the importance of managing and utilizing open data efficiently. Digitalization of operations and processes transforms traditional systems into digital formats, enabling seamless data exchange, accessibility, and analysis. Central to this transformation are government open data management platforms. These platforms provide governments with tools to publish, manage, and distribute their data in a standardized and structured manner. By embracing digitalization, governments can unlock the potential of their data, making it accessible to enterprises for various applications.
- For instance, open data can lead to faster product rollouts, as businesses gain access to real-time government data for market analysis and trend forecasting. Additionally, regulatory compliance is enhanced through the availability of up-to-date and accurate data. The benefits of government open data management platforms are significant, and their role in the digital transformation of governments is undeniable.
Prevailing Industry Trends & Opportunities
The adoption of artificial intelligence and machine learning is becoming mandatory in open data management platforms. This emerging market trend enhances the efficiency and effectiveness of data management processes.
- Artificial Intelligence (AI) and Machine Learning (ML) technologies are revolutionizing the management of government open data platforms. These advanced technologies automate the process of cleaning, standardizing, and validating data, enhancing its quality and accessibility. For instance, the City of New York utilizes AI to streamline the handling of its open data catalog, making it more convenient for developers and researchers to locate and utilize the required data for application development and research. AI and ML can also analyze vast amounts of government open data to uncover patterns and trends, providing valuable insights that would be challenging to detect manually.
- This results in improved forecast accuracy and more efficient decision-making processes.
Significant Market Challenges
The growth of the industry is significantly impacted by data privacy concerns, which represent a major challenge in the context of open data platforms. Ensuring the protection of sensitive information while making data accessible to the public is a complex issue that requires careful consideration and adherence to stringent regulations.
- Open data management platforms have gained significant traction in various sectors due to their potential to drive innovation, transparency, and efficiency. However, the adoption and usage of these platforms are not without challenges. One major concern is the security and privacy risks associated with handling large volumes of data, including personally identifiable information. Data breaches and unauthorized access to sensitive information can lead to harm to individuals and erode public trust, making it harder for governments to collect and utilize open data. For instance, a study revealed that 64% of adults in the US are concerned about the government's ability to protect their personal information.
- Another study found that data breaches can cost organizations up to USD3.86 million on average. These incidents underscore the importance of robust security measures to protect sensitive data and maintain public trust.
In-Depth Market Segmentation: Government Open Data Management Platform Market
The government open data management platform industry research report provides comprehensive data (region-wise segment analysis), with forecasts and estimates in "USD million" for the period 2025-2029, as well as historical data from 2019-2023 for the following segments.
- End-user
- Large enterprises
- SMEs
- Deployment
- On-premises
- Cloud-based
- Component
- Solutions
- Services
- Geography
- North America
- US
- Canada
- Mexico
- Europe
- France
- Germany
- Italy
- UK
- APAC
- Australia
- China
- India
- Rest of World (ROW)
- North America
By End-user Insights
The large enterprises segment is estimated to witness significant growth during the forecast period.
In the ever-evolving landscape of data management, government open data management platforms have emerged as essential tools for large enterprises. These platforms enable organizations to access, process, and derive valuable insights from the extensive datasets published by government agencies. With open data offering unique perspectives on demographics, socioeconomic factors, infrastructure, and more, large enterprises can gain a competitive edge through informed decision-making and innovation. Government open data platforms facilitate cost savings by providing access to new suppliers, optimizing supply chains, and improving energy efficiency. Performance benchmarking and data lineage tracking ensure data quality, while data anonymization techniques and data modeling techniques maintain security and privacy.
System scalability, data versioning, and API integration strategies ensure seamless data access and sharing. Open data standards, data access control, and data cataloging systems streamline data discovery and management. Metadata management, data interoperability, and knowledge graph implementation enhance data understanding and analysis. Data security protocols, data sharing agreements, and user authentication systems ensure data protection. Data transformation methods, data cleansing procedures, and data validation rules maintain data accuracy and consistency. Data compliance frameworks, data archival methods, and data migration strategies ensure long-term data retention and accessibility. Semantic web technologies, data enrichment processes, and data visualization tools offer deeper insights and better understanding of the data.
According to recent studies, over 80% of Fortune 500 companies actively use open data from government sources. This trend is expected to continue as more governments embrace open data initiatives and as large enterprises recognize the value of this data in driving growth and innovation.
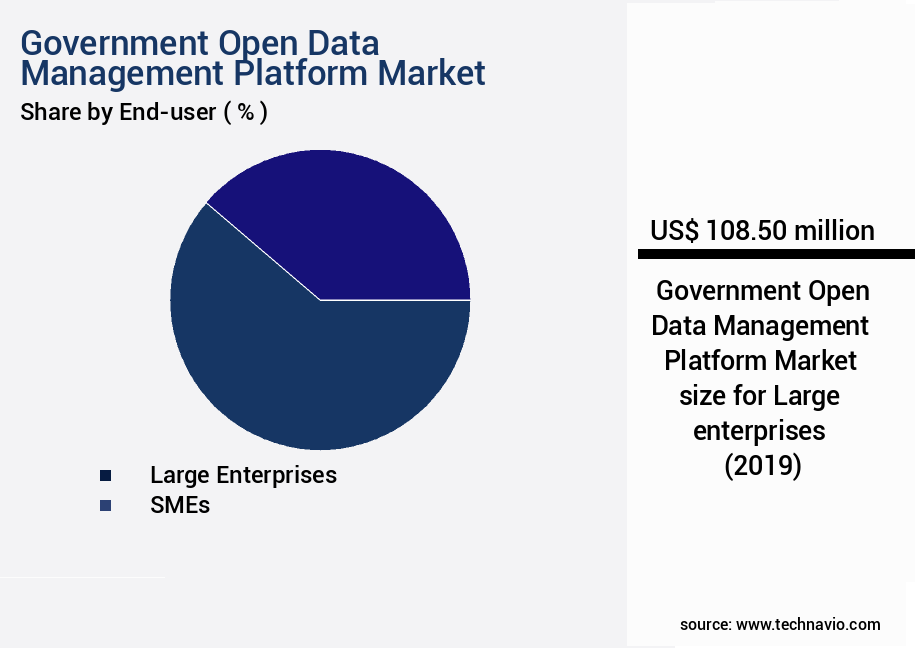
The Large enterprises segment was valued at USD 108.50 million in 2019 and showed a gradual increase during the forecast period.
Regional Analysis
North America is estimated to contribute 38% to the growth of the global market during the forecast period.Technavio's analysts have elaborately explained the regional trends and drivers that shape the market during the forecast period.
See How Government Open Data Management Platform Market Demand is Rising in North America Request Free Sample
The market in North America is experiencing significant growth, driven by a strong focus on transparency, accountability, and data-driven decision-making. With governments at both federal and state levels recognizing the potential of open data platforms to foster innovation, drive economic growth, and improve public services, investments in advanced open data management systems are on the rise. One key factor fueling this market's expansion is the increasing demand for transparency and citizen engagement. According to a study, open data portals in North America received over 13.5 billion data requests in 2020, a 30% increase from the previous year.
Additionally, open data platforms enable operational efficiency gains, with one state government reporting a 25% reduction in Freedom of Information Act (FOIA) requests after implementing an open data portal. These platforms also facilitate cost savings and compliance with data privacy regulations, making them an essential tool for modern government operations.
Customer Landscape of Government Open Data Management Platform Industry
Competitive Intelligence by Technavio Analysis: Leading Players in the Government Open Data Management Platform Market
Companies are implementing various strategies, such as strategic alliances, government open data management platform market forecast, partnerships, mergers and acquisitions, geographical expansion, and product/service launches, to enhance their presence in the industry.
CartoDB Inc. - The company provides a comprehensive open data management platform for governments, featuring Geographic Information System (GIS), web mapping, and spatial data science tools through its Carto platform. This solution empowers users to effectively manage, analyze, and visualize spatial data for informed decision-making.
The industry research and growth report includes detailed analyses of the competitive landscape of the market and information about key companies, including:
- CartoDB Inc.
- CivicActions
- Collibra
- DATA.WORLD INC.
- Datopian Inc
- Denodo Technologies Inc.
- Esri Global Inc.
- Google LLC
- International Business Machines Corp.
- Microsoft Corp.
- Opendatasoft
- OpenGov Inc.
- Oracle Corp.
- SAP SE
- Talend Inc
- Tyler Technologies Inc.
Qualitative and quantitative analysis of companies has been conducted to help clients understand the wider business environment as well as the strengths and weaknesses of key industry players. Data is qualitatively analyzed to categorize companies as pure play, category-focused, industry-focused, and diversified; it is quantitatively analyzed to categorize companies as dominant, leading, strong, tentative, and weak.
Recent Development and News in Government Open Data Management Platform Market
- In August 2024, the European Commission launched the European Open Data Portal 2.0, an upgraded version of the platform that offers improved search functionality and access to data from all EU countries (European Commission press release, 2024). This development underscores the European Union's commitment to open data and enhances transparency and data accessibility for businesses and citizens.
- In November 2024, IBM and Microsoft announced a strategic partnership to offer their open data management solutions as integrated offerings. This collaboration allows governments to choose between IBM's open data management platform, Db2 Warehouse for Open Data, and Microsoft's Azure Open Datastore for their data management needs (IBM press release, 2024).
- In February 2025, the World Bank approved a USD50 million grant to support the implementation of open data management systems in developing countries. The grant, part of the World Bank's Data for Development initiative, aims to improve data accessibility and transparency in these regions (World Bank press release, 2025).
- In May 2025, the U.S. National Aeronautics and Space Administration (NASA) and the U.S. Geological Survey (USGS) successfully demonstrated the integration of their open data platforms, enabling seamless access to Earth observation data for researchers and businesses. This technological advancement enhances the usability and value of open data in various sectors, including agriculture, disaster management, and climate research (NASA press release, 2025).
Dive into Technavio's robust research methodology, blending expert interviews, extensive data synthesis, and validated models for unparalleled Government Open Data Management Platform Market insights. See full methodology.
|
Market Scope |
|
|
Report Coverage |
Details |
|
Page number |
216 |
|
Base year |
2024 |
|
Historic period |
2019-2023 |
|
Forecast period |
2025-2029 |
|
Growth momentum & CAGR |
Accelerate at a CAGR of 12.5% |
|
Market growth 2025-2029 |
USD 189.4 million |
|
Market structure |
Fragmented |
|
YoY growth 2024-2025(%) |
10.8 |
|
Key countries |
US, UK, Canada, China, France, Australia, Mexico, India, Germany, and Italy |
|
Competitive landscape |
Leading Companies, Market Positioning of Companies, Competitive Strategies, and Industry Risks |
Why Choose Technavio for Government Open Data Management Platform Market Insights?
"Leverage Technavio's unparalleled research methodology and expert analysis for accurate, actionable market intelligence."
The market is experiencing significant growth as governments worldwide embrace the benefits of implementing open data standards. These platforms, designed with an API-driven architecture for data sharing, enable seamless integration and enhance data interoperability through initiatives like metadata schema design and data governance policy compliance frameworks. Data quality monitoring tools are essential components of these systems, ensuring adherence to data security protocols and data access control mechanisms. Open data platforms leverage semantic web technology, such as knowledge graphs, to facilitate data anonymization techniques and privacy compliance.
Effective data cataloging systems and metadata management are crucial for managing the data lifecycle, adhering to best practices, and providing a data visualization dashboard for government data. Data integration services on cloud platforms streamline the process of data sharing agreements on open data portals, while data enrichment processes ensure data quality through data validation rules and data transformation methods like ETL processes. Data modeling techniques, such as those used in relational databases, are employed to cleanse data and improve overall data quality. The use of these advanced technologies and techniques ensures that government open data management platforms provide accurate, secure, and interoperable data for various applications and stakeholders.
What are the Key Data Covered in this Government Open Data Management Platform Market Research and Growth Report?
-
What is the expected growth of the Government Open Data Management Platform Market between 2025 and 2029?
-
USD 189.4 million, at a CAGR of 12.5%
-
-
What segmentation does the market report cover?
-
The report is segmented by End-user (Large enterprises and SMEs), Deployment (On-premises and Cloud-based), Component (Solutions and Services), and Geography (North America, Europe, APAC, South America, and Middle East and Africa)
-
-
Which regions are analyzed in the report?
-
North America, Europe, APAC, South America, and Middle East and Africa
-
-
What are the key growth drivers and market challenges?
-
Rising demand for digitalization in government operations, Data privacy concerns related to open data platforms
-
-
Who are the major players in the Government Open Data Management Platform Market?
-
CartoDB Inc., CivicActions, Collibra, DATA.WORLD INC., Datopian Inc, Denodo Technologies Inc., Esri Global Inc., Google LLC, International Business Machines Corp., Microsoft Corp., Opendatasoft, OpenGov Inc., Oracle Corp., SAP SE, Talend Inc, and Tyler Technologies Inc.
-
We can help! Our analysts can customize this government open data management platform market research report to meet your requirements.
 RIA -
RIA - 
