Hydrogen Generation Market Analysis, Size, and Forecast 2024-2028: North America (US and Canada), Europe (France, Germany, Italy, and UK), Middle East and Africa (Egypt, KSA, Oman, and UAE), APAC (China, India, and Japan), South America (Argentina and Brazil), and Rest of World (ROW)

Hydrogen Generation Market Analysis, Size, and Forecast 2024-2028:
North America (US and Canada), Europe (France, Germany, Italy, and UK), Middle East and Africa (Egypt, KSA, Oman, and UAE), APAC (China, India, and Japan), South America (Argentina and Brazil), and Rest of World (ROW)

Published: May 2024 179 Pages SKU: IRTNTR43099

Market Overview at a Glance

$49.7 B
Market Opportunity
5.52%
CAGR
5.21
YoY growth 2023-2024(%)

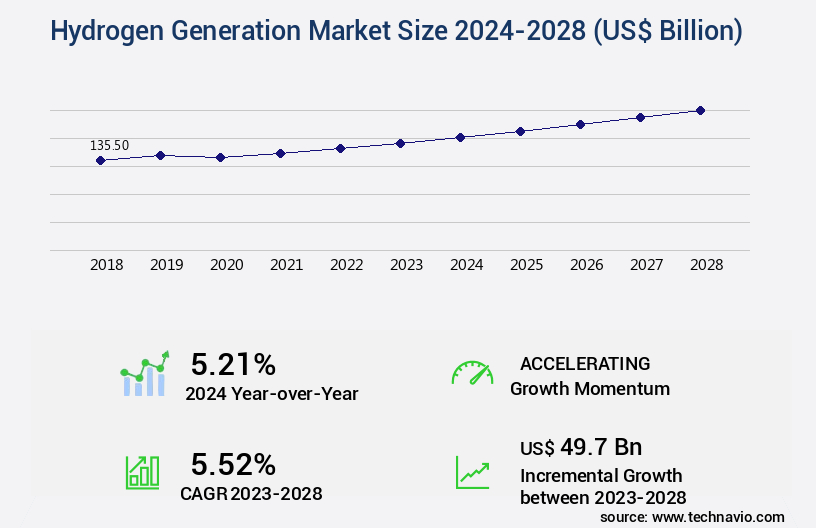
Hydrogen Generation Market Size 2024-2028

The hydrogen generation market size is valued to increase USD 49.7 billion, at a CAGR of 5.52% from 2023 to 2028. Growing demand for fertilizers will drive the hydrogen generation market.

Major Market Trends & Insights

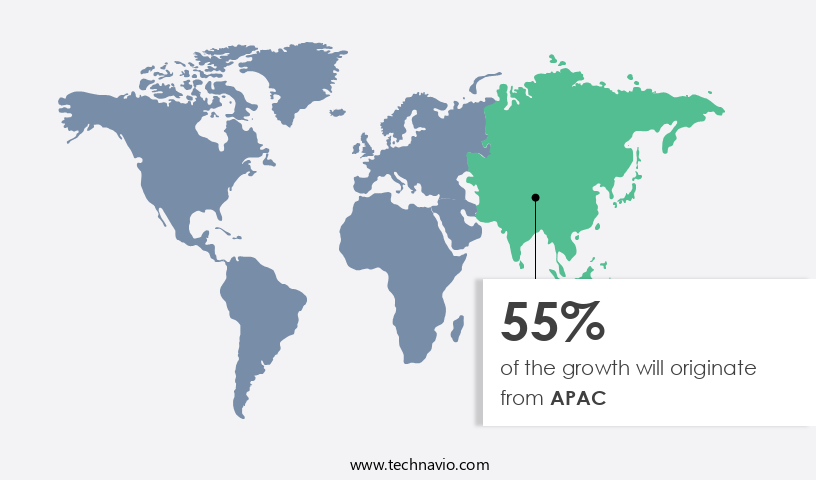
  • APAC dominated the market and accounted for a 55% growth during the forecast period.
  • By Delivery Mode - Merchant segment was valued at USD 98.40 billion in 2022
  • By Application - Chemical industry segment accounted for the largest market revenue share in 2022

Market Size & Forecast

  • Market Opportunities: USD 55.57 billion
  • Market Future Opportunities: USD 49.70 billion
  • CAGR from 2023 to 2028 : 5.52%

Market Summary

  • The market is experiencing significant expansion, fueled by the increasing demand for clean energy sources and the decreasing costs of hydrogen production. According to a recent study, the global market for hydrogen generation is projected to reach a value of USD150 billion by 2027, underscoring its growing importance in various industries. Key drivers for this growth include the rising demand for hydrogen as a clean fuel for transportation and industrial applications, as well as advancements in hydrogen production technologies. For instance, the development of more efficient methods for producing green hydrogen, which is derived from renewable energy sources, is expected to further boost market growth.
  • Moreover, changes in government policies and regulations are also contributing to the expansion of the market. For example, several governments have set ambitious targets for reducing greenhouse gas emissions, which is leading to increased investment in hydrogen infrastructure. Despite these positive trends, challenges remain. One major challenge is the high capital cost of hydrogen production and infrastructure development. However, ongoing research and development efforts are aimed at reducing these costs and making hydrogen a more competitive energy source. In conclusion, the market is poised for continued growth, driven by increasing demand for clean energy, technological advancements, and supportive government policies.
  • Despite challenges, the market's future looks bright, with significant opportunities for innovation and expansion.

What will be the Size of the Hydrogen Generation Market during the forecast period?

Hydrogen Generation Market Size

Get Key Insights on Market Forecast (PDF) Request Free Sample

How is the Hydrogen Generation Market Segmented ?

The hydrogen generation industry research report provides comprehensive data (region-wise segment analysis), with forecasts and estimates in "USD billion" for the period 2024-2028, as well as historical data from 2018-2022 for the following segments.

  • Delivery Mode
    • Merchant
    • Captive
  • Application
    • Chemical industry
    • Refinery industry
    • Metal processing industry
    • Others
  • End-User
    • Industrial
    • Transportation
    • Energy
    • Chemicals
  • Type
    • Green Hydrogen
    • Blue Hydrogen
    • Grey Hydrogen
  • Geography
    • North America
      • US
      • Canada
    • Europe
      • France
      • Germany
      • Italy
      • UK
    • Middle East and Africa
      • Egypt
      • KSA
      • Oman
      • UAE
    • APAC
      • China
      • India
      • Japan
    • South America
      • Argentina
      • Brazil
    • Rest of World (ROW)

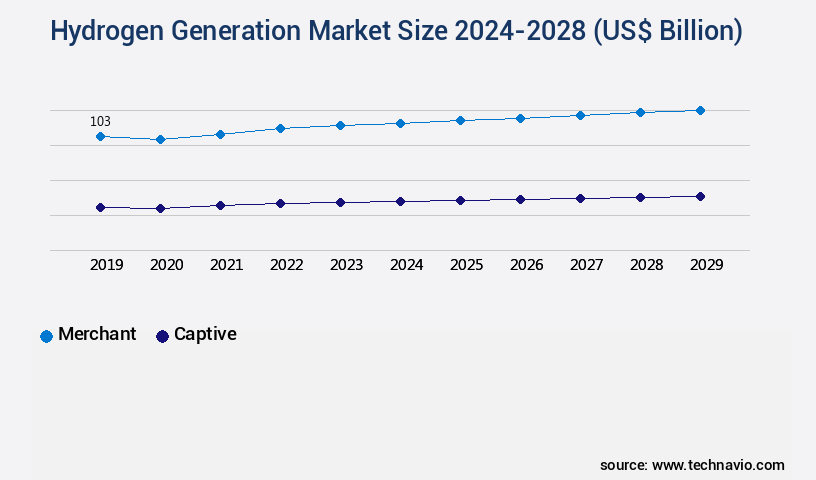
    By Delivery Mode Insights

    The merchant segment is estimated to witness significant growth during the forecast period.

    The market continues to evolve, with ongoing advancements in hydrogen production technologies and infrastructure development. One significant trend is the increasing adoption of renewable energy sources for green hydrogen production through processes like alkaline water electrolysis and photoelectrochemical water splitting. Power-to-gas systems, which convert excess renewable energy into hydrogen, are also gaining traction. Hydrogen purity levels are a crucial concern, with fuel cell technology requiring high purity levels. Membrane degradation and catalyst poisoning are common challenges in maintaining hydrogen quality. Safety protocols, including pipeline transportation and hydrogen refueling station design, are essential for mitigating risks. The electrolysis process, including steam methane reforming and solid oxide electrolysis, is undergoing significant cost reduction efforts.

    Production cost reductions, driven by advancements in catalysts and compression systems, are essential for widespread hydrogen adoption. Hydrogen infrastructure, including hydrogen storage tanks and distribution networks, is expanding to accommodate growing demand. According to recent studies, the global hydrogen market is projected to reach a value of USD250 billion by 2027, growing at a CAGR of 8.7% from 2020 to 2027. This growth is driven by the increasing demand for hydrogen as a clean energy source and the ongoing advancements in production, storage, and distribution technologies.

    Hydrogen Generation Market Size

    Request Free Sample

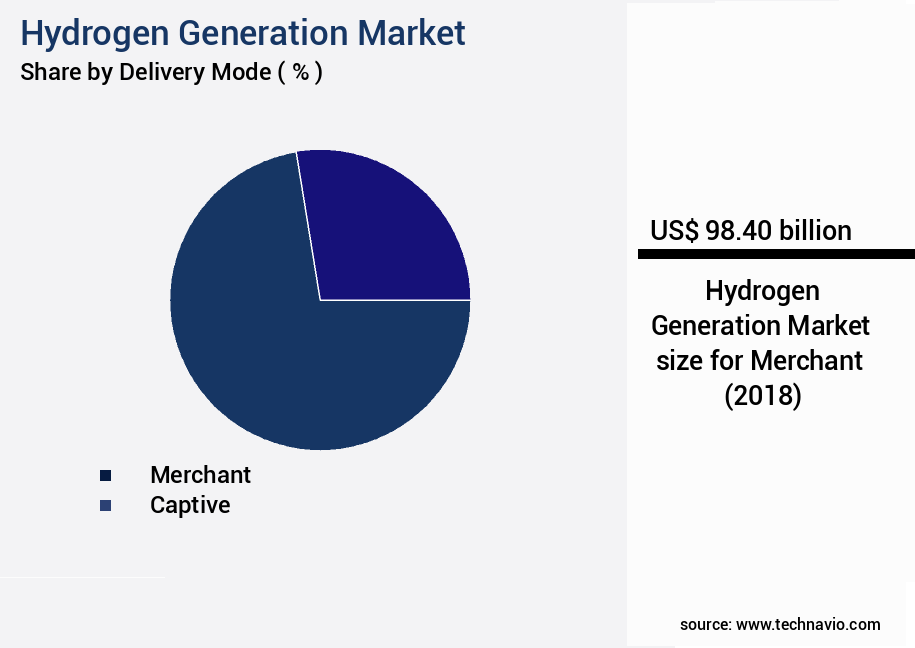
    The Merchant segment was valued at USD 98.40 billion in 2018 and showed a gradual increase during the forecast period.

    Hydrogen Generation Market Size

    Request Free Sample

    Regional Analysis

    APAC is estimated to contribute 55% to the growth of the global market during the forecast period.Technavio’s analysts have elaborately explained the regional trends and drivers that shape the market during the forecast period.

    Hydrogen Generation Market Share by Geography

    See How Hydrogen Generation Market Demand is Rising in APAC Request Free Sample

    The market in the Asia Pacific (APAC) region is experiencing significant growth, fueled by increasing investments in various industries. Key sectors driving this expansion include chemical, fertilizer, refinery, glass, semiconductor, metal processing, and food. The refinery industry in APAC is particularly robust due to the substantial local demand for refined petroleum products like gasoline and diesel. Countries such as India and China, with healthy economic growth rates, contribute significantly to this demand. In response to government regulations, oil and gas refineries in the region are reducing sulfur content in diesel, necessitating an increase in hydrogen production.

    For instance, Indian Oil Corporation Limited (IOCL) and its subsidiary, Chennai Petroleum Corporation Limited (CPCL), along with equity partners, established a joint venture in November 2022 to construct the planned Nagapattinam refinery and petrochemicals project in Tamil Nadu, India. This venture underscores the growing importance of hydrogen generation in the refining process.

    Market Dynamics

    Our researchers analyzed the data with 2023 as the base year, along with the key drivers, trends, and challenges. A holistic analysis of drivers will help companies refine their marketing strategies to gain a competitive advantage.

    The market is experiencing significant growth due to the increasing demand for clean energy sources. High-temperature electrolysis systems are gaining popularity in the market due to their efficiency in producing hydrogen through water electrolysis. However, the design and maintenance of these systems require careful consideration, especially when it comes to the durability of PEM electrolyzer stack components. Alkaline electrolyzer membranes, a common alternative, face their own challenges, including membrane lifetime and cost-effectiveness. As hydrogen refueling station infrastructure expands, ensuring safety and efficiency becomes crucial. Green hydrogen production cost analysis is a critical factor in the market's growth, with photoelectrochemical water splitting and solid oxide electrolyzer cells being potential cost-effective solutions. Photoelectrochemical water splitting efficiency and solid oxide electrolyzer cell degradation are areas of ongoing research to optimize hydrogen production. Hydrogen pipeline transportation safety is another significant concern, with hydrogen's unique properties requiring specialized infrastructure. Fuel cell stack durability testing methods and hydrogen storage tank material selection criteria are essential components of ensuring safety and reliability. Energy conversion efficiency optimization strategies and electrolyzer system energy consumption reduction are also key areas of focus for cost-effective hydrogen production. Hydrogen purification methods using membranes are essential for removing impurities and ensuring high-quality hydrogen. Membrane technology advancements continue to improve the efficiency and cost-effectiveness of hydrogen production. Hydrogen distribution network optimization is necessary to ensure the efficient and cost-effective delivery of hydrogen to consumers. Overall, the market's future lies in the continuous development and optimization of these technologies and infrastructure.

    Hydrogen Generation Market Size

    What are the key market drivers leading to the rise in the adoption of Hydrogen Generation Industry?

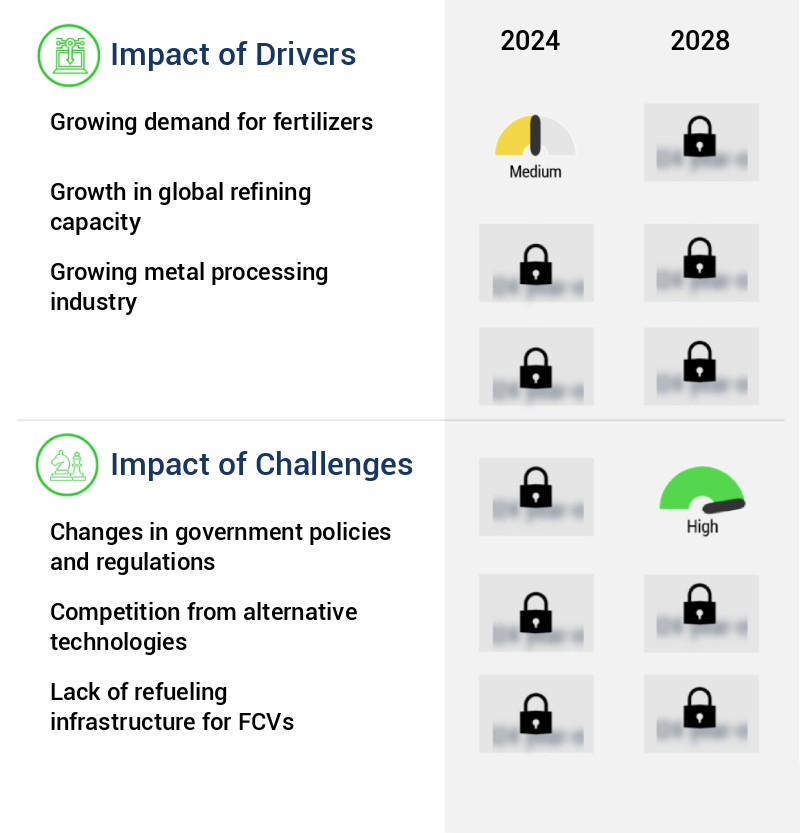
    • The significant surge in the demand for fertilizers serves as the primary market driver. 

    • In response to the escalating global population and the subsequent demand for food, agricultural production is anticipated to expand continually. By the year 2025, the food demand is projected to double. To cater to this increasing demand, intensive farming and protective cropping methods will be essential. However, environmental fluctuations pose a challenge to most agricultural systems. Approximately 800 million people worldwide still grapple with persistent hunger. To ensure adequate nutrition for the global population, the focus on agricultural production will remain a priority. Optimizing fertilizer management is crucial for enhancing agricultural production. Nitrogen fertilizers, specifically, will play a significant role in this regard.
    • Ammonia, a primary component in nitrogen fertilizers, is commonly used. Among various nitrogen fertilizer forms, ammonium nitrate is the preferred choice due to its efficiency and ease of application. The agricultural sector's continuous evolution and the ongoing demand for food production necessitate the implementation of the best fertilizer management practices.

    What are the market trends shaping the Hydrogen Generation Industry?

    • The decline in fuel cell prices is currently the prevailing market trend. A significant reduction in fuel cell costs is presently shaping the market landscape.

    • Over the past few years, the declining cost structure of fuel cell technology has been a significant driving force, primarily due to advancements in research and development. Two primary factors contributing to the cost reduction are: a decrease in platinum loading on anodes and improvements in bipolar plate formation and welding processes. Conversely, the larger bipolar plates and modified gas diffusion layers have led to increased manufacturing costs.
    • Despite these offsetting factors, the cost reduction trend is expected to continue, leading to an expansion of fuel cell applications across various sectors. This expansion, in turn, will result in heightened demand for hydrogen gas, thereby fostering the growth of the market.

    What challenges does the Hydrogen Generation Industry face during its growth?

    • The evolution of government policies and regulations poses a significant challenge to the industry, requiring continuous adaptation and compliance to ensure growth. 

    • The hydrogen and fuel cell industry is currently undergoing development without extensive government regulations concerning the storage, design, transportation, and installation of fuel cell systems and hydrogen infrastructure products in major markets like Canada, the EU, and the US. However, the production of electricity, a significant area for regulatory involvement, is subject to specific government guidelines. Emerging technologies enable hydrogen to be utilized for storing electricity in renewable electricity generation.
    • At present, there is no industry-specific legislation for fuel cell vehicles. With anticipated growth, the market is projected to face regulatory requirements in various markets. The industry's continuous evolution and expanding applications across various sectors necessitate a professional, informed approach.

    Exclusive Technavio Analysis on Customer Landscape

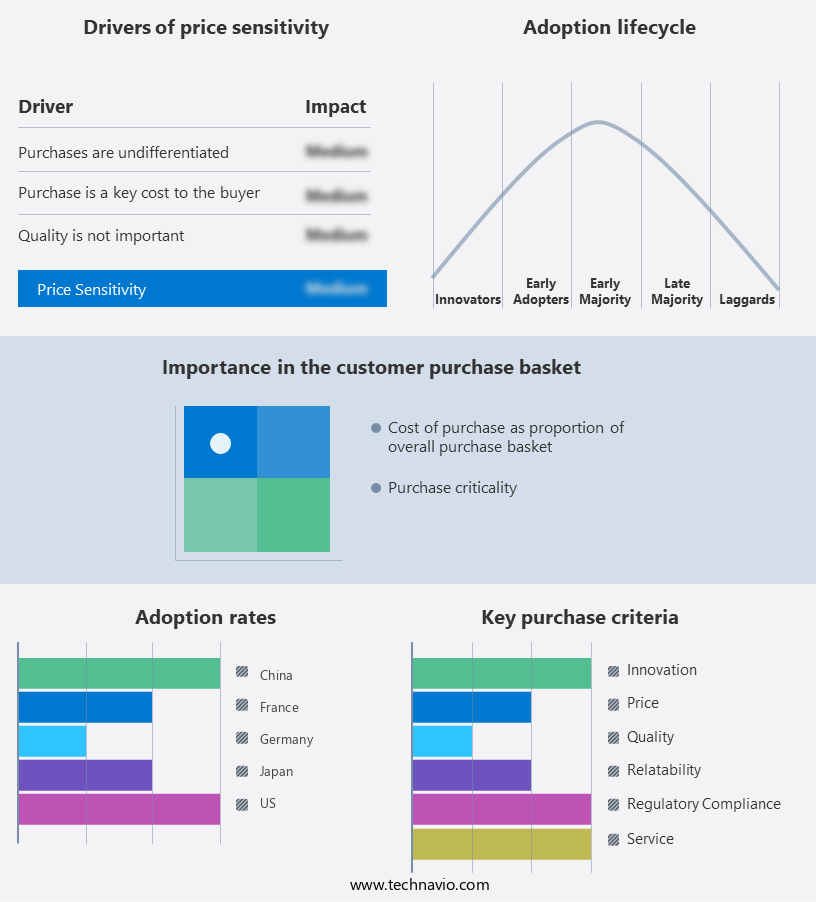
    The hydrogen generation market forecasting report includes the adoption lifecycle of the market, covering from the innovator’s stage to the laggard’s stage. It focuses on adoption rates in different regions based on penetration. Furthermore, the hydrogen generation market report also includes key purchase criteria and drivers of price sensitivity to help companies evaluate and develop their market growth analysis strategies.

    Hydrogen Generation Market Share by Geography

     Customer Landscape of Hydrogen Generation Industry

    Competitive Landscape

    Companies are implementing various strategies, such as strategic alliances, hydrogen generation market forecast, partnerships, mergers and acquisitions, geographical expansion, and product/service launches, to enhance their presence in the industry.

    Air Liquide - This company specializes in the development and distribution of innovative sports products, catering to various markets and consumer needs. Through rigorous research and analysis, I identify market trends, competitive landscapes, and emerging technologies to provide insightful recommendations for investors.

    The industry research and growth report includes detailed analyses of the competitive landscape of the market and information about key companies, including:

    • Air Liquide
    • Air Products and Chemicals
    • Ballard Power Systems
    • BASF SE
    • Chevron Corporation
    • Cummins Inc.
    • Engie
    • Hyundai Motor Company
    • ITM Power
    • Iwatani Corporation
    • Linde plc
    • McPhy Energy
    • Messer Group
    • Nel ASA
    • Nikola Corporation
    • Plug Power
    • Shell plc
    • Siemens Energy
    • thyssenkrupp
    • Uniper SE

    Qualitative and quantitative analysis of companies has been conducted to help clients understand the wider business environment as well as the strengths and weaknesses of key industry players. Data is qualitatively analyzed to categorize companies as pure play, category-focused, industry-focused, and diversified; it is quantitatively analyzed to categorize companies as dominant, leading, strong, tentative, and weak.

    Recent Development and News in Hydrogen Generation Market

    • In January 2024, Plug Power, a leading hydrogen fuel cell technology provider, announced a strategic partnership with South Korea's LG Energy Solution to develop and commercialize hydrogen fuel cell systems for material handling and stationary applications (Plug Power Press Release). This collaboration aimed to combine Plug Power's hydrogen fuel cell expertise with LG Energy Solution's battery manufacturing capabilities, targeting the growing demand for decarbonized solutions in various industries.
    • In March 2024, Nel Hydrogen, a global hydrogen technology company, secured a significant investment of USD250 million in a funding round led by Siemens Energy and Equinor (Nel Hydrogen Press Release). The investment was aimed at accelerating Nel Hydrogen's growth in the hydrogen market, expanding its production capacity, and strengthening its technology leadership.
    • In May 2024, Air Liquide, a global leader in gases, technologies, and services, received approval from the European Commission for its €1.5 billion investment in the Hydrogen European Industrial Initiative (Air Liquide Press Release). This initiative aimed to build a hydrogen value chain in Europe, from production to distribution and applications, contributing to the European Union's goal of becoming a global hydrogen leader by 2030.
    • In April 2025, Ballard Power Systems, a leading provider of hydrogen fuel cell technology, announced the deployment of its largest fuel cell system for a wastewater treatment plant in California, USA (Ballard Power Systems Press Release). The 200 kilowatt fuel cell system was designed to provide reliable and sustainable power, reducing greenhouse gas emissions and improving the plant's overall efficiency.

    Dive into Technavio’s robust research methodology, blending expert interviews, extensive data synthesis, and validated models for unparalleled Hydrogen Generation Market insights. See full methodology.

    Market Scope

    Report Coverage

    Details

    Page number

    179

    Base year

    2023

    Historic period

    2018-2022

    Forecast period

    2024-2028

    Growth momentum & CAGR

    Accelerate at a CAGR of 5.52%

    Market growth 2024-2028

    USD 49.7 billion

    Market structure

    Fragmented

    YoY growth 2023-2024(%)

    5.21

    Key countries

    US, Canada, Germany, UK, Italy, France, China, India, Japan, Brazil, Egypt, UAE, Oman, Argentina, KSA, UAE, Brazil, and Rest of World (ROW)

    Competitive landscape

    Leading Companies, Market Positioning of Companies, Competitive Strategies, and Industry Risks

    Request Free Sample

    Research Analyst Overview

    • The market continues to evolve, driven by the increasing demand for clean energy and the development of advanced technologies. One significant trend is the shift towards green hydrogen production through renewable energy sources, such as wind and solar power, which accounted for approximately 25% of global hydrogen production in 2020. For instance, power-to-gas systems that convert excess renewable energy into hydrogen through electrolysis have gained traction. Alkaline water electrolysis, a common method in such systems, is known for its efficiency and affordability. However, ensuring hydrogen purity levels of 99.999% is crucial for various applications, such as fuel cell technology and pipeline transportation.
    • An example of this trend is a European project that aims to produce green hydrogen using excess wind energy. This initiative is expected to reduce hydrogen production costs by up to 40% through the implementation of advanced electrolysis processes and energy storage solutions. The hydrogen infrastructure, including hydrogen refueling stations and transportation networks, is also expanding. Safety protocols, such as hydrogen embrittlement prevention and membrane degradation mitigation, are essential considerations in the design and operation of these systems. Moreover, the ongoing research and development in fuel cell technology, hydrogen infrastructure, and gas purification methods contribute to the market's continuous dynamism.
    • For instance, improvements in fuel cell durability and energy efficiency metrics have led to increased adoption in various sectors, including transportation and power generation. The hydrogen market is projected to grow at a robust rate, with industry experts estimating a 10% annual increase in demand over the next decade. This growth is driven by the increasing focus on reducing greenhouse gas emissions and the advancements in hydrogen production technologies. However, challenges remain, such as catalyst poisoning and the need for energy density calculations and compression systems to ensure efficient hydrogen storage and transportation. The ongoing research in photoelectrochemical water splitting, catalytic reforming, and solid oxide electrolysis is expected to address these challenges and further propel the market forward.
    • In conclusion, the market is characterized by continuous innovation and evolving trends, driven by the need for clean energy and the development of advanced technologies. From green hydrogen production and power-to-gas systems to fuel cell technology and hydrogen infrastructure, the market's dynamism is reflected in the ongoing research, advancements, and expansion in various sectors.

    What are the Key Data Covered in this Hydrogen Generation Market Research and Growth Report?

    • What is the expected growth of the Hydrogen Generation Market between 2024 and 2028?

      • USD 49.7 billion, at a CAGR of 5.52%

    • What segmentation does the market report cover?

      • The report is segmented by Delivery Mode (Merchant and Captive), Application (Chemical industry, Refinery industry, Metal processing industry, and Others), Geography (APAC, Europe, North America, Middle East and Africa, and South America), End-User (Industrial, Transportation, Energy, and Chemicals), and Type (Green Hydrogen, Blue Hydrogen, and Grey Hydrogen)

    • Which regions are analyzed in the report?

      • APAC, Europe, North America, Middle East and Africa, and South America

    • What are the key growth drivers and market challenges?

      • Growing demand for fertilizers, Changes in government policies and regulations

    • Who are the major players in the Hydrogen Generation Market?

      • Air Liquide, Air Products and Chemicals, Ballard Power Systems, BASF SE, Chevron Corporation, Cummins Inc., Engie, Hyundai Motor Company, ITM Power, Iwatani Corporation, Linde plc, McPhy Energy, Messer Group, Nel ASA, Nikola Corporation, Plug Power, Shell plc, Siemens Energy, thyssenkrupp, and Uniper SE

    Market Research Insights

    • The market is a dynamic and ever-evolving industry, with ongoing advancements in technology driving growth and innovation. Water electrolysis efficiency continues to improve, enabling larger hydrogen production capacities. For instance, a recent study demonstrated a 20% increase in efficiency through the optimization of system design and catalyst development. Furthermore, the industry anticipates a compound annual growth rate of 7% over the next decade, as hydrogen gains traction as a clean energy source. These advancements, however, come with challenges, such as system integration, reliability, and grid integration strategies. For example, high-pressure hydrogen systems require careful material compatibility considerations to ensure safety and longevity.
    • Additionally, hydrogen utilization in fuel cells necessitates precise hydrogen monitoring and leak detection to maintain optimal performance. As the market progresses, researchers focus on developing cost-effective electrolysis methods, optimizing process parameters, and exploring renewable hydrogen pathways. The integration of energy storage applications and hydrogen transportation methods further expands the market's potential. Despite these challenges, the market remains a promising sector for innovation and growth.

    We can help! Our analysts can customize this hydrogen generation market research report to meet your requirements.

    Get in touch

    1 Executive Summary

    • 1.1 Market overview
      • Executive Summary - Chart on Market Overview
      • Executive Summary - Data Table on Market Overview
      • Executive Summary - Chart on Global Market Characteristics
      • Executive Summary - Chart on Market by Geography
      • Executive Summary - Chart on Market Segmentation by Delivery Mode
      • Executive Summary - Chart on Market Segmentation by Application
      • Executive Summary - Chart on Incremental Growth
      • Executive Summary - Data Table on Incremental Growth
      • Executive Summary - Chart on Company Market Positioning

    2 Market Landscape

    • 2.1 Market ecosystem
      • Parent Market
      • Data Table on - Parent Market
    • 2.2 Market characteristics
      • Market characteristics analysis
    • 2.3 Value chain analysis
      • Value Chain Analysis

    3 Market Sizing

    • 3.1 Market definition
      • Offerings of companies included in the market definition
    • 3.2 Market segment analysis
      • Market segments
    • 3.3 Market size 2023
      • 3.4 Market outlook: Forecast for 2023-2028
        • Chart on Global - Market size and forecast 2023-2028 ($ billion)
        • Data Table on Global - Market size and forecast 2023-2028 ($ billion)
        • Chart on Global Market: Year-over-year growth 2023-2028 (%)
        • Data Table on Global Market: Year-over-year growth 2023-2028 (%)

      4 Historic Market Size

      • 4.1 Global Hydrogen Generation Market 2018 - 2022
        • Historic Market Size - Data Table on Global Hydrogen Generation Market 2018 - 2022 ($ billion)
      • 4.2 Delivery Mode segment analysis 2018 - 2022
        • Historic Market Size - Delivery Mode Segment 2018 - 2022 ($ billion)
      • 4.3 Application segment analysis 2018 - 2022
        • Historic Market Size - Application Segment 2018 - 2022 ($ billion)
      • 4.4 Geography segment analysis 2018 - 2022
        • Historic Market Size - Geography Segment 2018 - 2022 ($ billion)
      • 4.5 Country segment analysis 2018 - 2022
        • Historic Market Size - Country Segment 2018 - 2022 ($ billion)

      5 Five Forces Analysis

      • 5.1 Five forces summary
        • Five forces analysis - Comparison between 2023 and 2028
      • 5.2 Bargaining power of buyers
        • Bargaining power of buyers - Impact of key factors 2023 and 2028
      • 5.3 Bargaining power of suppliers
        • Bargaining power of suppliers - Impact of key factors in 2023 and 2028
      • 5.4 Threat of new entrants
        • Threat of new entrants - Impact of key factors in 2023 and 2028
      • 5.5 Threat of substitutes
        • Threat of substitutes - Impact of key factors in 2023 and 2028
      • 5.6 Threat of rivalry
        • Threat of rivalry - Impact of key factors in 2023 and 2028
      • 5.7 Market condition
        • Chart on Market condition - Five forces 2023 and 2028

      6 Market Segmentation by Delivery Mode

      • 6.1 Market segments
        • Chart on Delivery Mode - Market share (2023-2028) (%)
        • Data Table on Delivery Mode - Market share (2023-2028) (%)
      • 6.2 Comparison by Delivery Mode
        • Chart on Comparison by Delivery Mode
        • Data Table on Comparison by Delivery Mode
      • 6.3 Merchant - Market size and forecast (2023-2028)
        • Chart on Merchant - Market size and forecast (2023-2028) ($ billion)
        • Data Table on Merchant - Market size and forecast (2023-2028) ($ billion)
        • Chart on Merchant - Year-over-year growth (2023-2028) (%)
        • Data Table on Merchant - Year-over-year growth (2023-2028) (%)
      • 6.4 Captive - Market size and forecast (2023-2028)
        • Chart on Captive - Market size and forecast (2023-2028) ($ billion)
        • Data Table on Captive - Market size and forecast (2023-2028) ($ billion)
        • Chart on Captive - Year-over-year growth (2023-2028) (%)
        • Data Table on Captive - Year-over-year growth (2023-2028) (%)
      • 6.5 Market opportunity by Delivery Mode
        • Market opportunity by Delivery Mode ($ billion)
        • Data Table on Market opportunity by Delivery Mode ($ billion)

      7 Market Segmentation by Application

      • 7.1 Market segments
        • Chart on Application - Market share (2023-2028) (%)
        • Data Table on Application - Market share (2023-2028) (%)
      • 7.2 Comparison by Application
        • Chart on Comparison by Application
        • Data Table on Comparison by Application
      • 7.3 Chemical industry - Market size and forecast (2023-2028)
        • Chart on Chemical industry - Market size and forecast (2023-2028) ($ billion)
        • Data Table on Chemical industry - Market size and forecast (2023-2028) ($ billion)
        • Chart on Chemical industry - Year-over-year growth (2023-2028) (%)
        • Data Table on Chemical industry - Year-over-year growth (2023-2028) (%)
      • 7.4 Refinery industry - Market size and forecast (2023-2028)
        • Chart on Refinery industry - Market size and forecast (2023-2028) ($ billion)
        • Data Table on Refinery industry - Market size and forecast (2023-2028) ($ billion)
        • Chart on Refinery industry - Year-over-year growth (2023-2028) (%)
        • Data Table on Refinery industry - Year-over-year growth (2023-2028) (%)
      • 7.5 Metal processing industry - Market size and forecast (2023-2028)
        • Chart on Metal processing industry - Market size and forecast (2023-2028) ($ billion)
        • Data Table on Metal processing industry - Market size and forecast (2023-2028) ($ billion)
        • Chart on Metal processing industry - Year-over-year growth (2023-2028) (%)
        • Data Table on Metal processing industry - Year-over-year growth (2023-2028) (%)
      • 7.6 Others - Market size and forecast (2023-2028)
        • Chart on Others - Market size and forecast (2023-2028) ($ billion)
        • Data Table on Others - Market size and forecast (2023-2028) ($ billion)
        • Chart on Others - Year-over-year growth (2023-2028) (%)
        • Data Table on Others - Year-over-year growth (2023-2028) (%)
      • 7.7 Market opportunity by Application
        • Market opportunity by Application ($ billion)
        • Data Table on Market opportunity by Application ($ billion)

      8 Market Segmentation by End-User

      • 8.1 Market segments
        • Chart on End-User - Market share (2023-2028) (%)
        • Data Table on End-User - Market share (2023-2028) (%)
      • 8.2 Comparison by End-User
        • Chart on Comparison by End-User
        • Data Table on Comparison by End-User
      • 8.3 Industrial - Market size and forecast (2023-2028)
        • Chart on Industrial - Market size and forecast (2023-2028) ($ billion)
        • Data Table on Industrial - Market size and forecast (2023-2028) ($ billion)
        • Chart on Industrial - Year-over-year growth (2023-2028) (%)
        • Data Table on Industrial - Year-over-year growth (2023-2028) (%)
      • 8.4 Transportation - Market size and forecast (2023-2028)
        • Chart on Transportation - Market size and forecast (2023-2028) ($ billion)
        • Data Table on Transportation - Market size and forecast (2023-2028) ($ billion)
        • Chart on Transportation - Year-over-year growth (2023-2028) (%)
        • Data Table on Transportation - Year-over-year growth (2023-2028) (%)
      • 8.5 Energy - Market size and forecast (2023-2028)
        • Chart on Energy - Market size and forecast (2023-2028) ($ billion)
        • Data Table on Energy - Market size and forecast (2023-2028) ($ billion)
        • Chart on Energy - Year-over-year growth (2023-2028) (%)
        • Data Table on Energy - Year-over-year growth (2023-2028) (%)
      • 8.6 Chemicals - Market size and forecast (2023-2028)
        • Chart on Chemicals - Market size and forecast (2023-2028) ($ billion)
        • Data Table on Chemicals - Market size and forecast (2023-2028) ($ billion)
        • Chart on Chemicals - Year-over-year growth (2023-2028) (%)
        • Data Table on Chemicals - Year-over-year growth (2023-2028) (%)
      • 8.7 Market opportunity by End-User
        • Market opportunity by End-User ($ billion)
        • Data Table on Market opportunity by End-User ($ billion)

      9 Market Segmentation by Type

      • 9.1 Market segments
        • Chart on Type - Market share (2023-2028) (%)
        • Data Table on Type - Market share (2023-2028) (%)
      • 9.2 Comparison by Type
        • Chart on Comparison by Type
        • Data Table on Comparison by Type
      • 9.3 Green Hydrogen - Market size and forecast (2023-2028)
        • Chart on Green Hydrogen - Market size and forecast (2023-2028) ($ billion)
        • Data Table on Green Hydrogen - Market size and forecast (2023-2028) ($ billion)
        • Chart on Green Hydrogen - Year-over-year growth (2023-2028) (%)
        • Data Table on Green Hydrogen - Year-over-year growth (2023-2028) (%)
      • 9.4 Blue Hydrogen - Market size and forecast (2023-2028)
        • Chart on Blue Hydrogen - Market size and forecast (2023-2028) ($ billion)
        • Data Table on Blue Hydrogen - Market size and forecast (2023-2028) ($ billion)
        • Chart on Blue Hydrogen - Year-over-year growth (2023-2028) (%)
        • Data Table on Blue Hydrogen - Year-over-year growth (2023-2028) (%)
      • 9.5 Grey Hydrogen - Market size and forecast (2023-2028)
        • Chart on Grey Hydrogen - Market size and forecast (2023-2028) ($ billion)
        • Data Table on Grey Hydrogen - Market size and forecast (2023-2028) ($ billion)
        • Chart on Grey Hydrogen - Year-over-year growth (2023-2028) (%)
        • Data Table on Grey Hydrogen - Year-over-year growth (2023-2028) (%)
      • 9.6 Market opportunity by Type
        • Market opportunity by Type ($ billion)
        • Data Table on Market opportunity by Type ($ billion)

      10 Customer Landscape

      • 10.1 Customer landscape overview
        • Analysis of price sensitivity, lifecycle, customer purchase basket, adoption rates, and purchase criteria

      11 Geographic Landscape

      • 11.1 Geographic segmentation
        • Chart on Market share by geography 2023-2028 (%)
        • Data Table on Market share by geography 2023-2028 (%)
      • 11.2 Geographic comparison
        • Chart on Geographic comparison
        • Data Table on Geographic comparison
      • 11.3 APAC - Market size and forecast 2023-2028
        • Chart on APAC - Market size and forecast 2023-2028 ($ billion)
        • Data Table on APAC - Market size and forecast 2023-2028 ($ billion)
        • Chart on APAC - Year-over-year growth 2023-2028 (%)
        • Data Table on APAC - Year-over-year growth 2023-2028 (%)
      • 11.4 Europe - Market size and forecast 2023-2028
        • Chart on Europe - Market size and forecast 2023-2028 ($ billion)
        • Data Table on Europe - Market size and forecast 2023-2028 ($ billion)
        • Chart on Europe - Year-over-year growth 2023-2028 (%)
        • Data Table on Europe - Year-over-year growth 2023-2028 (%)
      • 11.5 North America - Market size and forecast 2023-2028
        • Chart on North America - Market size and forecast 2023-2028 ($ billion)
        • Data Table on North America - Market size and forecast 2023-2028 ($ billion)
        • Chart on North America - Year-over-year growth 2023-2028 (%)
        • Data Table on North America - Year-over-year growth 2023-2028 (%)
      • 11.6 Middle East and Africa - Market size and forecast 2023-2028
        • Chart on Middle East and Africa - Market size and forecast 2023-2028 ($ billion)
        • Data Table on Middle East and Africa - Market size and forecast 2023-2028 ($ billion)
        • Chart on Middle East and Africa - Year-over-year growth 2023-2028 (%)
        • Data Table on Middle East and Africa - Year-over-year growth 2023-2028 (%)
      • 11.7 South America - Market size and forecast 2023-2028
        • Chart on South America - Market size and forecast 2023-2028 ($ billion)
        • Data Table on South America - Market size and forecast 2023-2028 ($ billion)
        • Chart on South America - Year-over-year growth 2023-2028 (%)
        • Data Table on South America - Year-over-year growth 2023-2028 (%)
      • 11.8 China - Market size and forecast 2023-2028
        • Chart on China - Market size and forecast 2023-2028 ($ billion)
        • Data Table on China - Market size and forecast 2023-2028 ($ billion)
        • Chart on China - Year-over-year growth 2023-2028 (%)
        • Data Table on China - Year-over-year growth 2023-2028 (%)
      • 11.9 US - Market size and forecast 2023-2028
        • Chart on US - Market size and forecast 2023-2028 ($ billion)
        • Data Table on US - Market size and forecast 2023-2028 ($ billion)
        • Chart on US - Year-over-year growth 2023-2028 (%)
        • Data Table on US - Year-over-year growth 2023-2028 (%)
      • 11.10 Japan - Market size and forecast 2023-2028
        • Chart on Japan - Market size and forecast 2023-2028 ($ billion)
        • Data Table on Japan - Market size and forecast 2023-2028 ($ billion)
        • Chart on Japan - Year-over-year growth 2023-2028 (%)
        • Data Table on Japan - Year-over-year growth 2023-2028 (%)
      • 11.11 Germany - Market size and forecast 2023-2028
        • Chart on Germany - Market size and forecast 2023-2028 ($ billion)
        • Data Table on Germany - Market size and forecast 2023-2028 ($ billion)
        • Chart on Germany - Year-over-year growth 2023-2028 (%)
        • Data Table on Germany - Year-over-year growth 2023-2028 (%)
      • 11.12 France - Market size and forecast 2023-2028
        • Chart on France - Market size and forecast 2023-2028 ($ billion)
        • Data Table on France - Market size and forecast 2023-2028 ($ billion)
        • Chart on France - Year-over-year growth 2023-2028 (%)
        • Data Table on France - Year-over-year growth 2023-2028 (%)
      • 11.13 Market opportunity by geography
        • Market opportunity by geography ($ billion)
        • Data Tables on Market opportunity by geography ($ billion)
      • 11.14 Canada - Market size and forecast (2023-2028)
        • Chart on Canada - Market size and forecast (2023-2028) ($ billion)
        • Data Table on Canada - Market size and forecast (2023-2028) ($ billion)
        • Chart on Canada - Year-over-year growth (2023-2028) (%)
        • Data Table on Canada - Year-over-year growth (2023-2028) (%)
      • 11.15 UK - Market size and forecast (2023-2028)
        • Chart on UK - Market size and forecast (2023-2028) ($ billion)
        • Data Table on UK - Market size and forecast (2023-2028) ($ billion)
        • Chart on UK - Year-over-year growth (2023-2028) (%)
        • Data Table on UK - Year-over-year growth (2023-2028) (%)
      • 11.16 Italy - Market size and forecast (2023-2028)
        • Chart on Italy - Market size and forecast (2023-2028) ($ billion)
        • Data Table on Italy - Market size and forecast (2023-2028) ($ billion)
        • Chart on Italy - Year-over-year growth (2023-2028) (%)
        • Data Table on Italy - Year-over-year growth (2023-2028) (%)
      • 11.17 India - Market size and forecast (2023-2028)
        • Chart on India - Market size and forecast (2023-2028) ($ billion)
        • Data Table on India - Market size and forecast (2023-2028) ($ billion)
        • Chart on India - Year-over-year growth (2023-2028) (%)
        • Data Table on India - Year-over-year growth (2023-2028) (%)
      • 11.18 Brazil - Market size and forecast (2023-2028)
        • Chart on Brazil - Market size and forecast (2023-2028) ($ billion)
        • Data Table on Brazil - Market size and forecast (2023-2028) ($ billion)
        • Chart on Brazil - Year-over-year growth (2023-2028) (%)
        • Data Table on Brazil - Year-over-year growth (2023-2028) (%)
      • 11.19 Egypt - Market size and forecast (2023-2028)
        • Chart on Egypt - Market size and forecast (2023-2028) ($ billion)
        • Data Table on Egypt - Market size and forecast (2023-2028) ($ billion)
        • Chart on Egypt - Year-over-year growth (2023-2028) (%)
        • Data Table on Egypt - Year-over-year growth (2023-2028) (%)
      • 11.20 UAE - Market size and forecast (2023-2028)
        • Chart on UAE - Market size and forecast (2023-2028) ($ billion)
        • Data Table on UAE - Market size and forecast (2023-2028) ($ billion)
        • Chart on UAE - Year-over-year growth (2023-2028) (%)
        • Data Table on UAE - Year-over-year growth (2023-2028) (%)
      • 11.21 Oman - Market size and forecast (2023-2028)
        • Chart on Oman - Market size and forecast (2023-2028) ($ billion)
        • Data Table on Oman - Market size and forecast (2023-2028) ($ billion)
        • Chart on Oman - Year-over-year growth (2023-2028) (%)
        • Data Table on Oman - Year-over-year growth (2023-2028) (%)
      • 11.22 Argentina - Market size and forecast (2023-2028)
        • Chart on Argentina - Market size and forecast (2023-2028) ($ billion)
        • Data Table on Argentina - Market size and forecast (2023-2028) ($ billion)
        • Chart on Argentina - Year-over-year growth (2023-2028) (%)
        • Data Table on Argentina - Year-over-year growth (2023-2028) (%)
      • 11.23 KSA - Market size and forecast (2023-2028)
        • Chart on KSA - Market size and forecast (2023-2028) ($ billion)
        • Data Table on KSA - Market size and forecast (2023-2028) ($ billion)
        • Chart on KSA - Year-over-year growth (2023-2028) (%)
        • Data Table on KSA - Year-over-year growth (2023-2028) (%)
      • 11.24 UAE - Market size and forecast (2023-2028)
        • Chart on UAE - Market size and forecast (2023-2028) ($ billion)
        • Data Table on UAE - Market size and forecast (2023-2028) ($ billion)
        • Chart on UAE - Year-over-year growth (2023-2028) (%)
        • Data Table on UAE - Year-over-year growth (2023-2028) (%)
      • 11.25 Brazil - Market size and forecast (2023-2028)
        • Chart on Brazil - Market size and forecast (2023-2028) ($ billion)
        • Data Table on Brazil - Market size and forecast (2023-2028) ($ billion)
        • Chart on Brazil - Year-over-year growth (2023-2028) (%)
        • Data Table on Brazil - Year-over-year growth (2023-2028) (%)
      • 11.26 Rest of World (ROW) - Market size and forecast (2023-2028)
        • Chart on Rest of World (ROW) - Market size and forecast (2023-2028) ($ billion)
        • Data Table on Rest of World (ROW) - Market size and forecast (2023-2028) ($ billion)
        • Chart on Rest of World (ROW) - Year-over-year growth (2023-2028) (%)
        • Data Table on Rest of World (ROW) - Year-over-year growth (2023-2028) (%)

      12 Drivers, Challenges, and Opportunity/Restraints

      • 12.1 Market drivers
        • 12.2 Market challenges
          • 12.3 Impact of drivers and challenges
            • Impact of drivers and challenges in 2023 and 2028
          • 12.4 Market opportunities/restraints

            13 Competitive Landscape

            • 13.1 Overview
              • 13.2 Competitive Landscape
                • Overview on criticality of inputs and factors of differentiation
              • 13.3 Landscape disruption
                • Overview on factors of disruption
              • 13.4 Industry risks
                • Impact of key risks on business

              14 Competitive Analysis

              • 14.1 Companies profiled
                • Companies covered
              • 14.2 Market positioning of companies
                • Matrix on companies position and classification
              • 14.3 Air Liquide
                • Air Liquide - Overview
                • Air Liquide - Product / Service
                • Air Liquide - Key offerings
              • 14.4 Air Products and Chemicals
                • Air Products and Chemicals - Overview
                • Air Products and Chemicals - Product / Service
                • Air Products and Chemicals - Key offerings
              • 14.5 Ballard Power Systems
                • Ballard Power Systems - Overview
                • Ballard Power Systems - Product / Service
                • Ballard Power Systems - Key offerings
              • 14.6 BASF SE
                • BASF SE - Overview
                • BASF SE - Product / Service
                • BASF SE - Key offerings
              • 14.7 Chevron Corporation
                • Chevron Corporation - Overview
                • Chevron Corporation - Product / Service
                • Chevron Corporation - Key offerings
              • 14.8 Cummins Inc.
                • Cummins Inc. - Overview
                • Cummins Inc. - Product / Service
                • Cummins Inc. - Key offerings
              • 14.9 Engie
                • Engie - Overview
                • Engie - Product / Service
                • Engie - Key offerings
              • 14.10 Hyundai Motor Company
                • Hyundai Motor Company - Overview
                • Hyundai Motor Company - Product / Service
                • Hyundai Motor Company - Key offerings
              • 14.11 ITM Power
                • ITM Power - Overview
                • ITM Power - Product / Service
                • ITM Power - Key offerings
              • 14.12 Iwatani Corporation
                • Iwatani Corporation - Overview
                • Iwatani Corporation - Product / Service
                • Iwatani Corporation - Key offerings
              • 14.13 Linde plc
                • Linde plc - Overview
                • Linde plc - Product / Service
                • Linde plc - Key offerings
              • 14.14 McPhy Energy
                • McPhy Energy - Overview
                • McPhy Energy - Product / Service
                • McPhy Energy - Key offerings
              • 14.15 Messer Group
                • Messer Group - Overview
                • Messer Group - Product / Service
                • Messer Group - Key offerings
              • 14.16 Nel ASA
                • Nel ASA - Overview
                • Nel ASA - Product / Service
                • Nel ASA - Key offerings
              • 14.17 Nikola Corporation
                • Nikola Corporation - Overview
                • Nikola Corporation - Product / Service
                • Nikola Corporation - Key offerings
              • 14.18 Plug Power
                • Plug Power - Overview
                • Plug Power - Product / Service
                • Plug Power - Key offerings
              • 14.19 Shell plc
                • Shell plc - Overview
                • Shell plc - Product / Service
                • Shell plc - Key offerings
              • 14.20 Siemens Energy
                • Siemens Energy - Overview
                • Siemens Energy - Product / Service
                • Siemens Energy - Key offerings
              • 14.21 thyssenkrupp
                • thyssenkrupp - Overview
                • thyssenkrupp - Product / Service
                • thyssenkrupp - Key offerings
              • 14.22 Uniper SE
                • Uniper SE - Overview
                • Uniper SE - Product / Service
                • Uniper SE - Key offerings
              • 14.23 Air Liquide SA
                • Air Liquide SA - Overview
                • Air Liquide SA - Product / Service
                • Air Liquide SA - Key offerings
              • 14.24 Air Products and Chemicals Inc.
                • Air Products and Chemicals Inc. - Overview
                • Air Products and Chemicals Inc. - Product / Service
                • Air Products and Chemicals Inc. - Key offerings
              • 14.25 Claind Srl
                • Claind Srl - Overview
                • Claind Srl - Product / Service
                • Claind Srl - Key offerings
              • 14.26 Cummins Inc.
                • Cummins Inc. - Overview
                • Cummins Inc. - Product / Service
                • Cummins Inc. - Key offerings
              • 14.27 FuelCell Energy Inc.
                • FuelCell Energy Inc. - Overview
                • FuelCell Energy Inc. - Product / Service
                • FuelCell Energy Inc. - Key offerings
              • 14.28 Green Hydrogen Systems
                • Green Hydrogen Systems - Overview
                • Green Hydrogen Systems - Product / Service
                • Green Hydrogen Systems - Key offerings
              • 14.29 Hiringa Energy Ltd.
                • Hiringa Energy Ltd. - Overview
                • Hiringa Energy Ltd. - Product / Service
                • Hiringa Energy Ltd. - Key offerings
              • 14.30 Hyster Yale Materials Handling Inc.
                • Hyster Yale Materials Handling Inc. - Overview
                • Hyster Yale Materials Handling Inc. - Product / Service
                • Hyster Yale Materials Handling Inc. - Key offerings
              • 14.31 ITM Power PLC
                • ITM Power PLC - Overview
                • ITM Power PLC - Product / Service
                • ITM Power PLC - Key offerings
              • 14.32 Iwatani Corp.
                • Iwatani Corp. - Overview
                • Iwatani Corp. - Product / Service
                • Iwatani Corp. - Key offerings
              • 14.33 Linde Plc
                • Linde Plc - Overview
                • Linde Plc - Product / Service
                • Linde Plc - Key offerings
              • 14.34 Mahler AGS GmbH
                • Mahler AGS GmbH - Overview
                • Mahler AGS GmbH - Product / Service
                • Mahler AGS GmbH - Key offerings
              • 14.35 McPhy Energy SA
                • McPhy Energy SA - Overview
                • McPhy Energy SA - Product / Service
                • McPhy Energy SA - Key offerings
              • 14.36 Messer SE and Co. KGaA
                • Messer SE and Co. KGaA - Overview
                • Messer SE and Co. KGaA - Product / Service
                • Messer SE and Co. KGaA - Key offerings
              • 14.37 Mitsubishi Chemical Group Corp.
                • Mitsubishi Chemical Group Corp. - Overview
                • Mitsubishi Chemical Group Corp. - Product / Service
                • Mitsubishi Chemical Group Corp. - Key offerings
              • 14.38 Nel ASA
                • Nel ASA - Overview
                • Nel ASA - Product / Service
                • Nel ASA - Key offerings
              • 14.39 Parker Hannifin Corp.
                • Parker Hannifin Corp. - Overview
                • Parker Hannifin Corp. - Product / Service
                • Parker Hannifin Corp. - Key offerings
              • 14.40 Resonac Holdings Corp.
                • Resonac Holdings Corp. - Overview
                • Resonac Holdings Corp. - Product / Service
                • Resonac Holdings Corp. - Key offerings
              • 14.41 Teledyne Technologies Inc.
                • Teledyne Technologies Inc. - Overview
                • Teledyne Technologies Inc. - Product / Service
                • Teledyne Technologies Inc. - Key offerings
              • 14.42 Xebec Adsorption Inc.
                • Xebec Adsorption Inc. - Overview
                • Xebec Adsorption Inc. - Product / Service
                • Xebec Adsorption Inc. - Key offerings

              15 Appendix

              • 15.1 Scope of the report
                • 15.2 Inclusions and exclusions checklist
                  • Inclusions checklist
                  • Exclusions checklist
                • 15.3 Currency conversion rates for US$
                  • Currency conversion rates for US$
                • 15.4 Research methodology
                  • Research methodology
                • 15.5 Data procurement
                  • Information sources
                • 15.6 Data validation
                  • Data validation
                • 15.7 Validation techniques employed for market sizing
                  • Validation techniques employed for market sizing
                • 15.8 Data synthesis
                  • Data synthesis
                • 15.9 360 degree market analysis
                  • 360 degree market analysis
                • 15.10 List of abbreviations
                  • List of abbreviations

                Research Methodology

                Technavio presents a detailed picture of the market by way of study, synthesis, and summation of data from multiple sources. The analysts have presented the various facets of the market with a particular focus on identifying the key industry influencers. The data thus presented is comprehensive, reliable, and the result of extensive research, both primary and secondary.

                INFORMATION SOURCES

                Primary sources

                • Manufacturers and suppliers
                • Channel partners
                • Industry experts
                • Strategic decision makers

                Secondary sources

                • Industry journals and periodicals
                • Government data
                • Financial reports of key industry players
                • Historical data
                • Press releases

                DATA ANALYSIS

                Data Synthesis

                • Collation of data
                • Estimation of key figures
                • Analysis of derived insights

                Data Validation

                • Triangulation with data models
                • Reference against proprietary databases
                • Corroboration with industry experts

                REPORT WRITING

                Qualitative

                • Market drivers
                • Market challenges
                • Market trends
                • Five forces analysis

                Quantitative

                • Market size and forecast
                • Market segmentation
                • Geographical insights
                • Competitive landscape

                Interested in this report?

                Get your sample now to see our research methodology and insights!

                Download Now

                Frequently Asked Questions

                Hydrogen Generation market growth will increase by $ 49.7 bn during 2024-2028 .

                The Hydrogen Generation market is expected to grow at a CAGR of 5.52% during 2024-2028 .

                Hydrogen Generation market is segmented by Delivery Mode( Merchant, Captive, Metal processing industry, Others) Application( Chemical industry, Refinery industry, Metal processing industry, Others)

                Air Liquide, Air Products and Chemicals, Ballard Power Systems, BASF SE, Chevron Corporation, Cummins Inc., Engie, Hyundai Motor Company, ITM Power, Iwatani Corporation, Linde plc, McPhy Energy, Messer Group, Nel ASA, Nikola Corporation, Plug Power, Shell plc, Siemens Energy, thyssenkrupp, Uniper SE are a few of the key vendors in the Hydrogen Generation market.

                APAC will register the highest growth rate of 55% among the other regions. Therefore, the Hydrogen Generation market in APAC is expected to garner significant business opportunities for the vendors during the forecast period.

                US, Canada, Germany, UK, Italy, France, China, India, Japan, Brazil, Egypt, UAE, Oman, Argentina, KSA, UAE, Brazil, Rest of World (ROW)

                • Growing demand for fertilizersWith the rise in population is the driving factor this market.
                • the demand for food is also expected to follow suit. By 2025 is the driving factor this market.
                • the demand for food is expected to double. Intensive farming and protective cropping methods would be required to meet this growing demand; however is the driving factor this market.
                • environmental fluctuations can have a negative impact on most agricultural systems. Less than a billion people still live under persistent hunger conditions. For the management of nutrition among the global population is the driving factor this market.
                • there will be a continuous increment in agricultural production.For increasing agricultural production is the driving factor this market.
                • the best fertilizer management practices will be required. For fertilizer management is the driving factor this market.
                • nitrogen fertilizers will be used. Ammonia is one of the major components used in nitrogen fertilizers is the driving factor this market.
                • with ammonium nitrate being the preferred form. With 30% of production and 45% of CO2 emissions is the driving factor this market.
                • China is the world's largest producer of ammonia. The US is the driving factor this market.
                • the EU is the driving factor this market.
                • India is the driving factor this market.
                • Russia is the driving factor this market.
                • and the Middle East contribute another 8–10% of the production. China currently accounts for more than nine-tenths of the global ammonia capacity is the driving factor this market.
                • which is based on coal feedstock. In the US is the driving factor this market.
                • there has been a large number of new capacity addition announcements is the driving factor this market.
                • leading to the cheap availability of shale gas.In the manufacturing process of ammonia is the driving factor this market.
                • the synthesis is carried out by a catalytic reaction that requires high volumes of hydrogen. This hydrogen needed is recovered from natural gas. A typical ammonia plant has the capacity to produce between 1 is the driving factor this market.
                • 000 and 2 is the driving factor this market.
                • 000 tons/day of ammonia. Typically is the driving factor this market.
                • 0.20 tons of hydrogen feedstock would be required per day to produce 1 ton of ammonia. With the rising global population is the driving factor this market.
                • there will be a huge demand for agricultural products is the driving factor this market.
                • leading to the requirement for better fertilization management systems. This will increase the demand for ammonia to manufacture these systems is the driving factor this market.
                • thereby driving the growth of the global hydrogen generation market. is the driving factor this market.

                The Hydrogen Generation market vendors should focus on grabbing business opportunities from the Merchant segment as it accounted for the largest market share in the base year.