
Headwear Market Size 2025-2029
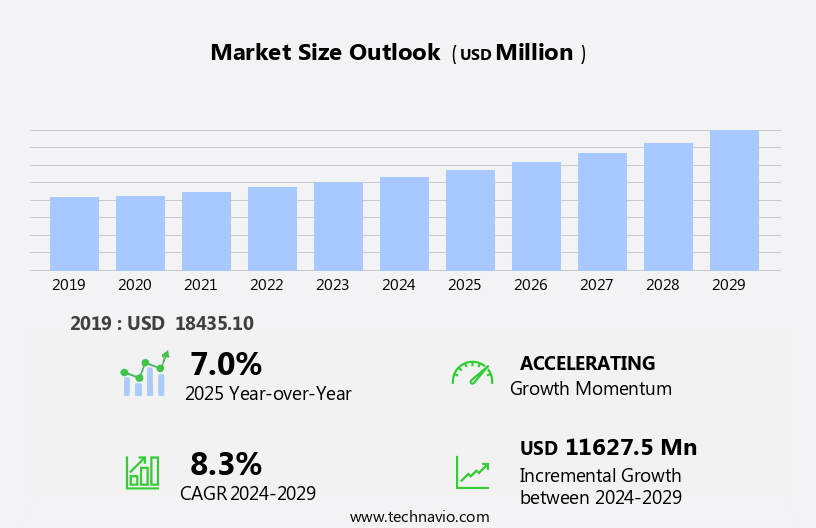
The headwear market size is forecast to increase by USD 11.63 billion, at a CAGR of 8.3% between 2024 and 2029.
- The market is experiencing significant growth, driven by the increasing fashion consciousness and desire to enhance personal style. A notable trend in this market is the rise of athleisure and sports-inspired headwear, which caters to consumers seeking comfort and functionality in their daily lives. Moreover, Smart helmets, incorporating technology for safety and convenience, represent an emerging trend. However, this market faces challenges as well. The proliferation of counterfeit products poses a significant threat, requiring brands to prioritize product authentication and consumer education. Brands must navigate these challenges while capitalizing on the trend towards stylish and versatile headwear to remain competitive in the market.
- Companies seeking to succeed in this dynamic landscape should focus on offering authentic, high-quality products that cater to evolving consumer preferences. Additionally, implementing robust anti-counterfeit measures and effective marketing strategies will be essential for long-term growth and success.
What will be the Size of the Headwear Market during the forecast period?
Explore in-depth regional segment analysis with market size data - historical 2019-2023 and forecasts 2025-2029 - in the full report.
Request Free Sample
The market continues to evolve, with dynamic market dynamics shaping its various sectors. UV protection remains a key consideration, as consumers seek headgear that shields them from the sun's harmful rays. Price point is another critical factor, with demand spanning across diverse segments, from affordable baseball caps to high-end Panama hats and fedoras. Branding strategies play a significant role in the market, with companies leveraging social media marketing and influencer partnerships to reach their target audience. Product development is ongoing, with innovations in materials, such as water resistance and breathability, driving consumer interest. Seasonal demand also influences market activities, with winter hats and ushanka hats in high demand during colder months, while sun hats and bucket hats are popular during warmer seasons.
Safety standards are paramount in industrial headwear and protective gear, with rigorous product testing and inventory management ensuring quality control. Fashion trends continue to impact the market, with flat caps and cowboy hats experiencing resurgences in popularity. Ethical sourcing and sustainable material sourcing are increasingly important to consumers, driving changes in the supply chain and manufacturing processes. Price optimization and sales forecasting are essential tools for retailers, helping them manage inventory and adapt to shifting consumer behavior and customer segmentation. The market's continuous evolution reflects the ongoing unfolding of market activities and evolving patterns.
How is this Headwear Industry segmented?
The headwear industry research report provides comprehensive data (region-wise segment analysis), with forecasts and estimates in "USD million" for the period 2025-2029, as well as historical data from 2019-2023 for the following segments.
- Distribution Channel
- Offline
- Online
- Product Type
- Caps and hats
- Beanies
- Others
- End-user
- Fashion and casual wear
- Sports and athletics
- Protective gear
- Others
- Material
- Synthetic materials
- Cotton
- Wool
- Others
- Geography
- North America
- US
- Canada
- Europe
- France
- Germany
- UK
- APAC
- Australia
- China
- India
- Japan
- South Korea
- Rest of World (ROW)
- North America
By Distribution Channel Insights
The offline segment is estimated to witness significant growth during the forecast period.
The market encompasses various types, including sports headwear, military headwear, fashion headwear, and industrial headwear. The supply chain involves headwear manufacturing, ethical sourcing of materials, and quality control. Safety standards are crucial in producing protective headgear such as hard hats and helmet liners. Fashion trends influence consumer behavior, leading to the popularity of items like knit hats, beanies, and bucket hats. Retail channels include specialty stores, departmental stores, and online sales. Specialty stores offer a broad selection of brands and products, while department stores differentiate themselves through exclusive designer collections and private-label brands. Sports headwear, such as baseball caps and visors, cater to athletes and fitness enthusiasts.
Fashion headwear, like bonnie hats and fedora hats, add style and personality to outfits. Military headwear, including ushanka hats and boonie hats, serve practical purposes for various branches. Industrial headwear, including hard hats and helmet liners, ensure safety in hazardous work environments. Product development, price optimization, and sales forecasting are essential aspects of the market. Consumer behavior and customer segmentation influence trends and demand. Seasonal demand for winter hats and sun hats affects sales patterns. Influencer marketing and social media marketing are effective strategies for reaching target audiences. Branding strategy plays a significant role in the market, with companies focusing on product lifecycle, quality control, and material sourcing to maintain a competitive edge.
Protective headgear, like hard hats and helmet liners, prioritize safety and durability, while fashion headwear emphasizes style and comfort. The market continues to evolve, catering to diverse customer needs and preferences.
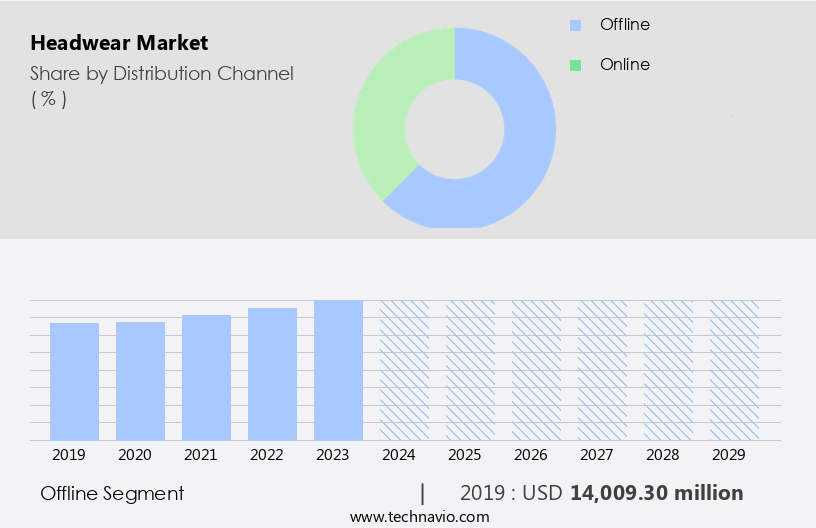
The Offline segment was valued at USD 14.01 billion in 2019 and showed a gradual increase during the forecast period.
Regional Analysis
APAC is estimated to contribute 45% to the growth of the global market during the forecast period.Technavio's analysts have elaborately explained the regional trends and drivers that shape the market during the forecast period.
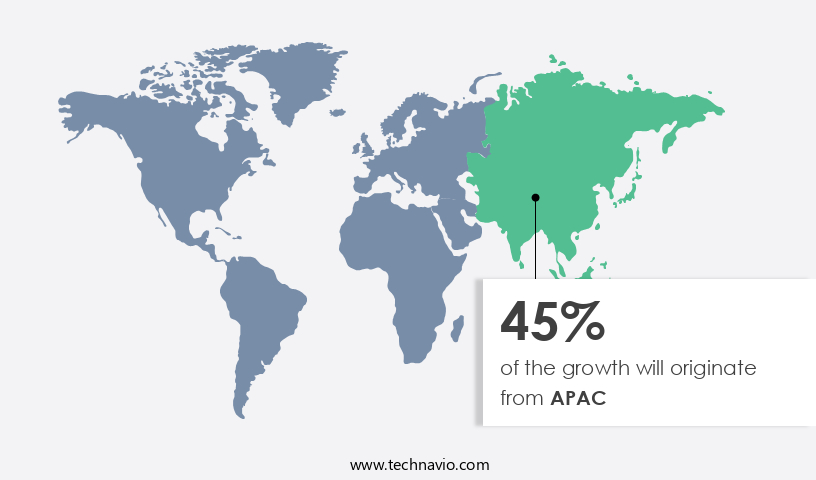
The APAC market is experiencing substantial growth, driven by a large population, increasing disposable income, evolving fashion trends, and heightened sun protection consciousness. Outdoor activities, sports, and tourism are also contributing to market expansion in the region. China, Japan, South Korea, and India are significant headwear manufacturing hubs in APAC. Fashion trends are dynamic, with bold statements emerging at events like the Sydney Spring Racing Carnival, featuring structured hats, vibrant colors, and strong silhouettes. Headwear manufacturers prioritize product development, price optimization, and ethical sourcing to cater to diverse consumer segments. Retail channels, including online sales, are increasingly popular, while inventory management and social media marketing are essential strategies for businesses.
Seasonal demand for winter hats, ushanka hats, and summer sun hats influences sales forecasting. Protective headgear, including hard hats and helmet liners, is a growing segment, catering to industrial and military markets. Brands employ branding strategies, product lifecycle management, and quality control to differentiate themselves. Knit hats, baseball caps, and fashion headwear, including Panama hats, fedora hats, and bucket hats, continue to be popular. Water resistance and uv protection are key features for many consumers, influencing price points and product testing.
Market Dynamics
Our researchers analyzed the data with 2024 as the base year, along with the key drivers, trends, and challenges. A holistic analysis of drivers will help companies refine their marketing strategies to gain a competitive advantage.
The market encompasses a diverse range of products designed to protect, enhance, and complement various styles and lifestyles. From baseball caps and beanies to berets and turbans, this market caters to diverse consumer preferences. Functional headwear includes sun hats, winter beanie caps, and sports headbands, addressing specific needs like sun protection, warmth, and moisture management. Fashion-forward options include designer hats, bandanas, and bucket hats, reflecting current trends and personal expressions. Sustainable materials, such as organic cotton and recycled polyester, are increasingly popular, appealing to eco-conscious consumers. Headwear also offers customization opportunities, allowing consumers to personalize their look with logos, slogans, or monograms. Overall, the market is a dynamic and expansive industry, catering to both practical and aesthetic demands.
What are the key market drivers leading to the rise in the adoption of Headwear Industry?
- The growing trend towards enhancing personal style and fashion consciousness serves as the primary market driver.
- The market is driven by consumer preferences for stylish and innovative headwear. With the growing emphasis on personal expression and fashion, consumers seek headwear that complements their unique styles. Beyond practicality, consumers are drawn to headwear with distinctive designs and features, such as knit hats with water resistance or sun hats with wide brims. Product testing and consumer behavior analysis play a crucial role in identifying customer segments and their preferences. Influencer marketing is another key trend, as influencers help shape consumer trends and preferences.
- Seasonal demand for headwear varies, with sales forecasting essential for ensuring inventory levels meet consumer needs. Headwear types, such as top hats and sun hats, cater to diverse consumer segments and preferences. Overall, the market is dynamic and evolving, requiring businesses to stay attuned to consumer trends and preferences.
What are the market trends shaping the Headwear Industry?
- The market trend increasingly favors athleisure and sports-inspired headwear. This category, which blends fashion and functionality, is poised for significant growth.
- The market is experiencing growth due to the rising demand for functional and fashionable headwear. Consumers are seeking headgear that provides UV protection and enhances their active lifestyles. Performance-oriented materials, such as those that wick away moisture, are in high demand. Headwear with adjustable closures caters to various head sizes, ensuring a comfortable fit. UV protection is a crucial factor in the market, as consumers prioritize shielding themselves from the sun. Brands employ various branding strategies, including collaborations with influencers and celebrities, to increase market presence. Popular styles, such as flat caps, Panama hats, fedora hats, and baseball caps, cater to diverse consumer preferences.
- Quality control and material sourcing are essential aspects of the market. Brands invest in research and development to create durable and long-lasting products. They also focus on ethical and sustainable material sourcing to meet consumer expectations and maintain brand reputation. The product lifecycle of headwear is influenced by factors such as trends, consumer preferences, and market dynamics. In conclusion, the market is driven by the growing demand for functional and fashionable headgear that caters to consumers' active lifestyles and outdoor pursuits. Brands focus on providing UV protection, adjustable closures, and performance-oriented materials to meet consumer needs.
- Quality control and ethical material sourcing are essential components of the market, ensuring customer satisfaction and brand reputation.
What challenges does the Headwear Industry face during its growth?
- The proliferation of counterfeit products poses a significant challenge to the industry, threatening its growth and undermining consumer trust.
- The market faces a significant challenge from counterfeit products, which negatively impact both brand reputation and customer safety. Counterfeit headwear, including unlicensed sports team merchandise, is produced using substandard materials and inadequate manufacturing processes, diluting the value of authentic brands. The ease of copying designs, logos, and trademarks contributes to a surge in counterfeit headwear, particularly in the apparel, clothing, and luxury goods market. This issue undermines consumer trust and can lead to potential safety hazards. Popular sports headwear, such as hats and caps, are often targeted for counterfeiting, with unauthorized copies misleading customers and damaging the reputation of legitimate brands.
Exclusive Customer Landscape
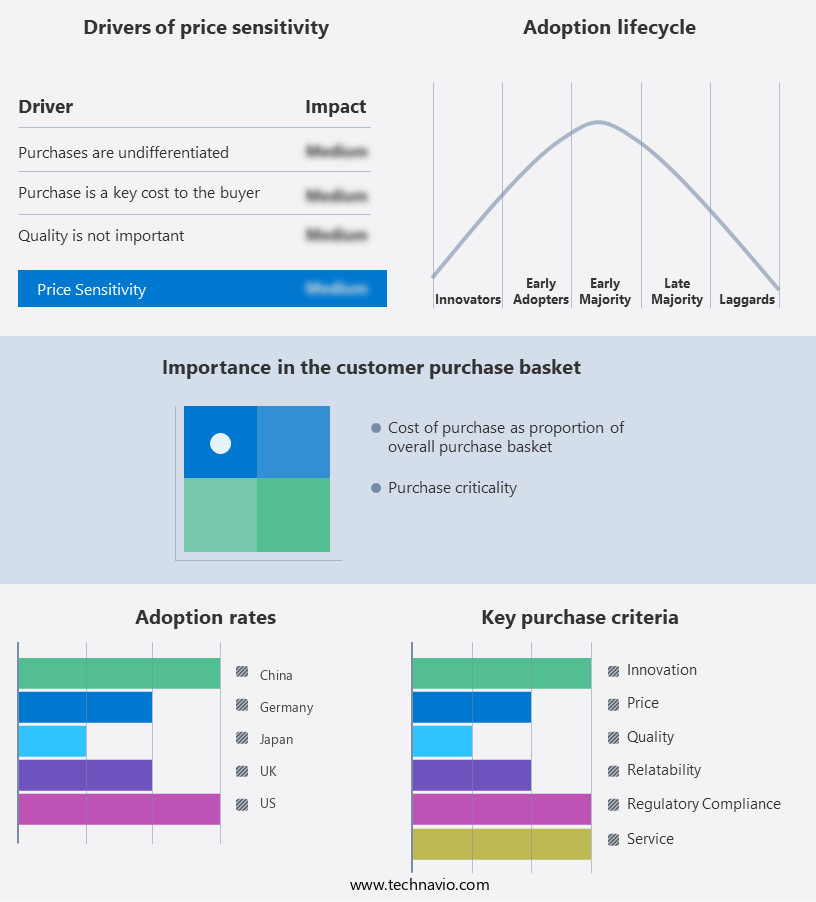
The headwear market forecasting report includes the adoption lifecycle of the market, covering from the innovator's stage to the laggard's stage. It focuses on adoption rates in different regions based on penetration. Furthermore, the headwear market report also includes key purchase criteria and drivers of price sensitivity to help companies evaluate and develop their market growth analysis strategies.
Customer Landscape
Key Companies & Market Insights
Companies are implementing various strategies, such as strategic alliances, headwear market forecast, partnerships, mergers and acquisitions, geographical expansion, and product/service launches, to enhance their presence in the industry.
Adidas AG - This company specializes in providing a diverse range of headwear options, including bucket hats, beanies, and baseball caps. Each piece is meticulously designed to cater to various preferences and styles.
The industry research and growth report includes detailed analyses of the competitive landscape of the market and information about key companies, including:
- Adidas AG
- Akubra Hats Pty Ltd.
- BARTS B.V.
- Christy and Co. Ltd.
- Columbia Sportswear Co.
- FLEXFIT LLC
- Giorgio Armani SpA
- Hats.com LLC
- Lock and Co. Hatters
- Michael Kors
- New Era Cap LLC
- Nike Inc.
- Original Buff S.A.
- Patagonia Inc.
- PUMA SE
- Ralph Lauren Corp.
- SUPERDRY PLC
- The North Face
- Tommy Hilfiger licensing, LLC.
- Under Armour Inc.
Qualitative and quantitative analysis of companies has been conducted to help clients understand the wider business environment as well as the strengths and weaknesses of key industry players. Data is qualitatively analyzed to categorize companies as pure play, category-focused, industry-focused, and diversified; it is quantitatively analyzed to categorize companies as dominant, leading, strong, tentative, and weak.
Recent Development and News in Headwear Market
- In January 2024, Lululemon Athletica, a leading athletic apparel company, entered the market with the launch of its new "Sunlight Logo" hat collection. The hats, featuring the company's iconic logo, were designed to provide UPF 50+ sun protection and moisture-wicking technology (Lululemon Press Release, 2024).
- In March 2024, Adidas and New Balance, two major players in the sports headwear industry, announced a strategic partnership with the National Basketball Association (NBA) to become the official on-court headwear providers for the league (NBA Press Release, 2024).
- In May 2024, Under Armour, a significant player in the market, completed the acquisition of New Zealand-based headwear brand, Marmot Headwear, for approximately USD75 million. This acquisition expanded Under Armour's product offerings and strengthened its presence in the outdoor and adventure headwear segment (Under Armour Press Release, 2024).
- In April 2025, VF Corporation, the parent company of brands like The North Face, Timberland, and Vans, announced the launch of its new "RE:Thread" denim hats, made from recycled denim and organic cotton. This initiative marked a significant step towards sustainable headwear production in the fashion industry (VF Corporation Press Release, 2025).
Research Analyst Overview
- The market encompasses various trends and dynamics, with a focus on sustainability and customization options. Biodegradable packaging and sustainable materials, such as organic materials and recycled fabrics, are gaining popularity among consumers. Heat transfer, screen printing, digital printing, and sublimation printing techniques offer customization opportunities for brands. Pilling resistance, water repellency, and UPF ratings ensure durability and protection from the elements. Lining materials, hat care, and temperature regulation enhance wearer comfort. Hat bands, adjustable straps, and headwear accessories add functionality and style. Sustainable packaging and automated production processes contribute to the industry's environmental efforts. Brands also explore 3D printing, CAD design, and embroidery techniques for unique designs.
- Fast Fashion headwear caters to the mass market, while luxury headwear offers high-end, adjustable straps, and antimicrobial treatments. Moisture-wicking fabrics, thread count, shrinkage resistance, and UPF ratings are essential considerations for performance-focused headwear. Fabric weight, stitch density, and UPF ratings are crucial factors in sun protection hats. Wind resistance and UPF ratings are essential for outdoor activities. UPF ratings, hat bands, and fit adjustments ensure proper sun protection and comfort.
Dive into Technavio's robust research methodology, blending expert interviews, extensive data synthesis, and validated models for unparalleled Headwear Market insights. See full methodology.
|
Market Scope |
|
|
Report Coverage |
Details |
|
Page number |
227 |
|
Base year |
2024 |
|
Historic period |
2019-2023 |
|
Forecast period |
2025-2029 |
|
Growth momentum & CAGR |
Accelerate at a CAGR of 8.3% |
|
Market growth 2025-2029 |
USD 11627.5 million |
|
Market structure |
Fragmented |
|
YoY growth 2024-2025(%) |
7.0 |
|
Key countries |
US, China, Japan, India, South Korea, UK, Canada, Germany, Australia, and France |
|
Competitive landscape |
Leading Companies, Market Positioning of Companies, Competitive Strategies, and Industry Risks |
What are the Key Data Covered in this Headwear Market Research and Growth Report?
- CAGR of the Headwear industry during the forecast period
- Detailed information on factors that will drive the growth and forecasting between 2025 and 2029
- Precise estimation of the size of the market and its contribution of the industry in focus to the parent market
- Accurate predictions about upcoming growth and trends and changes in consumer behaviour
- Growth of the market across APAC, North America, Europe, South America, and Middle East and Africa
- Thorough analysis of the market's competitive landscape and detailed information about companies
- Comprehensive analysis of factors that will challenge the headwear market growth of industry companies
We can help! Our analysts can customize this headwear market research report to meet your requirements.
 RIA -
RIA - 
