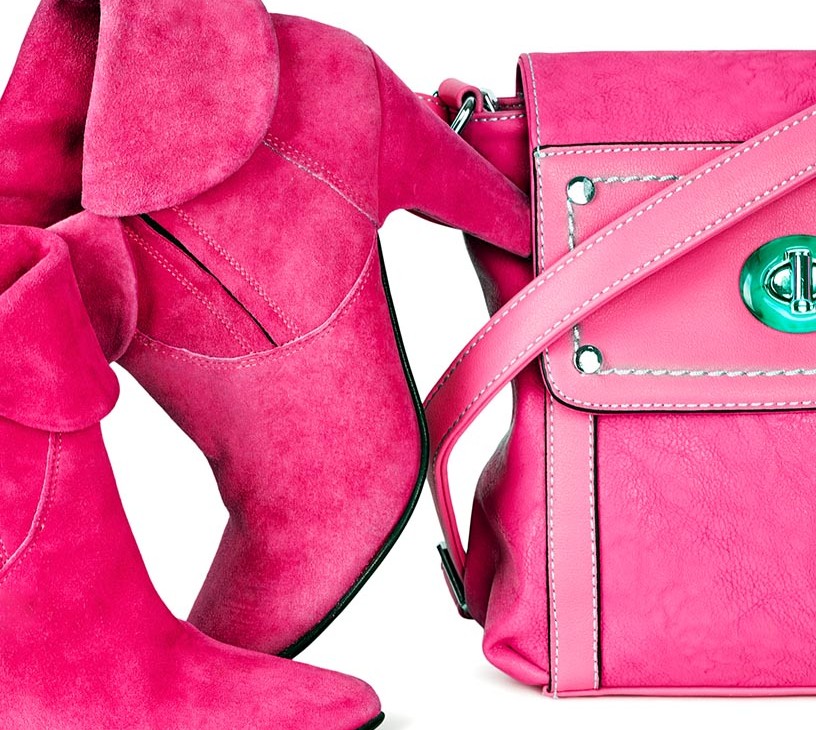
Personal Luxury Goods Market Size 2026-2030
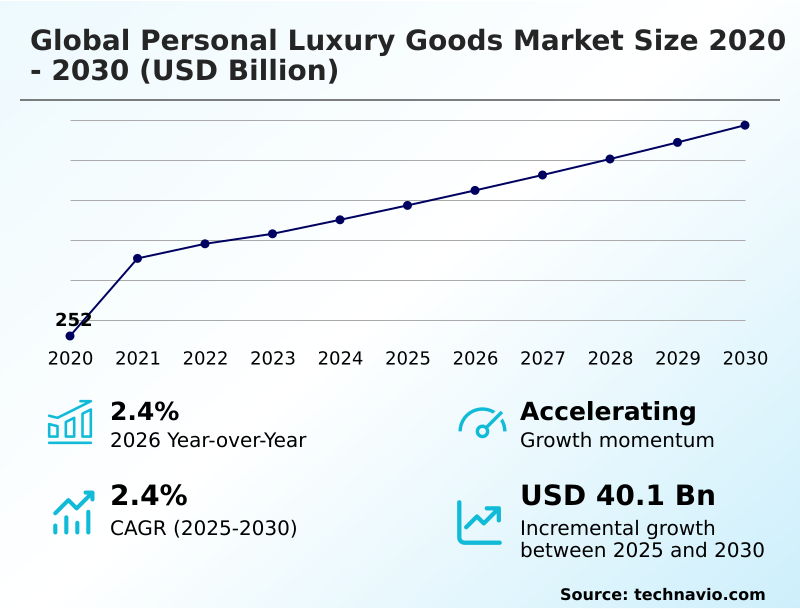
The personal luxury goods market size is valued to increase by USD 40.1 billion, at a CAGR of 2.4% from 2025 to 2030. Increased demand for premium beauty products and cosmetics will drive the personal luxury goods market.
Major Market Trends & Insights
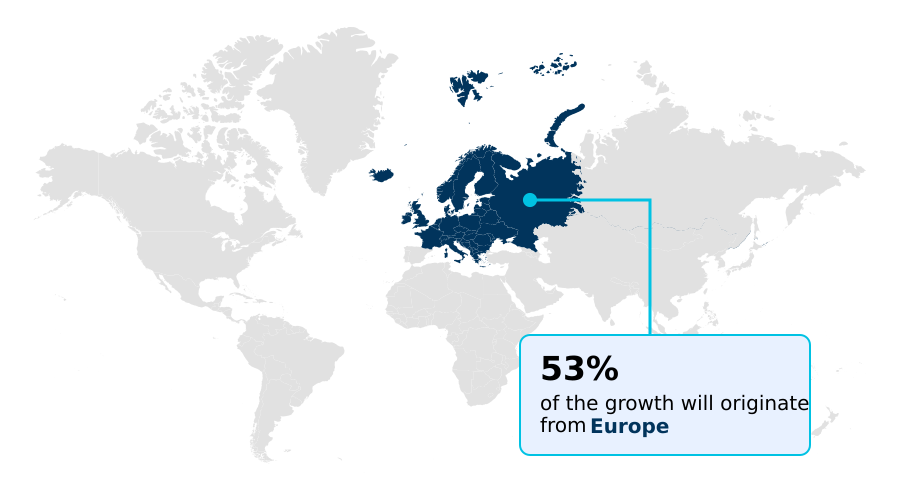
- Europe dominated the market and accounted for a 52.9% growth during the forecast period.
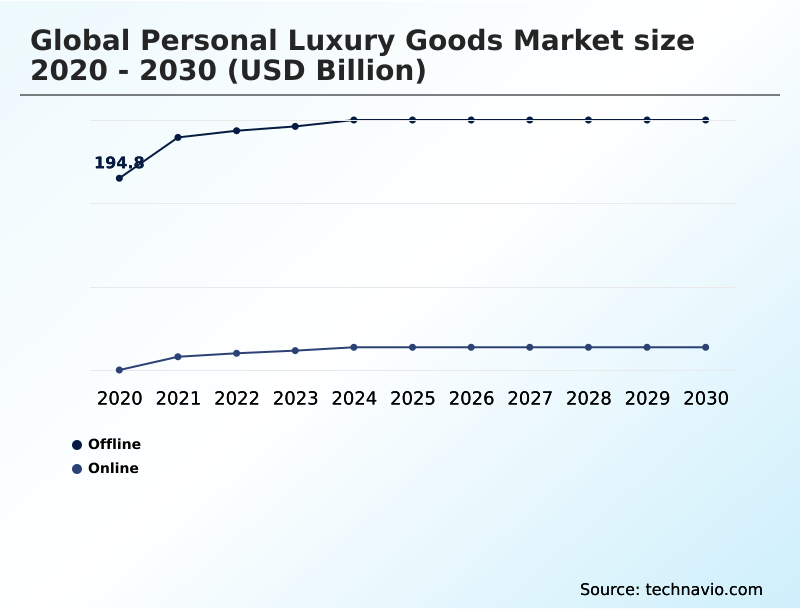
- By Distribution Channel - Offline segment was valued at USD 236.6 billion in 2024
- By Product - Hard luxury segment accounted for the largest market revenue share in 2024
Market Size & Forecast
- Market Opportunities: USD 105.4 billion
- Market Future Opportunities: USD 40.1 billion
- CAGR from 2025 to 2030 : 2.4%
Market Summary
- The Personal Luxury Goods Market is characterized by a dynamic interplay of heritage and innovation. It encompasses high-quality, exclusive products where brand heritage storytelling and artisanal craftsmanship are paramount. A significant shift is underway as the industry embraces clienteling technology to deliver hyper-personalization, transforming the high-end consumer behavior landscape.
- The integration of phygital retail experience is a core component of modern omnichannel strategy, blending the convenience of digital access with the sensory richness of physical stores. This is particularly important for managing the premium product lifecycle and maintaining high luxury brand valuation.
- In one business scenario, a firm leveraged AI-driven analytics to refine its localized marketing strategies for an emerging market, resulting in a 25% improvement in VIC (very important client) management and engagement.
- Challenges such as ensuring supply chain transparency and promoting sustainable material sourcing are now central to boardroom discussions, influencing everything from product design to corporate identity and the evolution of luxury brand loyalty. The rise of the secondhand luxury market and circular economy models further complicates this environment, pushing brands toward new definitions of ownership and value.
- The adoption of the digital product passport is becoming a key tool in this transition, building trust with consumers.
What will be the Size of the Personal Luxury Goods Market during the forecast period?
Get Key Insights on Market Forecast (PDF) Get Free Sample
How is the Personal Luxury Goods Market Segmented?
The personal luxury goods industry research report provides comprehensive data (region-wise segment analysis), with forecasts and estimates in "USD billion" for the period 2026-2030, as well as historical data from 2020-2024 for the following segments.
- Distribution channel
- Offline
- Online
- Product
- Hard luxury
- Apparel
- Cosmetics and perfumes
- Accessories
- Others
- End-user
- Women
- Men
- Unisex
- Geography
- Europe
- France
- Italy
- UK
- North America
- US
- Canada
- Mexico
- APAC
- China
- Japan
- South Korea
- Middle East and Africa
- UAE
- Saudi Arabia
- Turkey
- South America
- Brazil
- Argentina
- Rest of World (ROW)
- Europe
By Distribution Channel Insights
The offline segment is estimated to witness significant growth during the forecast period.
The offline channel remains dominant, evolving from transactional points of sale into immersive environments for brand heritage storytelling. Success in this personal luxury goods segmentation hinges on the phygital retail experience, where mono-brand boutiques offer a controlled experiential luxury journey.
These spaces leverage in-person clienteling technology for VIC (very important client) management, a strategy that has proven to increase customer lifetime value in luxury by over 15%.
Department stores are adapting with exclusive pop-up concepts, addressing the nuances of high-end consumer behavior.
This focus on artisanal craftsmanship and curated interactions solidifies the physical store's role in the premium product lifecycle, creating a powerful defense against the dilution of luxury brand valuation.
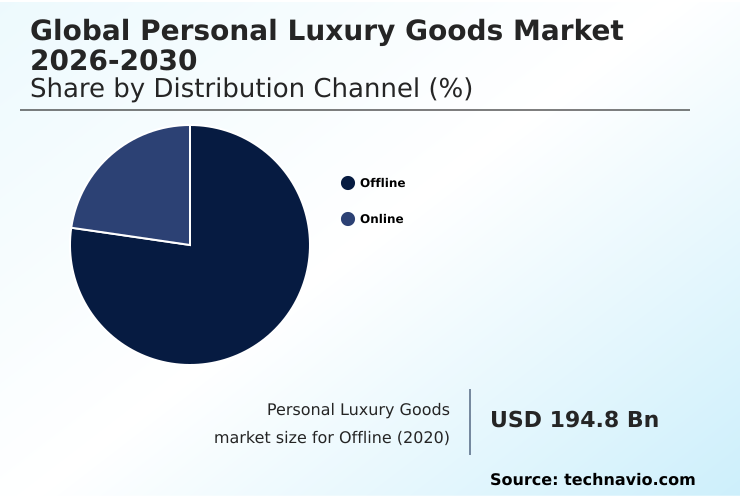
The Offline segment was valued at USD 236.6 billion in 2024 and showed a gradual increase during the forecast period.
Regional Analysis
Europe is estimated to contribute 52.9% to the growth of the global market during the forecast period.Technavio’s analysts have elaborately explained the regional trends and drivers that shape the market during the forecast period.
See How Personal Luxury Goods Market Demand is Rising in Europe Get Free Sample
The geographic landscape is diversifying, with significant activity in both established and emerging regions. In mature markets, a focus on quiet luxury and bespoke customization caters to a sophisticated clientele.
Meanwhile, growth in new territories is supported by the strategic use of geo-fencing for luxury retail to target affluent consumers, with mobile ad engagement rates increasing by 20% using this technique.
The expansion of social commerce for luxury and luxury brand collaborations are key tactics for building brand presence globally. Brands are also exploring the metaverse in luxury retail to create novel engagement opportunities.
The performance varies significantly by region, with some areas showing a preference for gender-fluid collections and others prioritizing traditional luxury codes.
Market Dynamics
Our researchers analyzed the data with 2025 as the base year, along with the key drivers, trends, and challenges. A holistic analysis of drivers will help companies refine their marketing strategies to gain a competitive advantage.
- The future of the personal luxury goods market is intrinsically linked to the impact of AI on luxury retail personalization. This technological shift allows for a deeper understanding of affordable luxury market growth drivers by analyzing vast datasets on consumer behavior.
- As brands refine their strategies, analyzing Gen Z and millennial luxury spending habits becomes critical, as these cohorts prioritize authenticity and digital engagement. The evolution of luxury brand loyalty in the digital age is no longer solely about product quality but also about the values a brand represents.
- Consequently, the focus on sustainable and ethical practices in luxury fashion is a key differentiator, with brand heritage storytelling for customer engagement now incorporating narratives of responsibility. The future of the phygital retail experience in luxury will blend seamless digital interfaces with high-touch, personalized in-store service.
- For firms looking to expand, navigating the challenges of luxury market penetration in Asia requires a nuanced approach that respects local culture while maintaining a global brand identity. At the same time, the role of circular economy models in luxury is expanding, with some brands reporting that their resale programs improve customer retention by over 20% compared to traditional models.
- Finally, the importance of supply chain transparency for consumers cannot be overstated, as it directly builds trust and reinforces a brand's premium positioning in a competitive landscape.
What are the key market drivers leading to the rise in the adoption of Personal Luxury Goods Industry?
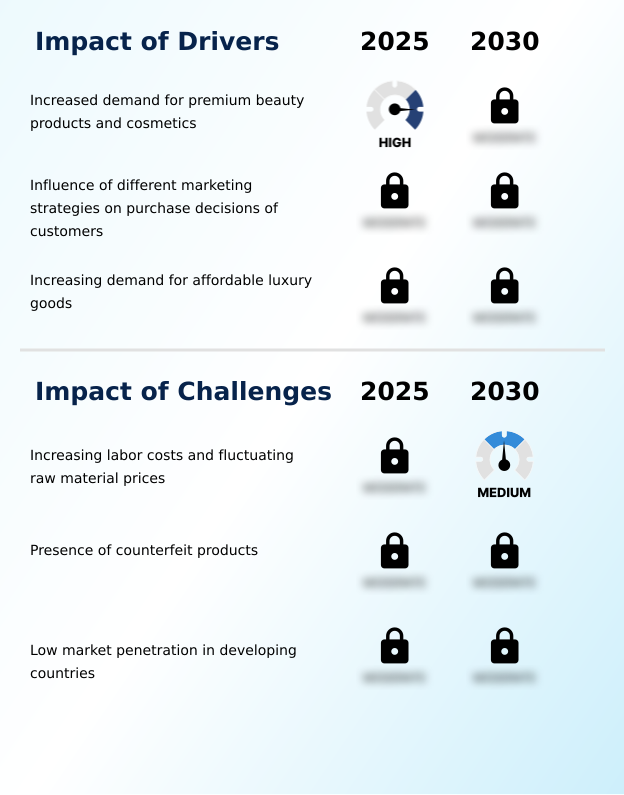
- The increasing demand for premium beauty products and cosmetics is a key driver for market growth.
- Market expansion is significantly driven by the aspirational luxury market and the increasing accessibility of premium goods, fuelling affordable luxury market growth drivers. Brands are utilizing a sophisticated omnichannel strategy and direct-to-consumer (DTC) luxury models to reach a broader audience.
- Effective localized marketing strategies are crucial for tapping into the luxury market in emerging economies, where rising disposable incomes are boosting demand. The perceived value of investment-grade items also propels purchasing decisions, especially during economic uncertainty.
- These factors, combined with the high influencer marketing ROI in luxury, which can yield returns of up to 11 times the initial investment, create a powerful engine for sustained market advancement.
What are the market trends shaping the Personal Luxury Goods Industry?
- Hyper-personalization, driven by clienteling powered by artificial intelligence, is an emerging trend shaping the market.
- A key market trend is hyper-personalization, driven by the impact of AI on luxury retail. Brands are leveraging data-driven personalization to enhance luxury e-commerce strategy, moving beyond traditional demographics to predict individual preferences. This shift is crucial for engaging with Gen Z and millennial luxury spending habits, which prioritize authenticity and cultural relevance.
- The rise of the secondhand luxury market and circular economy models also reflects a new value system, with virtual try-on technology improving online conversion rates for both new and pre-owned items by up to 40%. These digital tools are reshaping luxury resale market dynamics and influencing the overall premium product lifecycle.
What challenges does the Personal Luxury Goods Industry face during its growth?
- Increasing labor costs and fluctuating raw material prices are key challenges affecting industry growth.
- A significant challenge involves navigating the complexities of global supply chain transparency, where issues with sustainable material sourcing can create reputational risk. The challenges of luxury market penetration in new regions are compounded by regulatory hurdles and the need to adapt to local consumer expectations, affecting the evolution of luxury brand loyalty.
- The proliferation of counterfeit goods necessitates advanced solutions like the digital product passport and smart packaging in luxury goods to protect brand integrity. These countermeasures add operational costs, with anti-counterfeit measures accounting for up to 5% of marketing budgets for some firms. Successfully addressing these issues is critical for maintaining long-term brand equity.
Exclusive Technavio Analysis on Customer Landscape
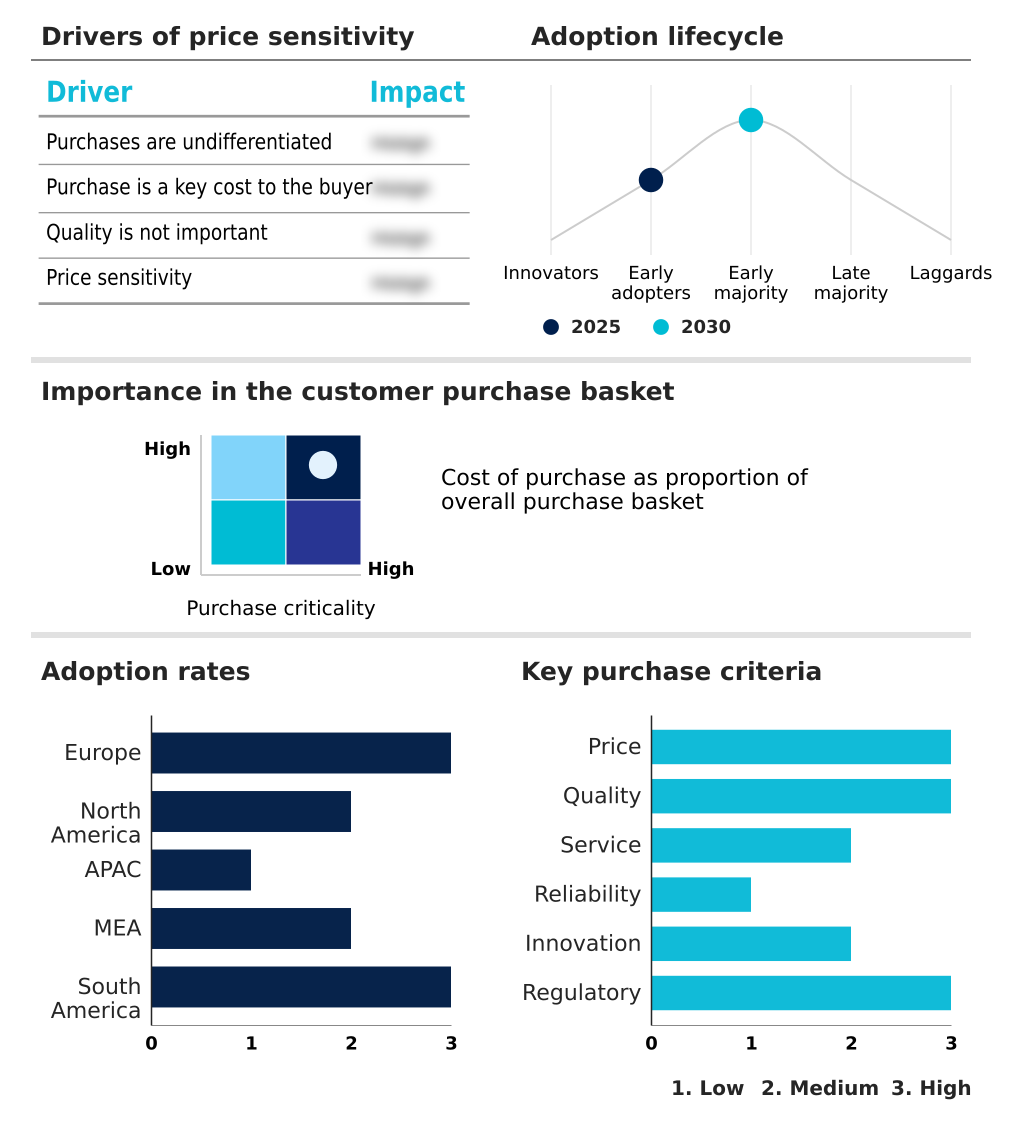
The personal luxury goods market forecasting report includes the adoption lifecycle of the market, covering from the innovator’s stage to the laggard’s stage. It focuses on adoption rates in different regions based on penetration. Furthermore, the personal luxury goods market report also includes key purchase criteria and drivers of price sensitivity to help companies evaluate and develop their market growth analysis strategies.
Customer Landscape of Personal Luxury Goods Industry
Competitive Landscape
Companies are implementing various strategies, such as strategic alliances, personal luxury goods market forecast, partnerships, mergers and acquisitions, geographical expansion, and product/service launches, to enhance their presence in the industry.
Audemars Piguet SA - Key offerings center on high-craftsmanship goods including timepieces, apparel, and cosmetics, reflecting brand heritage and superior quality.
The industry research and growth report includes detailed analyses of the competitive landscape of the market and information about key companies, including:
- Audemars Piguet SA
- Brunello Cucinelli SpA
- Burberry Group plc
- Canada Goose Inc.
- Capri Holdings Ltd.
- Chanel Ltd.
- Compagnie Financiere Richemont
- Giorgio Armani SpA
- Hermes International SA
- Kering SA
- Loreal SA
- LVMH Moet Hennessy
- Pandora AS
- Prada SpA
- Ralph Lauren Corp.
- Rolex SA
- Salvatore Ferragamo SpA
- Shiseido Co. Ltd.
- The Estee Lauder Co. Inc.
- The Swatch Group Ltd.
Qualitative and quantitative analysis of companies has been conducted to help clients understand the wider business environment as well as the strengths and weaknesses of key industry players. Data is qualitatively analyzed to categorize companies as pure play, category-focused, industry-focused, and diversified; it is quantitatively analyzed to categorize companies as dominant, leading, strong, tentative, and weak.
Recent Development and News in Personal luxury goods market
- In August, 2025, Dolce and Gabbana introduced its first high-end fragrance specifically formulated for dogs, reflecting a trend of humanizing pets among wealthy consumers.
- In May, 2025, Tissot introduced a new evolution of its Seastar collection featuring a thirty-eight millimeter chronograph, emphasizing craftsmanship through in-person demonstrations at its physical points of sale.
- In April, 2025, Rolex enhanced its market presence by introducing several high-profile watch models, including the GMT-Master II and Oyster Perpetual, focusing on timeless craftsmanship to secure its position.
- In March, 2025, YSL Beauty collaborated with Dua Lipa for a limited-edition cosmetics collection, leveraging digital promotion to capture the interest of tech-savvy shoppers and drive online sales.
Dive into Technavio’s robust research methodology, blending expert interviews, extensive data synthesis, and validated models for unparalleled Personal Luxury Goods Market insights. See full methodology.
| Market Scope | |
|---|---|
| Page number | 302 |
| Base year | 2025 |
| Historic period | 2020-2024 |
| Forecast period | 2026-2030 |
| Growth momentum & CAGR | Accelerate at a CAGR of 2.4% |
| Market growth 2026-2030 | USD 40.1 billion |
| Market structure | Fragmented |
| YoY growth 2025-2026(%) | 2.4% |
| Key countries | France, Italy, UK, Germany, Spain, The Netherlands, US, Canada, Mexico, China, Japan, South Korea, India, Australia, Indonesia, UAE, Saudi Arabia, Turkey, South Africa, Israel, Brazil, Argentina and Chile |
| Competitive landscape | Leading Companies, Market Positioning of Companies, Competitive Strategies, and Industry Risks |
Research Analyst Overview
- The personal luxury goods market is undergoing a fundamental transformation, moving beyond product sales to cultivate holistic brand ecosystems. A primary focus is on experiential luxury, where the phygital retail experience becomes a critical differentiator. Success now hinges on an effective omnichannel strategy that integrates everything from luxury e-commerce strategy to in-store bespoke customization.
- Leading firms prioritize VIC (very important client) management through advanced clienteling technology, recognizing that retaining top clients is more profitable than acquisition. The growing consumer demand for ethical practices has made supply chain transparency and sustainable material sourcing non-negotiable, directly impacting product strategy. For instance, brands adopting circular economy models have seen a 15% increase in engagement from younger demographics.
- The shift towards quiet luxury also reflects a change in high-end consumer behavior, where artisanal craftsmanship is valued over overt branding. This environment requires a delicate balance between honoring brand heritage storytelling and embracing innovations like the digital product passport to secure future luxury brand valuation and cultural relevance.
- The rise of the secondhand luxury market, gender-fluid collections, and investment-grade items further diversifies the landscape, demanding agile and forward-thinking approaches.
What are the Key Data Covered in this Personal Luxury Goods Market Research and Growth Report?
-
What is the expected growth of the Personal Luxury Goods Market between 2026 and 2030?
-
USD 40.1 billion, at a CAGR of 2.4%
-
-
What segmentation does the market report cover?
-
The report is segmented by Distribution Channel (Offline, and Online), Product (Hard luxury, Apparel, Cosmetics and perfumes, Accessories, and Others), End-user (Women, Men, and Unisex) and Geography (Europe, North America, APAC, Middle East and Africa, South America)
-
-
Which regions are analyzed in the report?
-
Europe, North America, APAC, Middle East and Africa and South America
-
-
What are the key growth drivers and market challenges?
-
Increased demand for premium beauty products and cosmetics, Increasing labor costs and fluctuating raw material prices
-
-
Who are the major players in the Personal Luxury Goods Market?
-
Audemars Piguet SA, Brunello Cucinelli SpA, Burberry Group plc, Canada Goose Inc., Capri Holdings Ltd., Chanel Ltd., Compagnie Financiere Richemont, Giorgio Armani SpA, Hermes International SA, Kering SA, Loreal SA, LVMH Moet Hennessy, Pandora AS, Prada SpA, Ralph Lauren Corp., Rolex SA, Salvatore Ferragamo SpA, Shiseido Co. Ltd., The Estee Lauder Co. Inc. and The Swatch Group Ltd.
-
Market Research Insights
- The market's dynamics are shaped by a strategic pivot towards data-driven personalization and innovative consumer engagement models. Brands are leveraging virtual try-on technology, which has been shown to increase conversion rates by as much as 40%, to enhance their direct-to-consumer (DTC) luxury channels.
- The expansion into the luxury market in emerging economies requires nuanced strategies to overcome the challenges of luxury market penetration. Meanwhile, the luxury resale market dynamics are being reshaped by brands launching their own certified pre-owned programs, capturing a secondary revenue stream and improving customer lifetime value in luxury.
- The use of social commerce for luxury has also proven effective, with some campaigns demonstrating an ROI 11 times higher than traditional digital advertising, highlighting its importance in modern marketing.
We can help! Our analysts can customize this personal luxury goods market research report to meet your requirements.
 RIA -
RIA - 
