Healthcare And Laboratory Labels Market Size 2024-2028
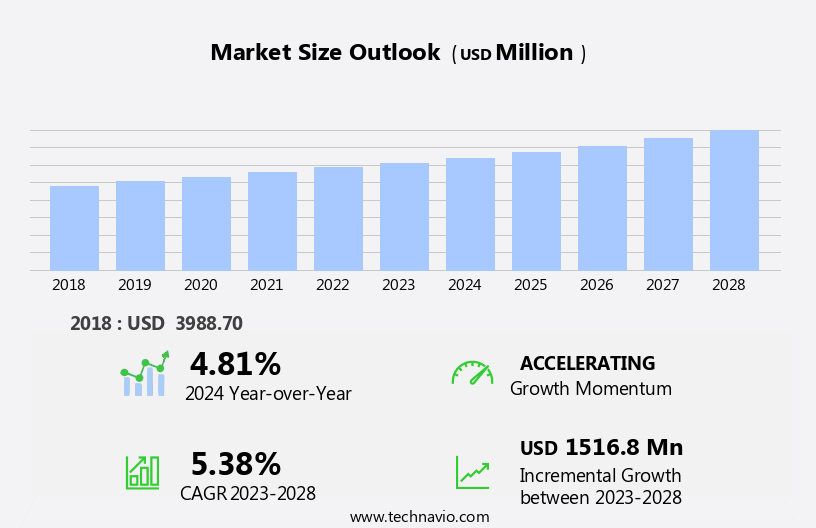
The healthcare and laboratory labels market size is forecast to increase by USD 1.52 billion at a CAGR of 5.38% between 2023 and 2028.
- The market is witnessing significant growth due to key trends such as the increasing investments in nutraceuticals and medical technologies, as well as the rising demand for sustainable packaging solutions. Infection control and automation are also driving the market, particularly in medical devices and home healthcare settings.
- Labels made of plastic materials like polyethylene and polyethylene terephthalate (PET) are gaining popularity due to their durability and ability to withstand various temperature and chemical conditions. Moreover, the digital transformation in healthcare services is leading to the adoption of advanced labeling systems for blood bags and other medical applications. The recycling of PET plastic is another trend that is expected to boost market growth.
What will be the Size of the Healthcare And Laboratory Labels Market During the Forecast Period?
- The market encompasses pressure-sensitive labels, labeling tapes, medical laboratory labels, and sticker labeling solutions for various applications within healthcare services and medical industries. This market exhibits robust growth, driven by the increasing demand for accurate patient identification, infection control, and documentation in medical laboratories and pharmaceutical and nutraceutical manufacturing.
- Unique device identification and clinical mobility are also significant trends, as digital technologies enable the integration of smart labels and barcodes for enhanced patient safety and data management. Laboratory equipment, including blood banks and chart labels, further expand the market scope. Polyester labels, known for their durability and resistance to chemicals, are increasingly adopted for long-term patient identification and medical product labeling.
- Overall, the market is poised for continued expansion, underpinned by the need for improved patient care, regulatory compliance, and technological advancements.
How is this Healthcare And Laboratory Labels Industry segmented and which is the largest segment?
The healthcare and laboratory labels industry research report provides comprehensive data (region-wise segment analysis), with forecasts and estimates in "USD billion" for the period 2024-2028, as well as historical data from 2018-2022 for the following segments.
- End-user
- Pharmaceutical
- Nutraceutical
- Medical devices
- Laboratory
- Others
- Geography
- APAC
- China
- Japan
- Europe
- Germany
- UK
- North America
- US
- South America
- Middle East and Africa
- APAC
By End-user Insights
The pharmaceutical segment is estimated to witness significant growth during the forecast period. Pharmaceutical labels play a crucial role in ensuring the accurate identification and understanding of essential information on medical products for patients. With the increasing approval of over-the-counter (OTC) drugs, the demand for pharmaceutical labels is expected to rise. Furthermore, the growing geriatric population and the trend towards home care settings necessitate clear labeling for easy drug identification without professional guidance.
In the medical industries, including laboratories, hospitals, and blood banks, various types of labels such as pressure-sensitive labels, labeling tapes, medical laboratory labels, and clinical mobility labels are used for documenting patient data, medication instructions, and infection control. Digital technologies, including Unique Device Identification (UDI), digital integration, and smart labels, are increasingly being adopted for enhanced patient safety and documentation. The Middle-class population, particularly those suffering from diseases like obesity and diabetes, also rely on nutraceutical products and medical devices for treatment, further increasing the demand for labeling solutions.
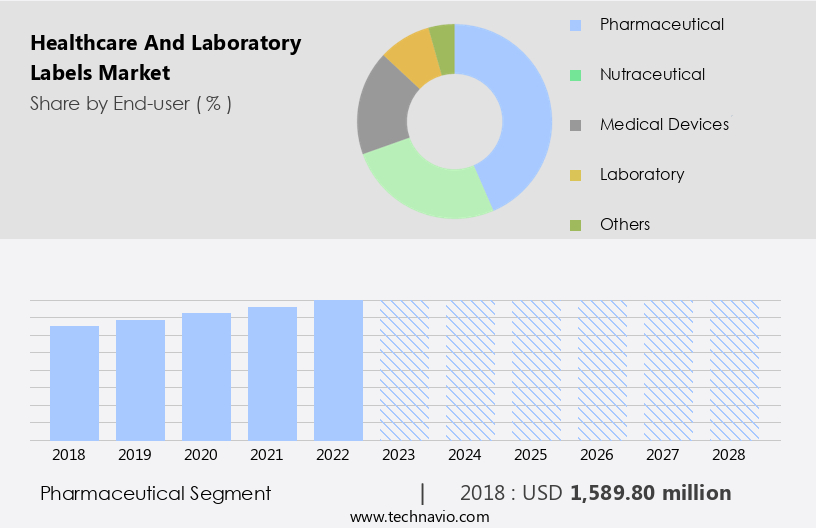
Get a glance at the share of various segments. Request Free Sample
The Pharmaceutical segment was valued at USD 1.59 billion in 2018 and showed a gradual increase during the forecast period.
Regional Analysis
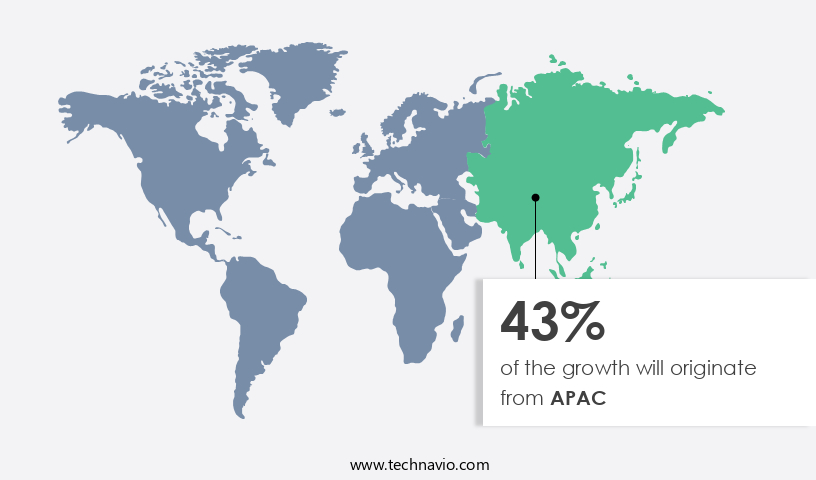
APAC is estimated to contribute 43% to the growth of the global market during the forecast period. Technavio's analysts have elaborately explained the regional trends and drivers that shape the market during the forecast period.
For more insights on the market size of various regions, Request Free Sample
The market In the Asia Pacific region is experiencing significant growth due to the expanding patient population, increasing R&D activities in healthcare and pharmaceutical sectors, and the establishment of numerous research centers, diagnostic centers, and academic institutions. This growth is driven by increased investments from global organizations In biotechnology and pharmaceutical industry in countries like India and Singapore. The region's business-friendly ecosystem, efficient operating environment, and robust legal framework are attracting healthcare and pharmaceutical companies. Healthcare and laboratory labels play a crucial role In these facilities, ensuring proper tracking and monitoring of samples, medication, and patient data. Key applications include medical device labeling, clinical mobility, unique device identification, and infection control labels.
Digital technologies, such as digital integration, smart labels, and in-mold label solutions, are also gaining popularity for their ability to enhance patient safety and improve documentation efficiency. The market for healthcare and laboratory labels is expected to continue growing due to the increasing prevalence of diseases such as obesity and diabetes, as well as the rising demand for nutraceuticals and medical devices. Blood banks and hospital services are significant consumers of laboratory products, including sticker labeling for medical industries, chart labels, blood bag labels, and infection control labels. Ensuring patient identification and maintaining documentation accuracy are essential for patient safety and effective healthcare delivery.
Market Dynamics
Our researchers analyzed the data with 2023 as the base year, along with the key drivers, trends, and challenges. A holistic analysis of drivers will help companies refine their marketing strategies to gain a competitive advantage.
What are the key market drivers leading to the rise In the adoption of Healthcare And Laboratory Labels Industry?
Increasing investments in drug discovery is the key driver of the market.
- Due to the increasing prevalence of chronic diseases and the growing demand for personalized medicine, pharmaceutical and biotechnology companies are increasing their R&D investments in discovering new drugs. This has increased the demand for laboratory instruments that are required during the initial phase of the drug discovery process for protein target identification. Due to the increasing prevalence of chronic diseases across the world, pharmaceutical and biotechnology companies are focusing on developing new drugs. In the US, each year, about 1.5 million people are diagnosed with cancer. This has resulted in an increased demand for healthcare and laboratory labels.
- Laboratory labels are important to save the time and efforts involved in the drug approval process and keep everything in order. In the last few years, the governments of several developed and developing countries have been supporting research for new drug discovery and development. The rapid progression of laboratory research has enabled pharmaceutical companies to mitigate the risks involved in drug formulation. Therefore, with the growing emphasis on R&D procedures and significant investments made in them, the demand for laboratory labels is expected to increase. This will drive the growth of the market during the forecast period
What are the market trends shaping the Healthcare And Laboratory Labels market?
Growing demand for sustainable labels is the upcoming market trend.
- Consumers across the world are becoming more aware of sustainability and environmental issues that are involved in packaging and labeling. There is a need to reduce pollution, which can be attained by using recyclable materials and resins derived from renewable resources in the manufacturing of labels. Further, the increase in the demand for eco-friendly packaging has made it necessary for vendors to incorporate sustainable materials in the manufacturing of labels. Hence, vendors are choosing environment-friendly raw materials used for labels, including face stock liners, inks, coatings, and adhesives.
- In addition, advances in technology have enabled vendors to introduce new designs in the labeling for healthcare and laboratory products. Therefore, vendors are investing more in the development of sustainable labels and promoting environmental safety. These sustainable labels not only provide vendors of healthcare and laboratory labels with the opportunity to meet their targets related to sustainable labels on the packaging but also allow end-users to benefit from the functionality of a regular polyethylene label. This will trigger the growth of the global healthcare and laboratory labels during the forecast period.
What challenges does the Healthcare And Laboratory Labels Industry face during its growth?
Recycling of polyethylene terephthalate (PET) plastic is a key challenge affecting the industry growth.
- PET plastic is a lightweight and cost-effective polymer material; however, its disposal involves many difficulties. Label manufacturers face many challenges while recycling PET labels as they are dense, and it is difficult to separate them from the PET in the recycling stream. Hence, this type of plastic cannot be recycled, which leads to harmful effects on the environment, and, in turn, negatively impacts manufacturers.
- On the other hand, the rise in demand for PET polymers has led to a scarcity of the material worldwide. Also, PET prices in North America increased in 2021 when compared to that in 2020. To overcome the scarcity of PET and tackle the rise in PET prices, vendors in the global healthcare and laboratory labels market are recycling used PET bottles and containers. The recycling efforts for PET plastic have gradually led to a decline in the dumping or burning of PET at landfills globally. However, label substrates like polyvinyl chloride (PVC) and polyethylene terephthalate glycol (PETG) face problems during the recycling of PET polymers. Due to the same specific density as the PET container or bottle material, it is a big challenge to separate the labels using the float-sink method. Thus, the issue of separating the labels from PET containers/bottles before recycling poses a major challenge for market vendors. This will obstruct the growth of market in focus during the forecast period.
Exclusive Customer Landscape
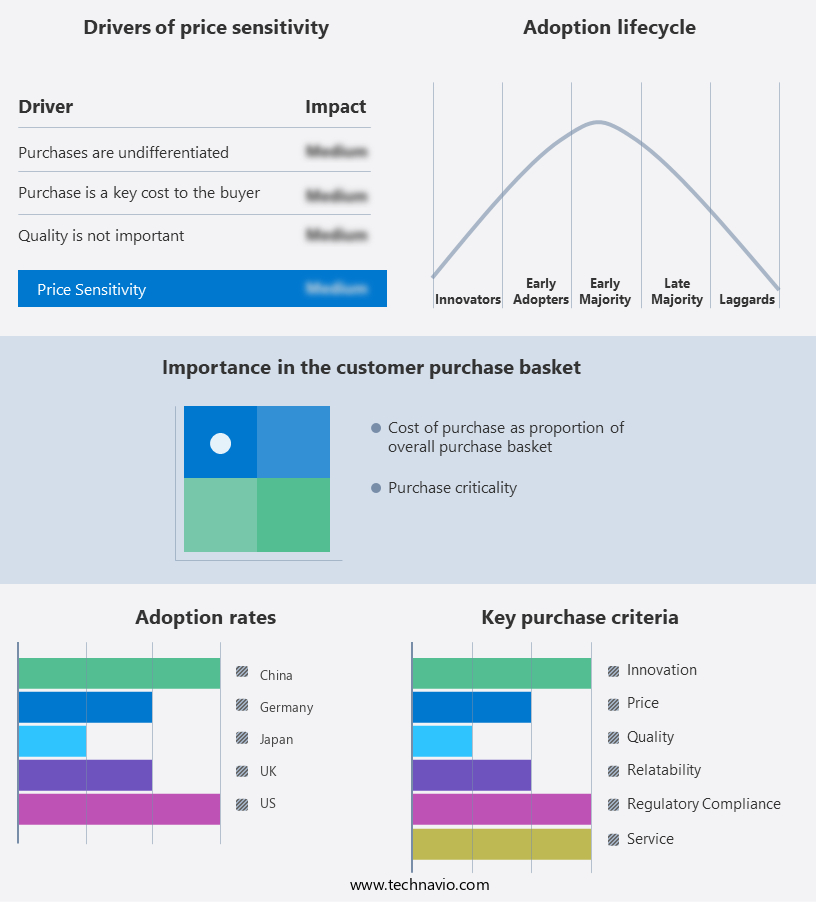
The healthcare and laboratory labels market forecasting report includes the adoption lifecycle of the market, covering from the innovator's stage to the laggard's stage. It focuses on adoption rates in different regions based on penetration. Furthermore, the healthcare and laboratory labels market report also includes key purchase criteria and drivers of price sensitivity to help companies evaluate and develop their market growth analysis strategies.
Customer Landscape
Key Companies & Market Insights
Companies are implementing various strategies, such as strategic alliances, healthcare and laboratory labels market forecast, partnerships, mergers and acquisitions, geographical expansion, and product/service launches, to enhance their presence In the industry.
AD Barcode Solution. - The company specializes in producing a range of healthcare and laboratory labels, including those for blood bags and other specimens. These labels adhere to industry standards and regulations, ensuring accurate identification and traceability. The labels' durability and resistance to various environmental conditions maintain sample integrity throughout transportation and storage processes. Additionally, the company's labels offer customizable options for barcodes, patient information, and other essential details, enhancing efficiency and streamlining workflows within healthcare and diagnostic facilities.
The industry research and growth report includes detailed analyses of the competitive landscape of the market and information about key companies, including:
- AD Barcode Solution.
- Avery Dennison Corp.
- Brady Corp.
- Caresfield LLC
- CCL Industries Corp.
- CILS International
- Diagramm Halbach GmbH and Co. KG
- Diversified Biotech Inc.
- Dynamic Labels
- Electronic Imaging Materials Inc.
- GA International Inc.
- General Data Co. Inc.
- HCL Labels Inc.
- ID Label Inc.
- JK Labels Pvt. Ltd.
- Multipack Labels
- NTK
- RR Donnelley and Sons Co.
- UPM Kymmene Corp.
- Weber Packaging Solutions Inc.
- Multi Color Corp.
Qualitative and quantitative analysis of companies has been conducted to help clients understand the wider business environment as well as the strengths and weaknesses of key industry players. Data is qualitatively analyzed to categorize companies as pure play, category-focused, industry-focused, and diversified; it is quantitatively analyzed to categorize companies as dominant, leading, strong, tentative, and weak.
Research Analyst Overview
The healthcare industry is witnessing significant advancements in labeling solutions, with pressure-sensitive labels and labeling tapes gaining popularity in medical laboratories. These labels offer versatility, ease of application, and durability, making them ideal for various laboratory applications. Medical laboratories require accurate and reliable labeling to ensure the proper identification of laboratory equipment, samples, and patient specimens. The use of medical device labeling and patient identification labels is crucial for patient safety and documentation. In vitro diagnostic tests, blood banks, and hospital services all benefit from these labeling solutions. Digital technologies are revolutionizing the labeling industry, with digital integration and smart labels becoming increasingly common.
Unique device identification and clinical mobility are two areas where digital technologies have made a significant impact. Digital technologies enable real-time tracking and monitoring of medical devices and samples, improving efficiency and accuracy. The millennial population's growing demand for nutraceuticals and over-the-counter medications has led to an increase In the production and distribution of nutraceutical products. These products require labeling that adheres to language requirements and regulatory standards. Polyester and paper are popular labeling materials for nutraceuticals due to their durability and ability to withstand various environmental conditions. The medical industries, including pharmaceutical and nutraceutical, require strict adherence to labeling regulations to ensure patient safety and prevent medication errors.
Infection control labels and toxic chemical warning labels are essential for medical laboratories to maintain a safe working environment. Laboratory samples, such as test tubes and blood bags, require specific labeling to ensure proper identification and documentation. Infection control labels and barcode labels are commonly used for these applications. In-mold label solutions offer a cost-effective and efficient alternative to traditional labeling methods for medical devices and laboratory equipment. The healthcare industry is undergoing significant changes, with a focus on patient-centered care and digitalization. Patient safety, documentation, and identification are critical components of this transformation. Medical labels, chart labels, and patient identification labels play a vital role in ensuring accurate and efficient patient care.
In conclusion, the market is experiencing significant growth due to the increasing demand for accurate and reliable labeling solutions. Pressure-sensitive labels, labeling tapes, and digital technologies are driving innovation in this market, with a focus on patient safety, documentation, and identification. The use of various labeling materials, such as polyester and paper, is essential to meet the specific requirements of different applications. The healthcare industry's transformation towards patient-centered care and digitalization is expected to continue driving growth in this market.
|
Market Scope |
|
|
Report Coverage |
Details |
|
Page number |
149 |
|
Base year |
2023 |
|
Historic period |
2018-2022 |
|
Forecast period |
2024-2028 |
|
Growth momentum & CAGR |
Accelerate at a CAGR of 5.38% |
|
Market growth 2024-2028 |
USD 1.52 billion |
|
Market structure |
Fragmented |
|
YoY growth 2023-2024(%) |
4.81 |
|
Key countries |
China, US, Japan, Germany, and UK |
|
Competitive landscape |
Leading Companies, Market Positioning of Companies, Competitive Strategies, and Industry Risks |
What are the Key Data Covered in this Healthcare And Laboratory Labels Market Research and Growth Report?
- CAGR of the Healthcare And Laboratory Labels industry during the forecast period
- Detailed information on factors that will drive the growth and forecasting between 2024 and 2028
- Precise estimation of the size of the market and its contribution of the industry in focus to the parent market
- Accurate predictions about upcoming growth and trends and changes in consumer behaviour
- Growth of the market across APAC, Europe, North America, South America, and Middle East and Africa
- Thorough analysis of the market's competitive landscape and detailed information about companies
- Comprehensive analysis of factors that will challenge the healthcare and laboratory labels market growth of industry companies
We can help! Our analysts can customize this healthcare and laboratory labels market research report to meet your requirements.
 RIA -
RIA - 
