
What is the Size of High Purity Arsenic Market?
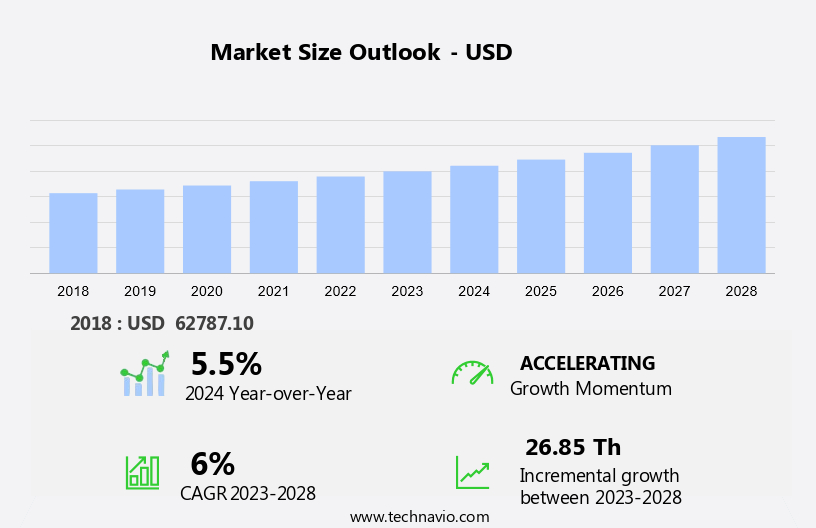
The high purity arsenic market size is forecast to increase by USD 26.85 thousand, at a CAGR of 6% between 2023 and 2028. The market is experiencing significant growth due to the increasing demand for this essential element in various industries, particularly in the production of GaAs for semiconductor applications. GaAs is a crucial component in radar technology and laser diodes, making it indispensable in defense and telecommunications sectors. Moreover, the ongoing innovation in LED technology, which is driving the demand for high-purity arsenic, is another key growth factor. However, the market faces challenges related to toxicity issues and the need for stringent regulations to ensure safe handling and disposal. Informed business decisions can be made by staying updated on these trends and challenges to capitalize on the opportunities in the high-purity arsenic market.
Request Free High Purity Arsenic Market Sample
Market Segmentation
The market research report provides comprehensive data (region-wise segment analysis), with forecasts and estimates in "USD thousand" for the period 2024-2028, as well as historical data from 2018 - 2022 for the following segments.
- Type
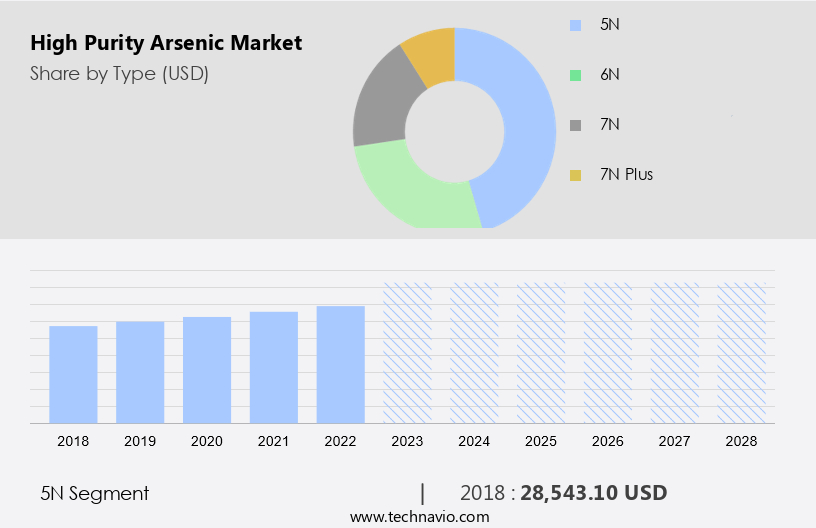
- 5N
- 6N
- 7N
- 7N plus
- Application
- Semiconductor
- LED
- Laser diodes
- Others
- Geography
- APAC
- China
- India
- Japan
- South Korea
- North America
- US
- Europe
- Germany
- UK
- Middle East and Africa
- South America
- APAC
Which is the Largest Segment Driving Market Growth?
The 5N systems segment is estimated to witness significant growth during the forecast period. Five-nine high purity arsenic, with a purity level of 99.999%, is a vital component in the semiconductor industry, particularly for the manufacturing of GaAs and InAs compounds. These materials, which boast exceptional purity, are indispensable for producing high-performance electronic and optoelectronic devices. GaAs, for instance, is extensively utilized in the production of microwave and millimeter-wave devices due to its superior electron mobility compared to silicon. This property enables faster and more efficient electronic devices in these applications.
Get a glance at the market share of various regions Download the PDF Sample
The 5N systems segment was valued at USD 28,543.10 in 2018. Furthermore, GaAs is a crucial material in the fabrication of LEDs, laser diodes, and solar cells, highlighting its versatility and significance within the semiconductor industry. Big data and machine learning are revolutionizing various sectors, including the semiconductor industry. These advanced technologies are enabling innovation by providing insights into complex systems and processes. For instance, they can be employed to optimize the production process of high purity arsenic, ensuring consistent quality and yield. By leveraging big data and machine learning, semiconductor manufacturers can enhance their competitiveness and meet the increasing demand for high-performance electronic devices.
Which Region is Leading the Market?
For more insights on the market share of various regions Request Free Sample
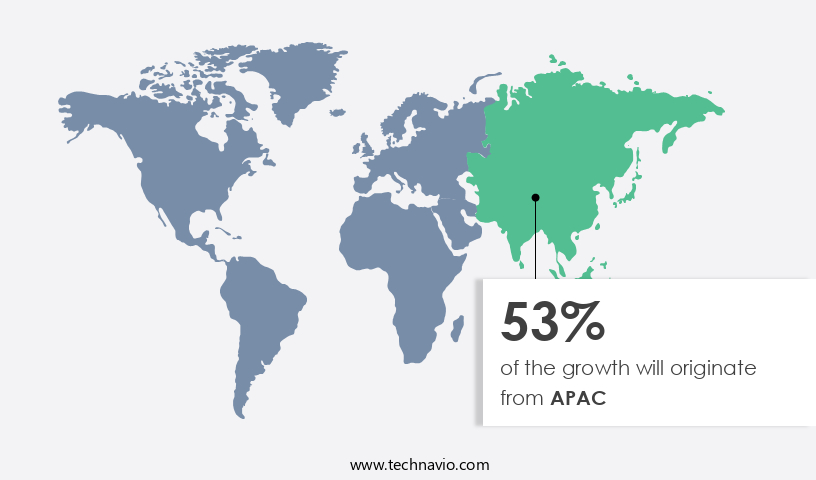
APAC is estimated to contribute 53% to the growth of the global market during the forecast period. Technavio's analysts have elaborately explained the regional trends and drivers that shape the market during the forecast period. The APAC region represents a pivotal market for high purity arsenic, fueled by progressive initiatives to advance semiconductor research and technology. Notably, an agreement was recently endorsed on November 21, 2023, between India and the EU, signified as a Memorandum of Understanding (MoU), under the EU-India Trade and Technology Council (TTC). This strategic collaboration intends to fortify partnerships on semiconductor ecosystems, supply chains, and technological innovations. This alliance is projected to fortify the semiconductor industry in the APAC region, with a particular emphasis on India. By forging closer ties with the EU, India aspires to adopt cutting-edge technologies and industry standards, thereby enhancing its semiconductor manufacturing capabilities. From a business perspective, this partnership is expected to yield significant benefits for B2B players operating in the digital sector. The collaboration will facilitate knowledge exchange, fostering an environment conducive to innovation and growth. Furthermore, the implementation of AI and advanced technologies in the semiconductor industry is anticipated to streamline processes, thereby increasing operational efficiency.
How do Technavio's company ranking index and market positioning come to your aid?
Companies are implementing various strategies, such as strategic alliances, partnerships, mergers and acquisitions, geographical expansion, and product/service launches, to enhance their presence in the market.
ALB Materials Inc. - This company offers high purity arsenic which can be customized in terms of purity, composition, and form to meet specific industrial needs.
Technavio provides the ranking index for the top 12 companies along with insights on the market positioning of:
- American Elements
- ATT Advanced elemental materials Co Ltd
- FURUKAWA Co. Ltd.
- Merck KGaA
- Noah Chemicals
- Otto Chemie Pvt. Ltd.
- Stanford Materials Corp.
- Thermo Fisher Scientific Inc.
- Vital Materials Co. Ltd.
- Western Minmetals SC Corp.
- William Rowland Ltd
Explore our company rankings and market positioning Request Free Sample
How can Technavio Assist you in Making Critical Decisions?
What is the Market Structure and Year-over-Year growth of the Market?
|
Market structure |
Concentrated |
|
YoY growth 2023-2024 |
5.5 |
Market Dynamic
The market is a significant segment within the electronic materials industry, catering to the demand for advanced electronic devices and semiconductor manufacturing processes. High purity arsenic is a crucial component in the production of various semiconductor materials, including III-V semiconductors and LEDs. The market is driven by the increasing adoption of advanced electronic devices, wireless communication technology, and mobile device technology. The demand for high-frequency circuit design, radar system design, and IoT business solutions is fueling the growth of this market. Semiconductor manufacturing processes rely heavily on high purity arsenic to produce high-performance semiconductors. These semiconductors are essential in various industries, such as telecommunications, automotive, healthcare, and consumer electronics. The increasing digital transformation across these sectors is driving the demand for high purity arsenic. Moreover, the development of artificial intelligence and machine learning applications is creating new opportunities for high purity arsenic in the semiconductor industry. High purity arsenic is used in the production of advanced electronic devices, which are integral to the functioning of AI and machine learning systems. The market is also witnessing growth due to the increasing focus on business optimization and data-driven decision-making. High purity arsenic is used in data analytics solutions, data management platforms, and sales forecasting tools to help businesses make informed decisions based on data.
Cloud computing solutions are increasingly being adopted by businesses to store and manage their data. High purity arsenic is used in the production of semiconductors that are essential components of cloud computing infrastructure. This trend is expected to continue, driving the growth of the market. Data security is another area where high purity arsenic plays a crucial role. High purity arsenic is used in the production of semiconductors that are used in data security systems. With the increasing amount of data being generated and the need to protect it, the demand for high purity arsenic is expected to grow. In conclusion, the market is expected to grow significantly due to the increasing demand for advanced electronic devices, wireless communication technology, and mobile device technology. The market is also driven by the need for business optimization, data-driven decision-making, and data security. The development of artificial intelligence and machine learning applications is creating new opportunities for high purity arsenic in the semiconductor industry. Our researchers analyzed the data with 2023 as the base year, along with the key drivers, trends, and challenges. A holistic analysis of drivers will help companies refine their marketing strategies to gain a competitive advantage.
What are the Primary Factors Driving the Market Growth?
Increasing demand for high-purity arsenic from developing nations is notably driving market growth. The demand for high purity arsenic is experiencing notable growth, primarily fueled by the expanding industrial sectors in developing countries, such as China and India. These nations are undergoing rapid economic growth and modernization, leading to an increased need for advanced technologies, particularly in the semiconductor and biopharmaceutical industries. High purity arsenic is a crucial component in semiconductor production, making it a highly sought-after material as these countries expand their manufacturing capabilities and technological expertise.
The sales of high purity arsenic are expected to continue growing as these nations invest in research and development to stay competitive in the global market. From a business perspective, this trend presents significant opportunities for suppliers of high purity arsenic. SMEs (Small and Medium Enterprises) can capitalize on this demand by focusing on delivering high-quality products and excellent customer service. Thus, such factors are driving the growth of the market during the forecast period.
What are the Significant Trends being Witnessed in the Market?
Innovation in LED is the key trend in the market. The market is experiencing notable expansion, primarily due to advancements in semiconductor technology. One such innovation is the utilization of high purity arsenic in the production of GaAs (gallium arsenide), a crucial component in radar technology and laser diodes. This material's superior properties enable the creation of more efficient and precise electronic devices. For instance, GaAs is extensively used in radar systems due to its ability to operate at high frequencies, providing enhanced detection capabilities. Furthermore, its application in laser diodes is vital for fiber optic communication, as these diodes convert electrical signals into light for data transmission. In the realm of LED technology, high purity arsenic plays a significant role in the production of LED-on-foil, a groundbreaking innovation in automotive lighting.
This technology, introduced by OSRAM in September 2023, offers unparalleled design flexibility and creativity to car manufacturers. It allows for the creation of unique exterior and interior lighting designs, as well as three-dimensional lighting and animation effects. These features can be utilized to boost brand identity and display dynamic messages and information to drivers and other road users. Thus, such trends will shape the growth of the market during the forecast period.
What are the Major Market Challenges?
Toxicity issues is the major challenge that affects the growth of the market. High purity arsenic is a critical component in the production of power amplifiers used in various electronic devices, including cell phones and wireless devices. The market faces challenges due to the toxic nature of arsenic compounds. Exposure to these compounds can occur through ingestion, inhalation, or contact with the skin. Acute arsenic poisoning can lead to symptoms such as vomiting, abdominal pain, and diarrhea within 30 minutes.
More severe symptoms may include numbness and tingling of the extremities, muscle cramping, and, in extreme cases, death. The toxicity of high purity arsenic poses risks to both workers in the industry and the environment. It is essential to adhere to strict safety protocols during production and handling to minimize exposure. Hence, the above factors will impede the growth of the market during the forecast period
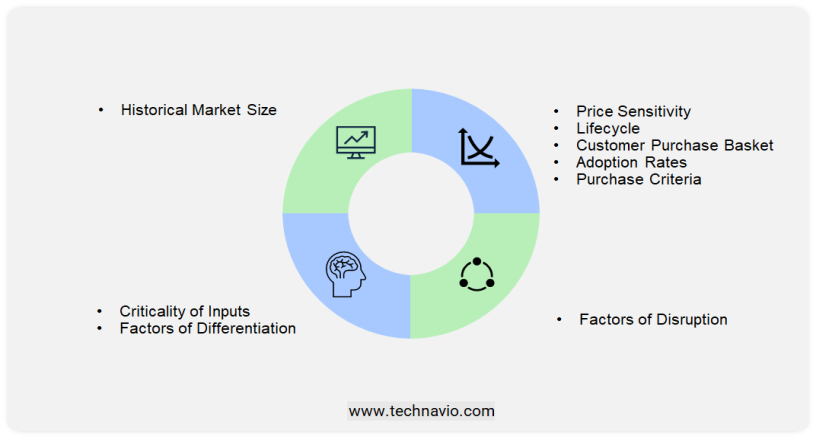
Exclusive Customer Landscape
The market forecasting report includes the adoption lifecycle of the market research and growth, covering from the innovator's stage to the laggard's stage. It focuses on adoption rates in different regions based on penetration. Furthermore, the report also includes key purchase criteria and drivers of price sensitivity to help companies evaluate and develop their market growth analysis strategies.
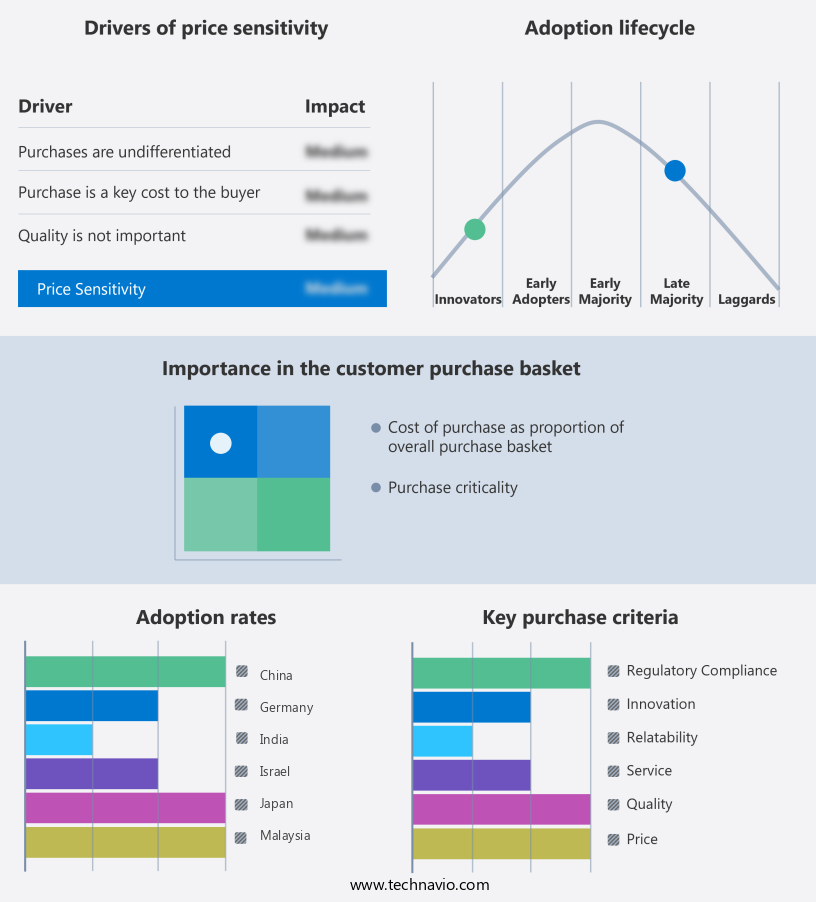
Customer Landscape
Market Analyst Overview
High-purity arsenic is a critical element in the semiconductor industry, particularly in the production of III-V semiconductors. This inorganic compound is essential for manufacturing power amplifiers, laser diodes, and radar technology. The demand for high purity arsenic continues to grow due to the increasing usage in wireless devices, IoT, and digital transformation. Informed business decisions are crucial for companies operating in this market. Big data and machine learning are being leveraged to analyze market trends and consumer behavior. Cloud computing plays a significant role in streamlining business operations and enhancing efficiency. The market is driven by the innovation and development of new technologies. GaAs (gallium arsenide) and III-V semiconductors are key applications for high purity arsenic. These semiconductors are used in various industries, including telecommunications, defense, and automotive. Enterprises are adopting strategies to reduce their carbon footprint and optimize their supply chain.
The integration of renewable energy sources and the use of green technologies are becoming increasingly important. The market is expanding due to its critical role in III-V semiconductor materials and laser diode applications. Data visualization and AI-powered analytics are driving data science and data governance for better customer segmentation and risk management. Market research for electronics and predictive modeling techniques are essential for supply chain optimization and data-driven decision making. Enterprise software tools and cloud migration services are enhancing business strategy and financial modeling, while wireless communication advancements and technology consulting services support business intelligence solutions. Small business technology tools and digital strategy consulting foster marketing automation and improved customer relationship management.
|
Market Scope |
|
|
Report Coverage |
Details |
|
Page number |
205 |
|
Base year |
2023 |
|
Historic period |
2018 - 2022 |
|
Forecast period |
2024-2028 |
|
Growth momentum & CAGR |
Accelerate at a CAGR of 6% |
|
Market growth 2024-2028 |
USD 26.85 thousand |
|
Regional analysis |
APAC, North America, Europe, Middle East and Africa, and South America |
|
Performing market contribution |
APAC at 53% |
|
Key countries |
China, US, Japan, South Korea, Germany, UK, Israel, India, The Netherlands, and Malaysia |
|
Competitive landscape |
Leading Companies, Market Positioning of Companies, Competitive Strategies, and Industry Risks |
|
Key companies profiled |
ALB Materials Inc., American Elements, ATT Advanced elemental materials Co Ltd, FURUKAWA Co. Ltd., Merck KGaA, Noah Chemicals, Otto Chemie Pvt. Ltd., Stanford Materials Corp., Thermo Fisher Scientific Inc., Vital Materials Co. Ltd., Western Minmetals SC Corp., and William Rowland Ltd |
|
Market dynamics |
Parent market analysis, market growth inducers and obstacles, fast-growing and slow-growing segment analysis, AI impact on market trends, COVID-19 impact and recovery analysis and future consumer dynamics, market condition analysis for the market forecast period |
|
Customization purview |
If our market report has not included the data that you are looking for, you can reach out to our analysts and get segments customized. |
What are the Key Data Covered in this Market Research Report?
- CAGR of the market during the forecast period
- Detailed information on factors that will drive the market growth and forecasting between 2024 and 2028
- Precise estimation of the size of the market and its contribution of the market in focus to the parent market
- Accurate predictions about upcoming market growth and trends and changes in consumer behaviour
- Growth of the market across APAC, North America, Europe, Middle East and Africa, and South America
- Thorough analysis of the market's competitive landscape and detailed information about companies
- Comprehensive analysis of factors that will challenge the growth of market companies
 RIA -
RIA - 
