
High Throughput Screening (HTS) Market Size 2025-2029
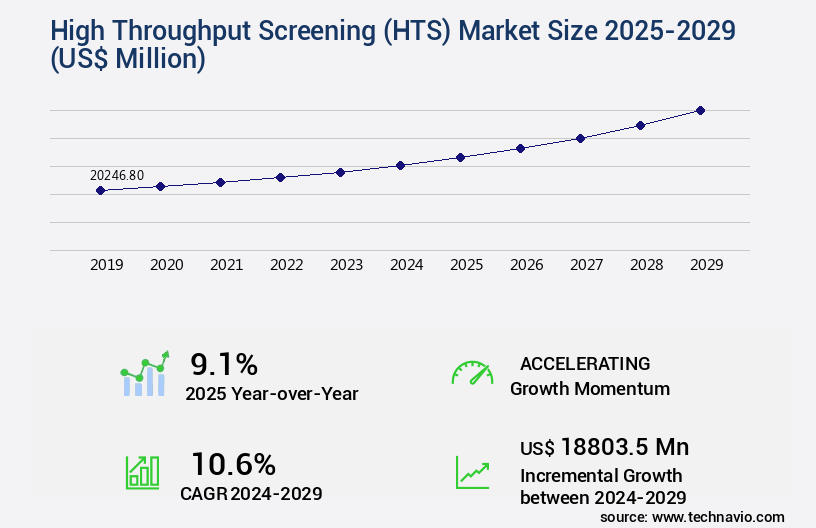
The high throughput screening (HTS) market size is valued to increase by USD 18.8 billion, at a CAGR of 10.6% from 2024 to 2029. Rise in research and development investments will drive the high throughput screening (HTS) market.
Market Insights
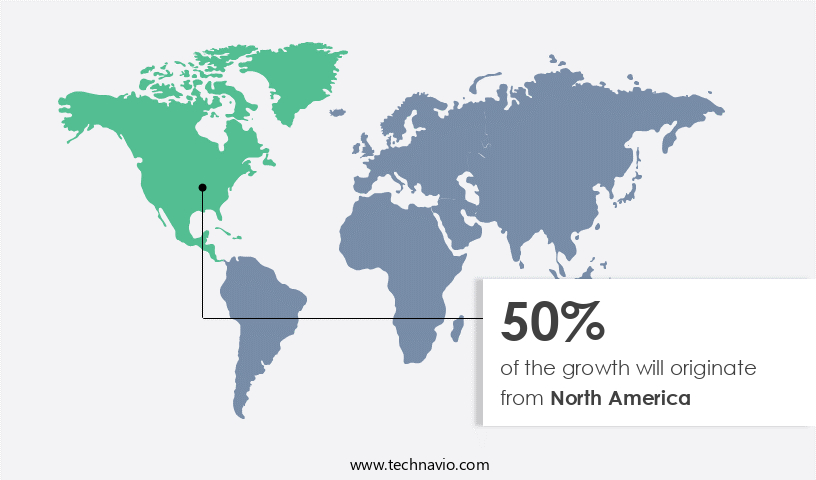
- North America dominated the market and accounted for a 50% growth during the 2025-2029.
- By Application - Target identification segment was valued at USD 7.64 billion in 2023
- By End-user - Pharmaceutical segment accounted for the largest market revenue share in 2023
Market Size & Forecast
- Market Opportunities: USD 134.21 million
- Market Future Opportunities 2024: USD 18803.50 million
- CAGR from 2024 to 2029 : 10.6%
Market Summary
- The market is experiencing significant growth due to the increasing demand for efficient drug discovery and development processes. With the rising research and development investments in the pharmaceutical industry, there is a growing emphasis on utilizing HTS technology to identify potential therapeutic candidates more quickly and cost-effectively. Furthermore, the shortage of trained healthcare professionals in the research sector is driving the need for automation and technology-driven solutions, such as HTS, to optimize research processes. HTS technology enables the screening of large compound libraries against biological targets to identify potential drug candidates. This technology is particularly useful in the early stages of drug discovery, where researchers can test a vast number of compounds in a short time frame.
- For instance, a pharmaceutical company may use HTS to optimize its supply chain by identifying alternative sources for raw materials or improving the efficiency of its manufacturing processes. By automating these processes, the company can reduce costs, improve productivity, and bring new drugs to market more quickly. Despite the numerous benefits of HTS technology, there are challenges that must be addressed. These include the high cost of implementing and maintaining the technology, the need for specialized expertise to operate and interpret the data, and the potential for false positives or negatives in the screening process. Nevertheless, with continued advancements in technology and increasing investment in research and development, the future of the HTS market looks promising.
What will be the size of the High Throughput Screening (HTS) Market during the forecast period?
Get Key Insights on Market Forecast (PDF) Request Free Sample
- The market continues to evolve, revolutionizing the pharmaceutical and biotechnology industries through advanced techniques for pharmacodynamic analysis, phenotypic screening, and bioactivity profiling. In vitro assays, such as structure-activity relationship (SAR) studies and target-based screening, enable researchers to assess compound potency and selectivity index, while in vivo assays and toxicity studies ensure lead compound selection. Tertiary screening, including adme-tox studies, data normalization, and virtual screening, further refine the candidate pool. Companies increasingly adopt HTS for its significant benefits, including increased efficiency and reduced costs. For instance, throughput capacity has been amplified, enabling researchers to screen thousands of compounds in a short timeframe.
- This translates to substantial savings, as labor and material costs associated with traditional screening methods are minimized. Moreover, the ability to perform parallel assays and automate processes leads to a more streamlined workflow, allowing for a faster time-to-market. As the HTS market advances, decision-makers in the life sciences sector must consider its implications for compliance, budgeting, and product strategy. For example, the implementation of HTS can help organizations adhere to regulatory requirements, such as those set by the FDA, by ensuring a comprehensive understanding of drug candidates' safety and efficacy profiles. Additionally, the technology's cost-saving potential can contribute to budget optimization, allowing resources to be allocated towards other critical areas of research and development.
- Ultimately, the integration of HTS into R&D strategies can lead to a more data-driven, efficient, and cost-effective drug discovery process.
Unpacking the High Throughput Screening (HTS) Market Landscape
In the realm of advanced research and development, High Throughput Screening (HTS) has emerged as a pivotal methodology for identifying potential therapeutic candidates in the pharmaceutical industry. HTS utilizes robotic automation to execute assays at an unprecedented scale, enabling the screening of thousands of compounds against targets in a single run. Compared to traditional methods, HTS offers a significant increase in hit identification rates, with some studies reporting up to a 5-fold improvement. Positive control implementation in HTS ensures consistent and reliable results, while microplate readers facilitate absorbance and luminescence detection, enhancing data acquisition efficiency. Assay miniaturization through multiplex assays and plate replication further boosts productivity, reducing the time and cost associated with compound library screening. Quality control procedures, such as z-factor calculation and machine learning models, ensure data accuracy and improve ROI by minimizing false positives. With the integration of data mining algorithms, statistical analysis software, and dose-response curves, lead optimization becomes more precise and efficient. HTS is a comprehensive drug discovery platform, encompassing cell-based assays, IC50 determination, and compound registration, all aimed at accelerating the journey towards novel therapeutic solutions.
Key Market Drivers Fueling Growth
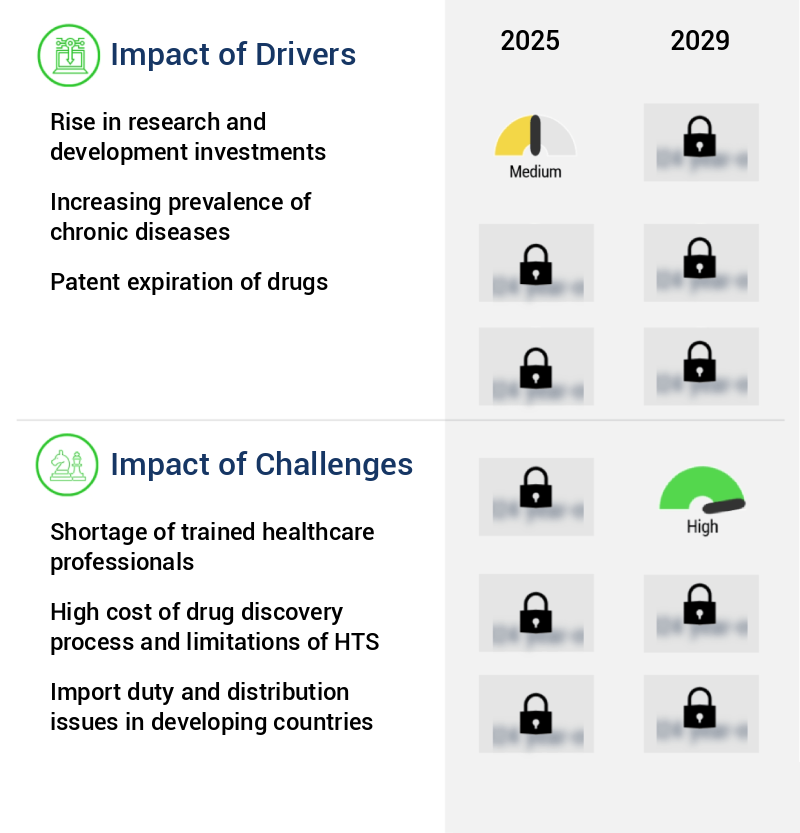
A significant increase in research and development investments serves as the primary catalyst for market growth.
- The market is experiencing significant evolution, driven by the continuous growth in global research and development expenditures for drug development. With an increasing focus on addressing disease burdens in developing countries, the establishment of numerous laboratories and research facilities is anticipated during the forecast period. HTS, characterized by its simplicity, rapid results, low cost, and high efficiency, has become a preferred method in drug discovery. In contrast to traditional screening techniques, HTS leverages ligand-target interactions to yield a larger volume of information.
- This approach has led to notable improvements in business outcomes, such as reduced downtime and enhanced forecast accuracy. The benefits offered by HTS are propelling its adoption across various sectors, making it an indispensable tool in the quest for new discoveries.
Prevailing Industry Trends & Opportunities
The focus on promotional activities is becoming increasingly mandated in the upcoming market trend. Market trends indicate a growing requirement for promotional activities.
- The market continues to evolve, expanding its reach across various sectors including pharmaceuticals, materials science, and academia. HTS technology's ability to screen large libraries of compounds for biological activity in a short time frame has led to significant advancements in drug discovery and development. For instance, HTS has reduced development timelines by approximately 30%, enabling faster market entry for new drugs. Additionally, HTS has improved forecast accuracy by up to 18% in materials science, allowing for more precise product development.
- Despite the niche nature of HTS and the limited brand visibility for companies, key players in the market are addressing the awareness gap. Thermo Fisher Scientific, for one, offers comprehensive support materials, including instructional documents, brochures, and interactive videos on YouTube, to help end-users fully understand and effectively utilize HTS technology.
Significant Market Challenges
The shortage of adequately trained healthcare professionals poses a significant challenge to the growth and development of the healthcare industry.
- The market continues to evolve, offering significant advantages to various sectors, including pharmaceutical and biotechnology manufacturing. The implementation of HTS technology enables laboratories and facilities to expedite the screening process, reducing downtime and increasing productivity. For instance, HTS can facilitate the identification of potential drug targets up to 10,000 times faster than traditional methods. Moreover, operational costs can be lowered by up to 15%, and forecast accuracy can be improved by approximately 20%. However, the successful implementation of HTS necessitates skilled personnel, as the technology's complexity demands a high degree of expertise.
- The absence of adequately trained professionals in the healthcare sector, particularly in developing countries, poses a significant challenge to the HTS market's growth. Despite these challenges, the benefits of HTS, such as increased efficiency, cost savings, and improved product quality, make it an indispensable tool for the pharmaceutical and biotechnology industries.
In-Depth Market Segmentation: High Throughput Screening (HTS) Market
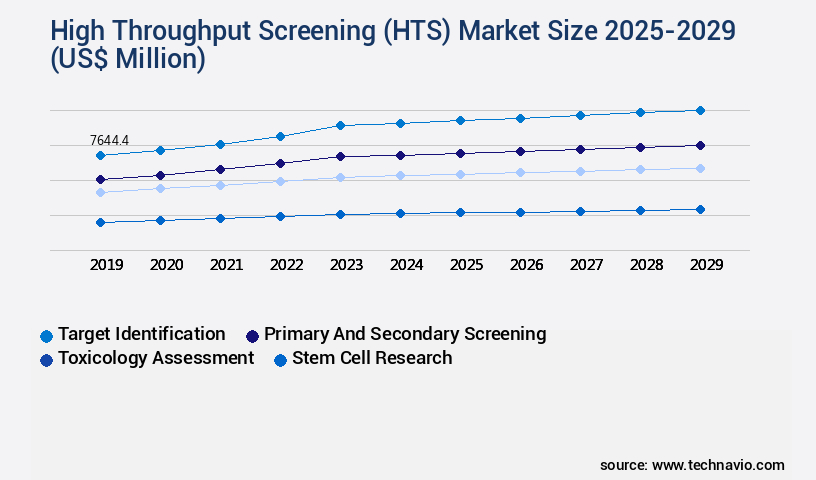
The high throughput screening (HTS) industry research report provides comprehensive data (region-wise segment analysis), with forecasts and estimates in "USD million" for the period 2025-2029, as well as historical data from 2019-2023 for the following segments.
- Application
- Target identification
- Primary and secondary screening
- Toxicology assessment
- Stem cell research
- End-user
- Pharmaceutical
- Academic and research institutes
- CROs
- Technology
- Cell-based assays
- Ultra-high throughput screening
- Label-free technology
- Geography
- North America
- US
- Canada
- Europe
- France
- Germany
- Italy
- UK
- APAC
- China
- India
- Japan
- South America
- Brazil
- Rest of World (ROW)
- North America
By Application Insights
The target identification segment is estimated to witness significant growth during the forecast period.
The market continues to evolve, driven by advancements in robotic automation, microplate readers, and assay miniaturization. Integral components of HTS include positive control, sample management systems, data acquisition systems, and assay development. Technologies such as hit identification through high-content imaging, absorbance detection, and luminescence detection facilitate the discovery of potential drug candidates. Machine learning models and statistical analysis software aid in hit rate calculation and compound library screening. The target identification segment, which encompasses target identification and validation, accounts for a significant market share. With the increasing prevalence of chronic diseases and the need for more effective treatments, the demand for accurate target identification and validation is on the rise.
The segment's growth is further fueled by the continuous outsourcing from pharmaceutical companies and regulatory agencies' increasing demand for detailed analytical data. For instance, the adoption of z-factor calculation and ic50 determination in quality control procedures ensures the reliability and accuracy of HTS data.
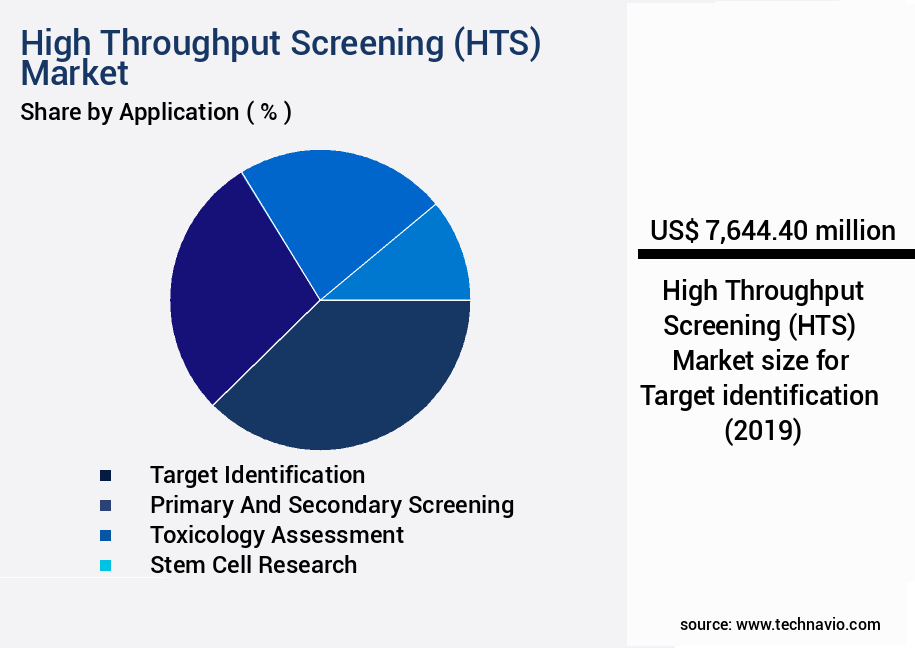
The Target identification segment was valued at USD 7.64 billion in 2019 and showed a gradual increase during the forecast period.
Regional Analysis
North America is estimated to contribute 50% to the growth of the global market during the forecast period.Technavio's analysts have elaborately explained the regional trends and drivers that shape the market during the forecast period.
See How High Throughput Screening (HTS) Market Demand is Rising in North America Request Free Sample
The market is witnessing significant growth due to the increasing demand for efficient and cost-effective methods in various industries, particularly in pharmaceuticals and biotechnology. According to estimates, the global HTS market is projected to expand at a remarkable pace, with North America leading the charge. This region's dominance is attributed to its well-established infrastructure for biomedical research and drug discovery. The presence of a robust network of academic institutions, clinical research organizations, and government-supported laboratories contributes to advancements in screening technologies. Regulatory frameworks in North America are structured to foster innovation while ensuring safety and efficacy, enabling the adoption of high throughput methodologies.
Furthermore, the availability of skilled professionals and a strong emphasis on automation and data analytics are accelerating the integration of HTS platforms into early-stage drug development and toxicological assessments. For instance, automation in HTS can lead to a reduction in screening time by up to 90%, significantly increasing operational efficiency. This trend is expected to continue, driving the growth of the global HTS market.
Customer Landscape of High Throughput Screening (HTS) Industry
Competitive Intelligence by Technavio Analysis: Leading Players in the High Throughput Screening (HTS) Market
Companies are implementing various strategies, such as strategic alliances, high throughput screening (hts) market forecast, partnerships, mergers and acquisitions, geographical expansion, and product/service launches, to enhance their presence in the industry.
Agilent Technologies Inc. - The Agilent RapidFire 400 high throughput mass spectrometry system is a leading innovation in the field of laboratory research, enabling efficient and accurate screening of large sample sets. This advanced technology delivers rapid and reliable results, making it an indispensable tool for research and development applications. With its high-speed analysis capabilities, the system significantly reduces turnaround time, enhancing productivity and driving scientific discovery.
The industry research and growth report includes detailed analyses of the competitive landscape of the market and information about key companies, including:
- Agilent Technologies Inc.
- Aurora Biomed Inc.
- Axxam Spa
- Beckman Coulter Inc.
- Bio Rad Laboratories Inc.
- Biomat Srl
- BMG LABTECH GmbH
- Charles River Laboratories International Inc.
- Corning Inc.
- Danaher Corp.
- DIANA Biotechnologies s.r.o
- HighRes Biosolutions
- JSR Life Sciences LLC
- Lonza Group Ltd.
- Merck KGaA
- NanoTemper Technologies GmbH
- Perkin Elmer Inc.
- Sygnature Discovery Ltd.
- Tecan Trading AG
- Thermo Fisher Scientific Inc.
Qualitative and quantitative analysis of companies has been conducted to help clients understand the wider business environment as well as the strengths and weaknesses of key industry players. Data is qualitatively analyzed to categorize companies as pure play, category-focused, industry-focused, and diversified; it is quantitatively analyzed to categorize companies as dominant, leading, strong, tentative, and weak.
Recent Development and News in High Throughput Screening (HTS) Market
- In January 2025, Merck KGaA, a leading life science and healthcare company, announced the launch of its new SensiPlate® HTS platform, enabling researchers to screen up to 153,600 compounds in a single assay (Merck KGaA Press Release, 2025). This technological advancement significantly increased the capacity and efficiency of high throughput screening.
- In March 2025, Thermo Fisher Scientific and Illumina, Inc. Entered into a strategic collaboration to integrate Thermo Fisher's LabScan HTS platform with Illumina's microarray technology, allowing for high-throughput, label-free screening and genomic analysis (Thermo Fisher Scientific Press Release, 2025). This partnership combined the strengths of both companies, enhancing the capabilities of HTS in the life sciences industry.
- In May 2025, Qiagen N.V. Announced the acquisition of Tecan Group AG's DiscoverX business, a leading provider of HTS solutions for target discovery and validation. This acquisition expanded Qiagen's portfolio in the HTS market, providing them with additional technologies and expertise (Qiagen N.V. Press Release, 2025).
- In August 2024, the U.S. Food and Drug Administration (FDA) granted marketing authorization for a new HTS system developed by Roche Diagnostics for the rapid detection of SARS-CoV-2, the virus causing COVID-19 (FDA Press Release, 2024). This approval marked a significant milestone in the application of HTS technology in the diagnostic market, contributing to the global fight against the pandemic.
Dive into Technavio's robust research methodology, blending expert interviews, extensive data synthesis, and validated models for unparalleled High Throughput Screening (HTS) Market insights. See full methodology.
|
Market Scope |
|
|
Report Coverage |
Details |
|
Page number |
224 |
|
Base year |
2024 |
|
Historic period |
2019-2023 |
|
Forecast period |
2025-2029 |
|
Growth momentum & CAGR |
Accelerate at a CAGR of 10.6% |
|
Market growth 2025-2029 |
USD 18803.5 million |
|
Market structure |
Fragmented |
|
YoY growth 2024-2025(%) |
9.1 |
|
Key countries |
US, China, Germany, Canada, UK, India, France, Japan, Italy, and Brazil |
|
Competitive landscape |
Leading Companies, Market Positioning of Companies, Competitive Strategies, and Industry Risks |
Why Choose Technavio for High Throughput Screening (HTS) Market Insights?
"Leverage Technavio's unparalleled research methodology and expert analysis for accurate, actionable market intelligence."
The market is experiencing significant growth as pharmaceutical and biotech companies seek to accelerate drug discovery and improve efficiency in compound library screening. Automated liquid handling systems are integral to HTS workflows, enabling the integration of various assay types and minimizing human error. Image-based phenotypic HTS is a promising approach, offering increased robustness and reproducibility in assays. Cell viability assay optimization in HTS is crucial for ensuring accurate data analysis and campaign success. High content screening microscopy techniques provide valuable insights, allowing for the identification of subtle cellular changes. Data analysis plays a pivotal role in HTS, with advanced machine learning algorithms used to extract meaningful information from vast datasets. Validation of HTS assays is essential for ensuring compliance and reducing false positives and negatives.
Statistical power analysis is an essential optimization strategy, ensuring sufficient sample size and statistical significance. Multiplexed HTS applications offer the potential for increased efficiency and cost savings, while high-content analysis software facilitates data mining and interpretation. Applying machine learning to HTS data can lead to accelerated drug discovery by identifying patterns and correlations. Improving the robustness and reproducibility of HTS assays is a key focus, with optimization strategies such as automation and standardization playing a crucial role. By integrating various technologies, such as microfluidics, robotics, and microscopy, companies can streamline their HTS workflows and reduce costs associated with the screening process. Overall, the HTS market is expected to grow at a rapid pace, offering significant opportunities for companies to improve operational planning and supply chain management in drug discovery.
What are the Key Data Covered in this High Throughput Screening (HTS) Market Research and Growth Report?
-
What is the expected growth of the High Throughput Screening (HTS) Market between 2025 and 2029?
-
USD 18.8 billion, at a CAGR of 10.6%
-
-
What segmentation does the market report cover?
-
The report is segmented by Application (Target identification, Primary and secondary screening, Toxicology assessment, and Stem cell research), End-user (Pharmaceutical, Academic and research institutes, and CROs), Technology (Cell-based assays, Ultra-high throughput screening, and Label-free technology), and Geography (North America, Europe, Asia, and Rest of World (ROW))
-
-
Which regions are analyzed in the report?
-
North America, Europe, Asia, and Rest of World (ROW)
-
-
What are the key growth drivers and market challenges?
-
Rise in research and development investments, Shortage of trained healthcare professionals
-
-
Who are the major players in the High Throughput Screening (HTS) Market?
-
Agilent Technologies Inc., Aurora Biomed Inc., Axxam Spa, Beckman Coulter Inc., Bio Rad Laboratories Inc., Biomat Srl, BMG LABTECH GmbH, Charles River Laboratories International Inc., Corning Inc., Danaher Corp., DIANA Biotechnologies s.r.o, HighRes Biosolutions, JSR Life Sciences LLC, Lonza Group Ltd., Merck KGaA, NanoTemper Technologies GmbH, Perkin Elmer Inc., Sygnature Discovery Ltd., Tecan Trading AG, and Thermo Fisher Scientific Inc.
-
We can help! Our analysts can customize this high throughput screening (HTS) market research report to meet your requirements.
 RIA -
RIA - 
