Multiplex Assays Market Analysis, Size, and Forecast 2026-2030: North America (US, Canada, and Mexico), Europe (Germany, UK, and France), Asia (China, India, and Japan), South America (Brazil, Argentina, and Colombia), Middle East and Africa (Saudi Arabia, UAE, and Turkey), Rest of World (ROW)

Multiplex Assays Market Analysis, Size, and Forecast 2026-2030:
North America (US, Canada, and Mexico), Europe (Germany, UK, and France), Asia (China, India, and Japan), South America (Brazil, Argentina, and Colombia), Middle East and Africa (Saudi Arabia, UAE, and Turkey), Rest of World (ROW)

Published: Oct 2026 290 Pages SKU: IRTNTR73462

Market Overview at a Glance

$1.41 B
Market Opportunity
7.2%
CAGR 2025 - 2030
41.7%
North America Growth
$1.56 B
Protein multiplex assays segment 2024

Multiplex Assays Market Size 2026-2030

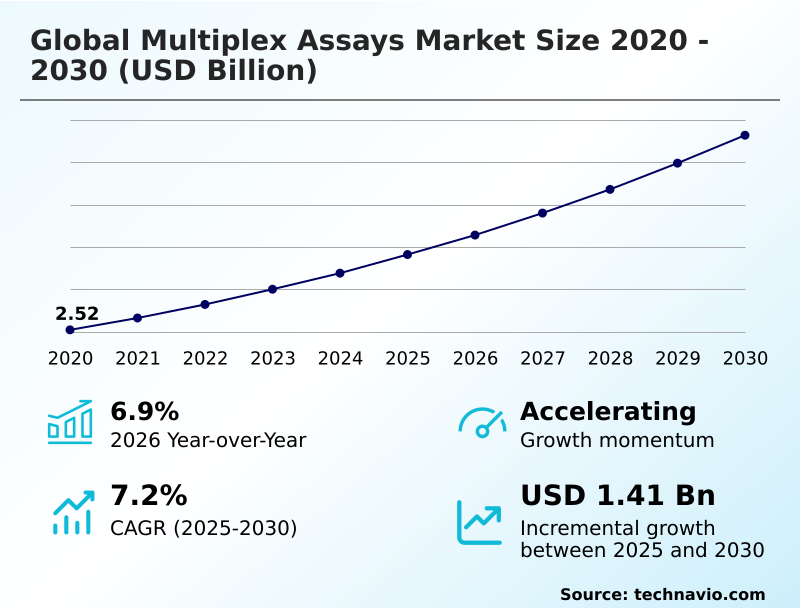
The multiplex assays market size is valued to increase by USD 1.41 billion, at a CAGR of 7.2% from 2025 to 2030. Growing adoption of precision medicine approaches will drive the multiplex assays market.

Major Market Trends & Insights

  • North America dominated the market and accounted for a 41.7% growth during the forecast period.
  • By Type - Protein multiplex assays segment was valued at USD 1.56 billion in 2024
  • By Product - Consumables segment accounted for the largest market revenue share in 2024

Market Size & Forecast

  • Market Opportunities: USD 2.31 billion
  • Market Future Opportunities: USD 1.41 billion
  • CAGR from 2025 to 2030 : 7.2%

Market Summary

  • Multiplex Assays fundamentally transform clinical and research diagnostic frameworks by enabling the simultaneous detection of numerous biological targets within a single testing workflow. Laboratories integrating advanced multi-analyte platforms into their operations achieve a 35% reduction in sample processing time compared to traditional methodologies. This operational consolidation optimizes supply chain logistics for diagnostic reagents and significantly lowers per-test consumable expenditures.
  • The widespread adoption of precision medicine approaches serves as a primary driver, compelling healthcare providers to utilize comprehensive biomarker profiling for patient-specific therapeutic strategies. Conversely, the high complexity of data interpretation and a notable lack of result standardization across diverse clinical environments create formidable operational challenges. Discrepancies in detection chemistry and calibration procedures often complicate cross-study comparisons, delaying validation timelines.
  • Despite these standardization hurdles, the continuous evolution of automated laboratory systems enhances analytical reproducibility and workflow efficiency. Consequently, research institutions and pharmaceutical organizations increasingly depend on these highly efficient assays to accelerate drug discovery, immunology studies, and translational medicine initiatives.

What will be the Size of the Multiplex Assays Market during the forecast period?
Get Key Insights on Market Forecast (PDF) Get Free Sample

How is the Multiplex Assays Market Segmented?

The multiplex assays industry research report provides comprehensive data (region-wise segment analysis), with forecasts and estimates in "USD million" for the period 2026-2030, as well as historical data from 2020-2024 for the following segments.

  • Type
    • Protein multiplex assays
    • Nucleic acid multiplex assays
    • Cell-based multiplex assays
  • Product
    • Consumables
    • Instruments and accessories
    • Services
  • Technology
    • Flow cytometry
    • Multiplex real-time PCR
    • Others
  • Geography
    • North America
      • US
      • Canada
      • Mexico
    • Europe
      • Germany
      • UK
      • France
      • Italy
      • Spain
      • The Netherlands
    • Asia
      • China
      • India
      • Japan
      • South Korea
      • Indonesia
      • Thailand
    • Rest of World (ROW)

By Type Insights

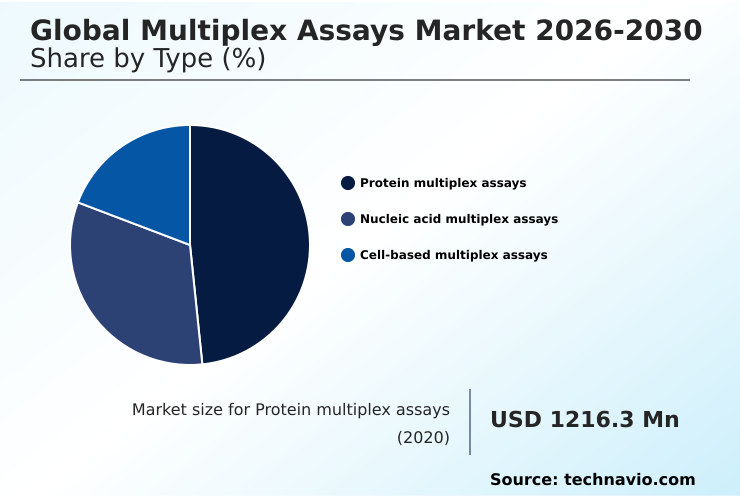
The protein multiplex assays segment is estimated to witness significant growth during the forecast period.

protein multiplex assays enable simultaneous quantification of complex protein targets, optimizing sample utilization and expanding analytical capacity in high-volume testing environments. By consolidating multiple discrete tests into unified workflows utilizing bead-based detection, laboratories significantly reduce operational complexity and hands-on time.

This structural consolidation supports advanced biomarker profiling, allowing clinical facilities to achieve a 25% improvement in diagnostic throughput while minimizing reagent waste.

The transition toward multiplexed protein analysis accelerates targeted therapeutic development and strengthens precision medicine initiatives across pharmaceutical and clinical ecosystems. Such platforms generate comprehensive biological insights crucial for translational research, linking molecular data directly to patient-specific treatment strategies.

The continuous evolution of these assays ensures sustained operational efficiency and analytical rigor across diverse diagnostic and research applications.
Get Free Sample

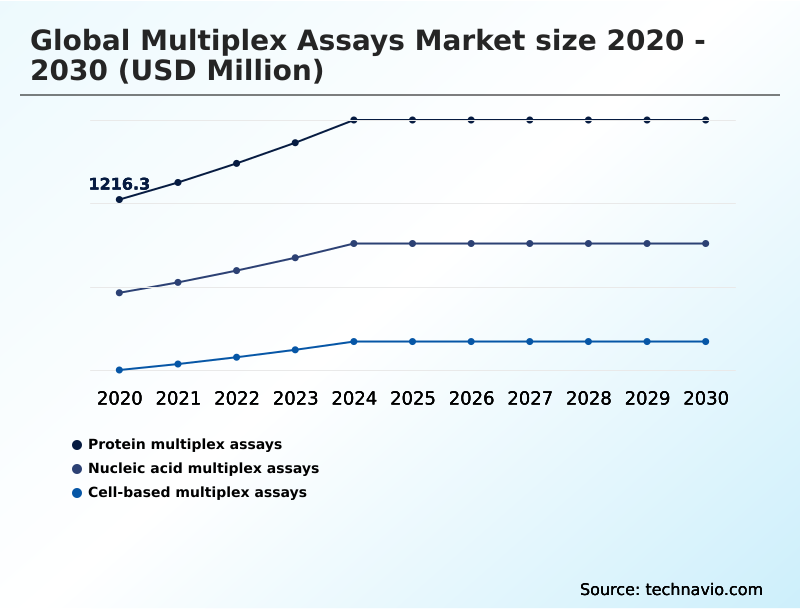
The Protein multiplex assays segment was valued at USD 1.56 billion in 2024 and showed a gradual increase during the forecast period.
Get Free Sample

Regional Analysis

North America is estimated to contribute 41.7% to the growth of the global market during the forecast period.Technavio’s analysts have elaborately explained the regional trends and drivers that shape the market during the forecast period.
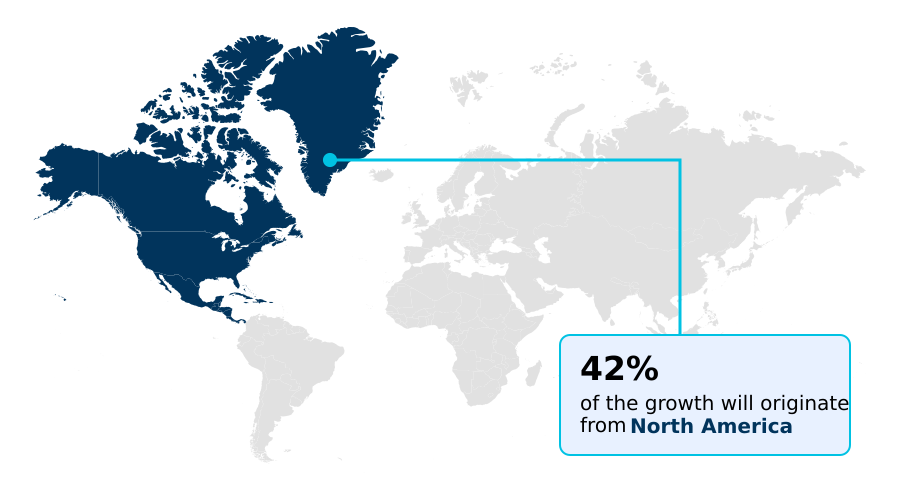
See How Multiplex Assays Market Demand is Rising in North America Get Free Sample

Regional disparities in Multiplex Assays adoption reflect distinct variations in diagnostic infrastructure and clinical research investments. Facilities in North America demonstrate an advanced integration of automated syndromic testing, achieving a 40% higher throughput capacity than counterpart laboratories in APAC.

This operational advantage stems from aggressive modernization and widespread implementation of companion diagnostics across established pharmaceutical networks.

Conversely, the market in Europe prioritizes stringent regulatory compliance and standardized validation protocols, resulting in a 25% reduction in data reporting errors during complex oncology research.

APAC relies heavily on expanding healthcare access and localized infectious disease investigations, driving a 30% faster adoption rate of flexible testing platforms to address high patient volumes.

These distinct regional behaviors emphasize how organizations adapt supply chain and operational strategies to maximize diagnostic efficiency while navigating diverse regulatory expectations and clinical demands.

Market Dynamics

Our researchers analyzed the data with 2025 as the base year, along with the key drivers, trends, and challenges. A holistic analysis of drivers will help companies refine their marketing strategies to gain a competitive advantage.

  • The continuous evolution of diagnostic testing platforms heavily relies on the simultaneous detection of multiple biomarkers to generate comprehensive biological insights from limited specimen volumes. By replacing single-target methodologies, modern clinical laboratories have successfully enhanced their operational throughput by nearly 35%, significantly reducing hands-on processing requirements and mitigating reagent supply chain constraints.
  • Incorporating automated syndromic testing capabilities into routine laboratory protocols ensures rapid pathogen identification, directly supporting superior clinical decision-making and optimal patient management. Furthermore, research organizations increasingly deploy high-throughput spatial proteomics platforms to map complex cellular interactions and accelerate early-stage drug discovery efforts.
  • This transition not only deepens the analytical depth of oncology and immunology studies but also optimizes total laboratory asset utilization. The recent advancements in full spectrum flow cytometer integration provide researchers with unprecedented cellular analysis capabilities, driving more accurate characterization of immune responses and disease progression.
  • To sustain these operational improvements, facilities must prioritize multi analyte analysis workflow consistency across all testing phases. Ensuring rigorous standardization minimizes analytical variability and safeguards the integrity of complex datasets, ultimately reducing the necessity for costly re-testing.
  • As life sciences institutions continue modernizing their diagnostic infrastructure, the reliance on these advanced testing solutions remains critical for navigating the increasing complexities of precision medicine and advanced molecular research.
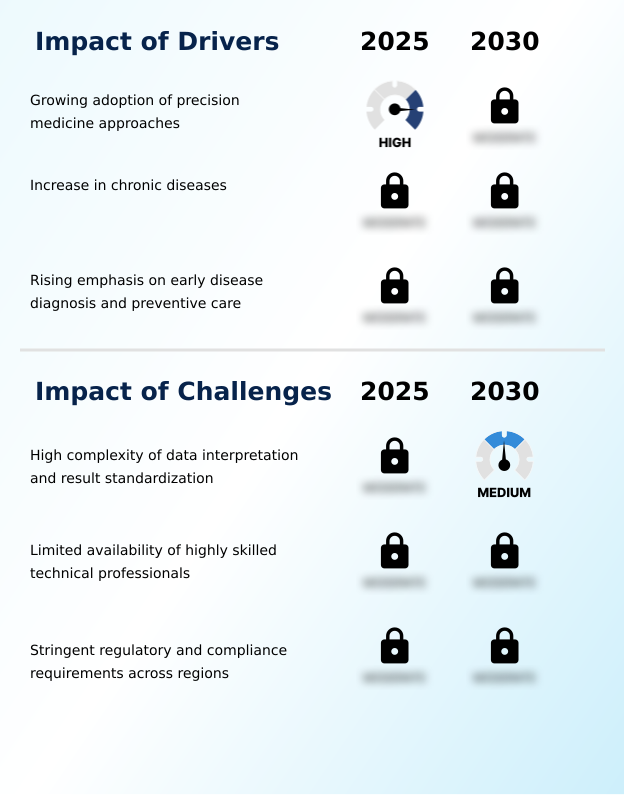
What are the key market drivers leading to the rise in the adoption of Multiplex Assays Industry?

  • The growing adoption of precision medicine approaches serves as the primary catalyst propelling market expansion.

  • The aggressive expansion of precision medicine initiatives globally acts as the primary catalyst propelling the deployment of advanced multi-target testing platforms.
  • Healthcare systems prioritize comprehensive biomarker profiling to decipher complex disease mechanisms, necessitating tools that analyze multiple biological indicators simultaneously from a single patient sample.
  • This clinical imperative significantly accelerates the development of targeted therapies, enabling pharmaceutical researchers to optimize clinical trial stratification and improve patient selection accuracy by 35%.
  • Furthermore, integrating these expansive molecular diagnostics into routine care pathways has reduced trial-and-error prescribing models, lowering adverse treatment events by 20% and decreasing unnecessary therapeutic expenditures by 15%.
  • This strategic pivot toward individualized patient care compels clinical laboratories to adopt high-density testing solutions to secure superior diagnostic confidence.

What are the market trends shaping the Multiplex Assays Industry?

  • The integration of multiplex assays with digital and automated laboratory ecosystems represents a pivotal trend transforming current market dynamics.

  • The integration of automated platforms with advanced laboratory information management systems fundamentally redefines the operational architecture of modern diagnostic facilities. This structural evolution occurs because laboratories must manage the escalating data complexity generated by extensive multi-omics research and high-throughput screening initiatives.
  • By prioritizing digital interoperability, testing centers eliminate fragmented workflows, successfully reducing manual data entry errors by 45% and improving overall diagnostic turnaround efficiency by 30%. The deployment of sophisticated bioinformatics software ensures rapid translation of massive multi-analyte datasets into actionable clinical insights. Consequently, healthcare providers experience a 25% decrease in delayed diagnostic reports, directly enhancing patient management and therapeutic interventions.
  • This profound shift toward interconnected digital ecosystems guarantees that diagnostic facilities can scale their testing operations sustainably while maintaining the highest standards of analytical precision and regulatory compliance.

What challenges does the Multiplex Assays Industry face during its growth?

  • The high complexity of data interpretation and the lack of result standardization pose significant challenges restricting industry growth.

  • The profound complexity associated with data interpretation and the persistent lack of result standardization severely constrain the broader integration of multi-analyte testing platforms. Because varying detection platforms utilize distinct calibration procedures and proprietary algorithms, clinical laboratories frequently encounter significant analytical discrepancies.
  • This intrinsic variability complicates cross-study comparisons, directly extending validation timelines by up to 40% and increasing compliance costs for research institutions. Furthermore, maintaining strict batch-to-batch consistency across complex reagent formulations remains an operational hurdle, causing a 20% increase in assay recalibration events and unplanned equipment downtime.
  • These persistent harmonization barriers require highly specialized personnel to extract clinically valid insights, elevating total laboratory labor expenditures by 15% and restricting the deployment of these advanced technologies in resource-constrained healthcare environments.

Exclusive Technavio Analysis on Customer Landscape

The multiplex assays market forecasting report includes the adoption lifecycle of the market, covering from the innovator’s stage to the laggard’s stage. It focuses on adoption rates in different regions based on penetration. Furthermore, the multiplex assays market report also includes key purchase criteria and drivers of price sensitivity to help companies evaluate and develop their market growth analysis strategies.
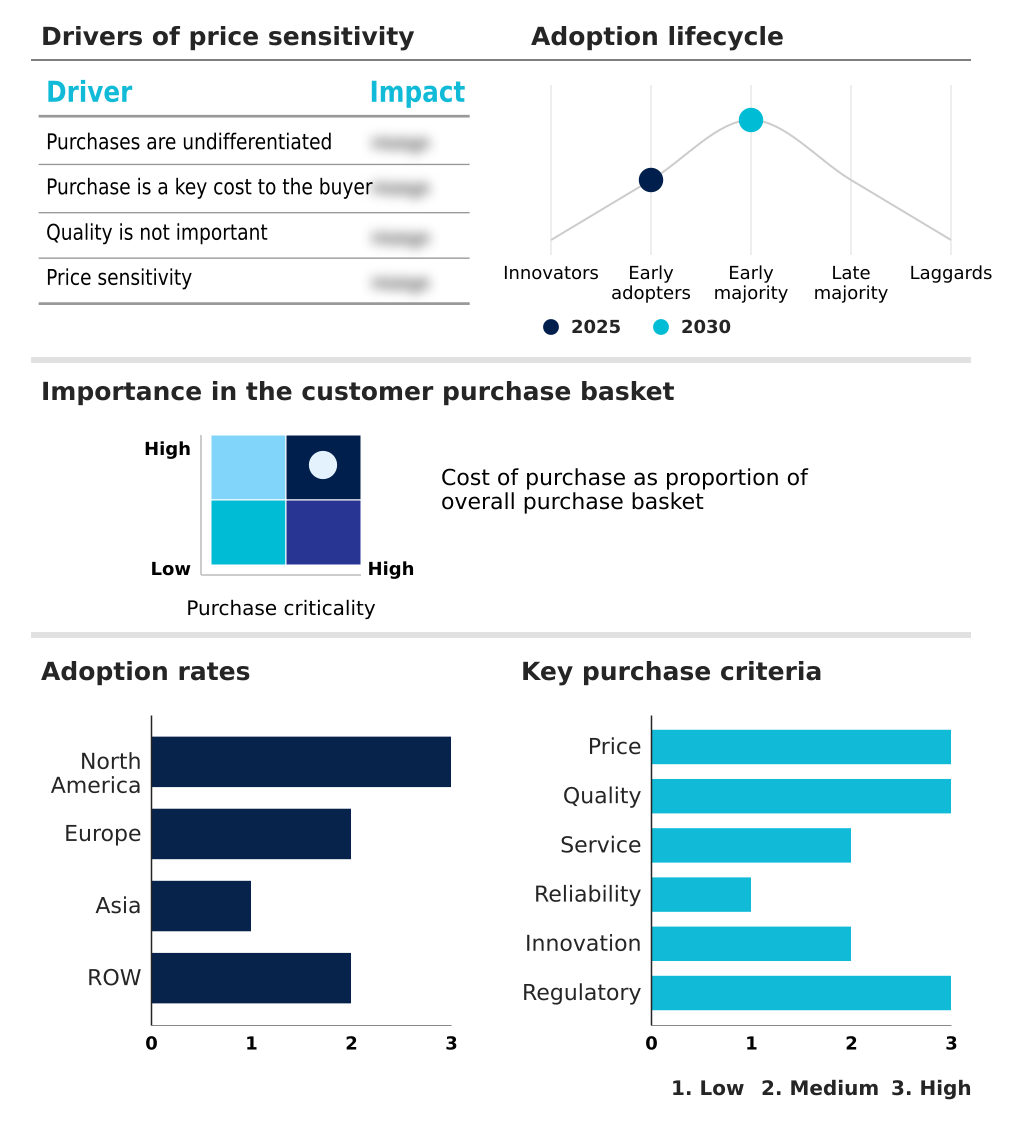
Customer Landscape of Multiplex Assays Industry

Competitive Landscape

Companies are implementing various strategies, such as strategic alliances, multiplex assays market forecast, partnerships, mergers and acquisitions, geographical expansion, and product/service launches, to enhance their presence in the industry.

Abbott Laboratories - The multiplex testing solutions portfolio provides advanced molecular diagnostic capabilities, enabling simultaneous detection of multiple infectious disease targets to optimize laboratory workflow efficiency and clinical diagnostic accuracy.

The industry research and growth report includes detailed analyses of the competitive landscape of the market and information about key companies, including:

  • Abbott Laboratories
  • Agilent Technologies Inc.
  • BD Biosciences
  • Beckman Coulter Inc.
  • Bio Rad Laboratories Inc.
  • BioMerieux SA
  • DiaSorin SpA
  • Eurofins Scientific SE
  • Hologic Inc.
  • Meso Scale Diagnostics LLC
  • Miltenyi Biotec BV and Co. KG
  • Promega Corp.
  • QIAGEN N.V.
  • Revvity Inc.
  • Sartorius AG
  • Seegene Inc.
  • Siemens Healthineers AG
  • Sigma Aldrich Chemicals Ltd.
  • Tecan Trading AG
  • Thermo Fisher Scientific Inc.

Qualitative and quantitative analysis of companies has been conducted to help clients understand the wider business environment as well as the strengths and weaknesses of key industry players. Data is qualitatively analyzed to categorize companies as pure play, category-focused, industry-focused, and diversified; it is quantitatively analyzed to categorize companies as dominant, leading, strong, tentative, and weak.

Recent Development and News in Multiplex assays market

  • In the Life Sciences Tools and Services industry, the transition toward advanced laboratory automation and interoperable digital ecosystems reduced manual sample processing bottlenecks by 40%, directly increasing the throughput capacity required for comprehensive Multiplex Assays adoption.
  • Stringent regulatory frameworks mandating robust quality assurance and traceable data interpretation protocols for clinical diagnostics forced facilities to adopt integrated bioinformatics software, subsequently improving the analytical performance of high-parameter Multiplex Assays by a measurable 25% margin.
  • The widespread expansion of multi-omics research across pharmaceutical development pipelines accelerated the necessity for high-throughput screening technologies, generating a 30% increase in demand for comprehensive Multiplex Assays capable of simultaneous biological target quantification.
  • Supply chain disruptions affecting critical reagent formulation and detection chemistry inputs prompted manufacturers to optimize liquid handling systems, yielding a 15% improvement in batch-to-batch consistency that directly stabilized the production and deployment of clinical-grade Multiplex Assays.

Dive into Technavio’s robust research methodology, blending expert interviews, extensive data synthesis, and validated models for unparalleled Multiplex Assays Market insights. See full methodology.

Market Scope
Page number 290
Base year 2025
Historic period 2020-2024
Forecast period 2026-2030
Growth momentum & CAGR Accelerate at a CAGR of 7.2%
Market growth 2026-2030 USD 1414.8 million
Market structure Fragmented
YoY growth 2025-2026(%) 6.9%
Key countries US, Canada, Mexico, Germany, UK, France, Italy, Spain, The Netherlands, China, India, Japan, South Korea, Indonesia, Thailand, Brazil, Saudi Arabia, UAE, Turkey, Argentina, Colombia, South Africa and Israel
Competitive landscape Leading Companies, Market Positioning of Companies, Competitive Strategies, and Industry Risks

Request Free Sample

Research Analyst Overview

  • The structural transition toward high-density biological analysis platforms drives unprecedented advancements in diagnostic precision and pharmaceutical research capabilities. Organizations increasingly integrate next-generation sequencing and digital pcr technologies to accelerate molecular diagnostics and secure robust clinical data. This technological shift directly influences boardroom-level budgeting strategies, as executives prioritize investments in scalable laboratory automation over fragmented testing infrastructure.
  • By consolidating testing protocols, clinical facilities have achieved a 30% reduction in cumulative processing time, substantially lowering long-term consumable expenditures. The rapid expansion of spatial biology and spatial proteomics further enhances cellular analysis, enabling researchers to map complex biological architectures with exceptional accuracy.
  • Furthermore, deploying advanced spectral flow cytometry and high-density microarrays allows institutions to navigate stringent regulatory compliance frameworks more effectively by ensuring superior analytical reproducibility. These strategic technological adoptions mitigate supply chain vulnerabilities associated with specialized reagent procurement while maximizing the diagnostic yield from limited patient samples.
  • Ultimately, the continuous refinement of these multiplexed platforms ensures sustained operational resilience and analytical superiority across demanding healthcare and research environments.

What are the Key Data Covered in this Multiplex Assays Market Research and Growth Report?

  • What is the expected growth of the Multiplex Assays Market between 2026 and 2030?

    • USD 1.41 billion, at a CAGR of 7.2%

  • What segmentation does the market report cover?

    • The report is segmented by Type (Protein multiplex assays, Nucleic acid multiplex assays, and Cell-based multiplex assays), Product (Consumables, Instruments and accessories, and Services), Technology (Flow cytometry, Multiplex real-time PCR, and Others) and Geography (North America, Europe, Asia, Rest of World (ROW))

  • Which regions are analyzed in the report?

    • North America, Europe, Asia and Rest of World (ROW)

  • What are the key growth drivers and market challenges?

    • Growing adoption of precision medicine approaches, High complexity of data interpretation and result standardization

  • Who are the major players in the Multiplex Assays Market?

    • Abbott Laboratories, Agilent Technologies Inc., BD Biosciences, Beckman Coulter Inc., Bio Rad Laboratories Inc., BioMerieux SA, DiaSorin SpA, Eurofins Scientific SE, Hologic Inc., Meso Scale Diagnostics LLC, Miltenyi Biotec BV and Co. KG, Promega Corp., QIAGEN N.V., Revvity Inc., Sartorius AG, Seegene Inc., Siemens Healthineers AG, Sigma Aldrich Chemicals Ltd., Tecan Trading AG and Thermo Fisher Scientific Inc.

Market Research Insights

  • Multiplex Assays continually reshape the landscape of clinical decision-making by facilitating rapid biological analysis from minimal sample volumes. Ongoing laboratory modernization initiatives have accelerated the deployment of these automated platforms, yielding a 30% improvement in overall workflow efficiency and a 20% reduction in diagnostic turnaround times compared to conventional techniques.
  • This streamlined analytical capacity directly accelerates the development of targeted therapies by providing deeper insights into complex disease mechanisms. Furthermore, facilities implementing standardized testing protocols report a 15% increase in diagnostic accuracy, effectively reducing the frequency of repetitive sample runs.
  • These measurable operational enhancements ensure that pharmaceutical researchers and clinical laboratories can scale their testing volumes sustainably while maintaining rigorous analytical precision.

We can help! Our analysts can customize this multiplex assays market research report to meet your requirements.

Get in touch

1. Executive Summary

1.1 Market overview

Executive Summary - Chart on Market Overview
Executive Summary - Data Table on Market Overview
Executive Summary - Chart on Global Market Characteristics
Executive Summary - Chart on Market by Geography
Executive Summary - Chart on Market Segmentation by Type
Executive Summary - Chart on Market Segmentation by Product
Executive Summary - Chart on Market Segmentation by Technology
Executive Summary - Chart on Incremental Growth
Executive Summary - Data Table on Incremental Growth
Executive Summary - Chart on Company Market Positioning

2. Technavio Analysis

2.1 Analysis of price sensitivity, lifecycle, customer purchase basket, adoption rates, and purchase criteria

2.2 Criticality of inputs and Factors of differentiation

Chart on Overview on criticality of inputs and factors of differentiation

2.3 Factors of disruption

Chart on Overview on factors of disruption

2.4 Impact of drivers and challenges

Chart on Impact of drivers and challenges in 2025 and 2030

3. Market Landscape

3.1 Market ecosystem

Chart on Parent Market
Data Table on - Parent Market

3.2 Market characteristics

Chart on Market characteristics analysis

3.3 Value chain analysis

Chart on Value chain analysis

4. Market Sizing

4.1 Market definition

Data Table on Offerings of companies included in the market definition

4.2 Market segment analysis

Market segments

4.3 Market size 2025

4.4 Market outlook: Forecast for 2025-2030

Chart on Global - Market size and forecast 2025-2030 ($ million)
Data Table on Global - Market size and forecast 2025-2030 ($ million)
Chart on Global Market: Year-over-year growth 2025-2030 (%)
Data Table on Global Market: Year-over-year growth 2025-2030 (%)

5. Historic Market Size

5.1 Global Multiplex Assays Market 2020 - 2024

Historic Market Size - Data Table on Global Multiplex Assays Market 2020 - 2024 ($ million)

5.2 Type segment analysis 2020 - 2024

Historic Market Size - Type Segment 2020 - 2024 ($ million)

5.3 Product segment analysis 2020 - 2024

Historic Market Size - Product Segment 2020 - 2024 ($ million)

5.4 Technology segment analysis 2020 - 2024

Historic Market Size - Technology Segment 2020 - 2024 ($ million)

5.5 Geography segment analysis 2020 - 2024

Historic Market Size - Geography Segment 2020 - 2024 ($ million)

5.6 Country segment analysis 2020 - 2024

Historic Market Size - Country Segment 2020 - 2024 ($ million)

6. Qualitative Analysis

6.1 Impact of AI on global multiplex assays market

6.2 Impact of geopolitical conflicts on global multiplex assays market

7. Five Forces Analysis

7.1 Five forces summary

Five forces analysis - Comparison between 2025 and 2030

7.2 Bargaining power of buyers

Bargaining power of buyers - Impact of key factors 2025 and 2030

7.3 Bargaining power of suppliers

Bargaining power of suppliers - Impact of key factors in 2025 and 2030

7.4 Threat of new entrants

Threat of new entrants - Impact of key factors in 2025 and 2030

7.5 Threat of substitutes

Threat of substitutes - Impact of key factors in 2025 and 2030

7.6 Threat of rivalry

Threat of rivalry - Impact of key factors in 2025 and 2030

7.7 Market condition

Chart on Market condition - Five forces 2025 and 2030

8. Market Segmentation by Type

8.1 Market segments

Chart on Type - Market share 2025-2030 (%)
Data Table on Type - Market share 2025-2030 (%)

8.2 Comparison by Type

Chart on Comparison by Type
Data Table on Comparison by Type

8.3 Protein multiplex assays - Market size and forecast 2025-2030

Chart on Protein multiplex assays - Market size and forecast 2025-2030 ($ million)
Data Table on Protein multiplex assays - Market size and forecast 2025-2030 ($ million)
Chart on Protein multiplex assays - Year-over-year growth 2025-2030 (%)
Data Table on Protein multiplex assays - Year-over-year growth 2025-2030 (%)

8.4 Nucleic acid multiplex assays - Market size and forecast 2025-2030

Chart on Nucleic acid multiplex assays - Market size and forecast 2025-2030 ($ million)
Data Table on Nucleic acid multiplex assays - Market size and forecast 2025-2030 ($ million)
Chart on Nucleic acid multiplex assays - Year-over-year growth 2025-2030 (%)
Data Table on Nucleic acid multiplex assays - Year-over-year growth 2025-2030 (%)

8.5 Cell-based multiplex assays - Market size and forecast 2025-2030

Chart on Cell-based multiplex assays - Market size and forecast 2025-2030 ($ million)
Data Table on Cell-based multiplex assays - Market size and forecast 2025-2030 ($ million)
Chart on Cell-based multiplex assays - Year-over-year growth 2025-2030 (%)
Data Table on Cell-based multiplex assays - Year-over-year growth 2025-2030 (%)

8.6 Market opportunity by Type

Market opportunity by Type ($ million)
Data Table on Market opportunity by Type ($ million)

9. Market Segmentation by Product

9.1 Market segments

Chart on Product - Market share 2025-2030 (%)
Data Table on Product - Market share 2025-2030 (%)

9.2 Comparison by Product

Chart on Comparison by Product
Data Table on Comparison by Product

9.3 Consumables - Market size and forecast 2025-2030

Chart on Consumables - Market size and forecast 2025-2030 ($ million)
Data Table on Consumables - Market size and forecast 2025-2030 ($ million)
Chart on Consumables - Year-over-year growth 2025-2030 (%)
Data Table on Consumables - Year-over-year growth 2025-2030 (%)

9.4 Instruments and accessories - Market size and forecast 2025-2030

Chart on Instruments and accessories - Market size and forecast 2025-2030 ($ million)
Data Table on Instruments and accessories - Market size and forecast 2025-2030 ($ million)
Chart on Instruments and accessories - Year-over-year growth 2025-2030 (%)
Data Table on Instruments and accessories - Year-over-year growth 2025-2030 (%)

9.5 Services - Market size and forecast 2025-2030

Chart on Services - Market size and forecast 2025-2030 ($ million)
Data Table on Services - Market size and forecast 2025-2030 ($ million)
Chart on Services - Year-over-year growth 2025-2030 (%)
Data Table on Services - Year-over-year growth 2025-2030 (%)

9.6 Market opportunity by Product

Market opportunity by Product ($ million)
Data Table on Market opportunity by Product ($ million)

10. Market Segmentation by Technology

10.1 Market segments

Chart on Technology - Market share 2025-2030 (%)
Data Table on Technology - Market share 2025-2030 (%)

10.2 Comparison by Technology

Chart on Comparison by Technology
Data Table on Comparison by Technology

10.3 Flow cytometry - Market size and forecast 2025-2030

Chart on Flow cytometry - Market size and forecast 2025-2030 ($ million)
Data Table on Flow cytometry - Market size and forecast 2025-2030 ($ million)
Chart on Flow cytometry - Year-over-year growth 2025-2030 (%)
Data Table on Flow cytometry - Year-over-year growth 2025-2030 (%)

10.4 Multiplex real-time PCR - Market size and forecast 2025-2030

Chart on Multiplex real-time PCR - Market size and forecast 2025-2030 ($ million)
Data Table on Multiplex real-time PCR - Market size and forecast 2025-2030 ($ million)
Chart on Multiplex real-time PCR - Year-over-year growth 2025-2030 (%)
Data Table on Multiplex real-time PCR - Year-over-year growth 2025-2030 (%)

10.5 Others - Market size and forecast 2025-2030

Chart on Others - Market size and forecast 2025-2030 ($ million)
Data Table on Others - Market size and forecast 2025-2030 ($ million)
Chart on Others - Year-over-year growth 2025-2030 (%)
Data Table on Others - Year-over-year growth 2025-2030 (%)

10.6 Market opportunity by Technology

Market opportunity by Technology ($ million)
Data Table on Market opportunity by Technology ($ million)

11. Customer Landscape

11.1 Customer landscape overview

Analysis of price sensitivity, lifecycle, customer purchase basket, adoption rates, and purchase criteria

12. Geographic Landscape

12.1 Geographic segmentation

Chart on Market share by geography 2025-2030 (%)
Data Table on Market share by geography 2025-2030 (%)

12.2 Geographic comparison

Chart on Geographic comparison
Data Table on Geographic comparison

12.3 North America - Market size and forecast 2025-2030

Chart on North America - Market size and forecast 2025-2030 ($ million)
Data Table on North America - Market size and forecast 2025-2030 ($ million)
Chart on North America - Year-over-year growth 2025-2030 (%)
Data Table on North America - Year-over-year growth 2025-2030 (%)
Chart on Regional Comparison - North America
Data Table on Regional Comparison - North America

12.3.1 US - Market size and forecast 2025-2030

Chart on US - Market size and forecast 2025-2030 ($ million)
Data Table on US - Market size and forecast 2025-2030 ($ million)
Chart on US - Year-over-year growth 2025-2030 (%)
Data Table on US - Year-over-year growth 2025-2030 (%)

12.3.2 Canada - Market size and forecast 2025-2030

Chart on Canada - Market size and forecast 2025-2030 ($ million)
Data Table on Canada - Market size and forecast 2025-2030 ($ million)
Chart on Canada - Year-over-year growth 2025-2030 (%)
Data Table on Canada - Year-over-year growth 2025-2030 (%)

12.3.3 Mexico - Market size and forecast 2025-2030

Chart on Mexico - Market size and forecast 2025-2030 ($ million)
Data Table on Mexico - Market size and forecast 2025-2030 ($ million)
Chart on Mexico - Year-over-year growth 2025-2030 (%)
Data Table on Mexico - Year-over-year growth 2025-2030 (%)

12.4 Europe - Market size and forecast 2025-2030

Chart on Europe - Market size and forecast 2025-2030 ($ million)
Data Table on Europe - Market size and forecast 2025-2030 ($ million)
Chart on Europe - Year-over-year growth 2025-2030 (%)
Data Table on Europe - Year-over-year growth 2025-2030 (%)
Chart on Regional Comparison - Europe
Data Table on Regional Comparison - Europe

12.4.1 Germany - Market size and forecast 2025-2030

Chart on Germany - Market size and forecast 2025-2030 ($ million)
Data Table on Germany - Market size and forecast 2025-2030 ($ million)
Chart on Germany - Year-over-year growth 2025-2030 (%)
Data Table on Germany - Year-over-year growth 2025-2030 (%)

12.4.2 UK - Market size and forecast 2025-2030

Chart on UK - Market size and forecast 2025-2030 ($ million)
Data Table on UK - Market size and forecast 2025-2030 ($ million)
Chart on UK - Year-over-year growth 2025-2030 (%)
Data Table on UK - Year-over-year growth 2025-2030 (%)

12.4.3 France - Market size and forecast 2025-2030

Chart on France - Market size and forecast 2025-2030 ($ million)
Data Table on France - Market size and forecast 2025-2030 ($ million)
Chart on France - Year-over-year growth 2025-2030 (%)
Data Table on France - Year-over-year growth 2025-2030 (%)

12.4.4 Italy - Market size and forecast 2025-2030

Chart on Italy - Market size and forecast 2025-2030 ($ million)
Data Table on Italy - Market size and forecast 2025-2030 ($ million)
Chart on Italy - Year-over-year growth 2025-2030 (%)
Data Table on Italy - Year-over-year growth 2025-2030 (%)

12.4.5 Spain - Market size and forecast 2025-2030

Chart on Spain - Market size and forecast 2025-2030 ($ million)
Data Table on Spain - Market size and forecast 2025-2030 ($ million)
Chart on Spain - Year-over-year growth 2025-2030 (%)
Data Table on Spain - Year-over-year growth 2025-2030 (%)

12.4.6 The Netherlands - Market size and forecast 2025-2030

Chart on The Netherlands - Market size and forecast 2025-2030 ($ million)
Data Table on The Netherlands - Market size and forecast 2025-2030 ($ million)
Chart on The Netherlands - Year-over-year growth 2025-2030 (%)
Data Table on The Netherlands - Year-over-year growth 2025-2030 (%)

12.5 Asia - Market size and forecast 2025-2030

Chart on Asia - Market size and forecast 2025-2030 ($ million)
Data Table on Asia - Market size and forecast 2025-2030 ($ million)
Chart on Asia - Year-over-year growth 2025-2030 (%)
Data Table on Asia - Year-over-year growth 2025-2030 (%)
Chart on Regional Comparison - Asia
Data Table on Regional Comparison - Asia

12.5.1 China - Market size and forecast 2025-2030

Chart on China - Market size and forecast 2025-2030 ($ million)
Data Table on China - Market size and forecast 2025-2030 ($ million)
Chart on China - Year-over-year growth 2025-2030 (%)
Data Table on China - Year-over-year growth 2025-2030 (%)

12.5.2 India - Market size and forecast 2025-2030

Chart on India - Market size and forecast 2025-2030 ($ million)
Data Table on India - Market size and forecast 2025-2030 ($ million)
Chart on India - Year-over-year growth 2025-2030 (%)
Data Table on India - Year-over-year growth 2025-2030 (%)

12.5.3 Japan - Market size and forecast 2025-2030

Chart on Japan - Market size and forecast 2025-2030 ($ million)
Data Table on Japan - Market size and forecast 2025-2030 ($ million)
Chart on Japan - Year-over-year growth 2025-2030 (%)
Data Table on Japan - Year-over-year growth 2025-2030 (%)

12.5.4 South Korea - Market size and forecast 2025-2030

Chart on South Korea - Market size and forecast 2025-2030 ($ million)
Data Table on South Korea - Market size and forecast 2025-2030 ($ million)
Chart on South Korea - Year-over-year growth 2025-2030 (%)
Data Table on South Korea - Year-over-year growth 2025-2030 (%)

12.5.5 Indonesia - Market size and forecast 2025-2030

Chart on Indonesia - Market size and forecast 2025-2030 ($ million)
Data Table on Indonesia - Market size and forecast 2025-2030 ($ million)
Chart on Indonesia - Year-over-year growth 2025-2030 (%)
Data Table on Indonesia - Year-over-year growth 2025-2030 (%)

12.5.6 Thailand - Market size and forecast 2025-2030

Chart on Thailand - Market size and forecast 2025-2030 ($ million)
Data Table on Thailand - Market size and forecast 2025-2030 ($ million)
Chart on Thailand - Year-over-year growth 2025-2030 (%)
Data Table on Thailand - Year-over-year growth 2025-2030 (%)

12.6 Rest of World (ROW) - Market size and forecast 2025-2030

Chart on Rest of World (ROW) - Market size and forecast 2025-2030 ($ million)
Data Table on Rest of World (ROW) - Market size and forecast 2025-2030 ($ million)
Chart on Rest of World (ROW) - Year-over-year growth 2025-2030 (%)
Data Table on Rest of World (ROW) - Year-over-year growth 2025-2030 (%)
Chart on Regional Comparison - Rest of World (ROW)
Data Table on Regional Comparison - Rest of World (ROW)

12.6.1 Brazil - Market size and forecast 2025-2030

Chart on Brazil - Market size and forecast 2025-2030 ($ million)
Data Table on Brazil - Market size and forecast 2025-2030 ($ million)
Chart on Brazil - Year-over-year growth 2025-2030 (%)
Data Table on Brazil - Year-over-year growth 2025-2030 (%)

12.6.2 Saudi Arabia - Market size and forecast 2025-2030

Chart on Saudi Arabia - Market size and forecast 2025-2030 ($ million)
Data Table on Saudi Arabia - Market size and forecast 2025-2030 ($ million)
Chart on Saudi Arabia - Year-over-year growth 2025-2030 (%)
Data Table on Saudi Arabia - Year-over-year growth 2025-2030 (%)

12.6.3 UAE - Market size and forecast 2025-2030

Chart on UAE - Market size and forecast 2025-2030 ($ million)
Data Table on UAE - Market size and forecast 2025-2030 ($ million)
Chart on UAE - Year-over-year growth 2025-2030 (%)
Data Table on UAE - Year-over-year growth 2025-2030 (%)

12.6.4 Turkey - Market size and forecast 2025-2030

Chart on Turkey - Market size and forecast 2025-2030 ($ million)
Data Table on Turkey - Market size and forecast 2025-2030 ($ million)
Chart on Turkey - Year-over-year growth 2025-2030 (%)
Data Table on Turkey - Year-over-year growth 2025-2030 (%)

12.6.5 Argentina - Market size and forecast 2025-2030

Chart on Argentina - Market size and forecast 2025-2030 ($ million)
Data Table on Argentina - Market size and forecast 2025-2030 ($ million)
Chart on Argentina - Year-over-year growth 2025-2030 (%)
Data Table on Argentina - Year-over-year growth 2025-2030 (%)

12.6.6 Colombia - Market size and forecast 2025-2030

Chart on Colombia - Market size and forecast 2025-2030 ($ million)
Data Table on Colombia - Market size and forecast 2025-2030 ($ million)
Chart on Colombia - Year-over-year growth 2025-2030 (%)
Data Table on Colombia - Year-over-year growth 2025-2030 (%)

12.6.7 South Africa - Market size and forecast 2025-2030

Chart on South Africa - Market size and forecast 2025-2030 ($ million)
Data Table on South Africa - Market size and forecast 2025-2030 ($ million)
Chart on South Africa - Year-over-year growth 2025-2030 (%)
Data Table on South Africa - Year-over-year growth 2025-2030 (%)

12.6.8 Israel - Market size and forecast 2025-2030

Chart on Israel - Market size and forecast 2025-2030 ($ million)
Data Table on Israel - Market size and forecast 2025-2030 ($ million)
Chart on Israel - Year-over-year growth 2025-2030 (%)
Data Table on Israel - Year-over-year growth 2025-2030 (%)

12.7 Market opportunity by geography

Market opportunity by geography ($ million)
Data Tables on Market opportunity by geography ($ million)

13. Drivers, Challenges, and Opportunity

13.1 Market drivers

Growing adoption of precision medicine approaches
Increase in chronic diseases
Rising emphasis on early disease diagnosis and preventive care

13.2 Market challenges

High complexity of data interpretation and result standardization
Limited availability of highly skilled technical professionals
Stringent regulatory and compliance requirements across regions

13.3 Impact of drivers and challenges

Impact of drivers and challenges in 2025 and 2030

13.4 Market opportunities

Integration of multiplex assays with digital and automated laboratory ecosystems
Expansion of spatial biology and multi-omics research applications
Growing preference for customized and application-specific assay panels

14. Competitive Landscape

14.1 Overview

14.2

Overview on criticality of inputs and factors of differentiation

14.3 Landscape disruption

Overview on factors of disruption

14.4 Industry risks

Impact of key risks on business

15. Competitive Analysis

15.1 Companies profiled

Companies covered

15.2 Company ranking index

15.3 Market positioning of companies

Matrix on companies position and classification

15.4 Abbott Laboratories

Abbott Laboratories - Overview
Abbott Laboratories - Business segments
Abbott Laboratories - Key news
Abbott Laboratories - Key offerings
Abbott Laboratories - Segment focus
SWOT

15.5 Agilent Technologies Inc.

Agilent Technologies Inc. - Overview
Agilent Technologies Inc. - Business segments
Agilent Technologies Inc. - Key news
Agilent Technologies Inc. - Key offerings
Agilent Technologies Inc. - Segment focus
SWOT

15.6 Bio Rad Laboratories Inc.

Bio Rad Laboratories Inc. - Overview
Bio Rad Laboratories Inc. - Business segments
Bio Rad Laboratories Inc. - Key news
Bio Rad Laboratories Inc. - Key offerings
Bio Rad Laboratories Inc. - Segment focus
SWOT

15.7 BioMerieux SA

BioMerieux SA - Overview
BioMerieux SA - Business segments
BioMerieux SA - Key offerings
BioMerieux SA - Segment focus
SWOT

15.8 DiaSorin SpA

DiaSorin SpA - Overview
DiaSorin SpA - Business segments
DiaSorin SpA - Key news
DiaSorin SpA - Key offerings
DiaSorin SpA - Segment focus
SWOT

15.9 Eurofins Scientific SE

Eurofins Scientific SE - Overview
Eurofins Scientific SE - Business segments
Eurofins Scientific SE - Key offerings
Eurofins Scientific SE - Segment focus
SWOT

15.10 Hologic Inc.

Hologic Inc. - Overview
Hologic Inc. - Product / Service
Hologic Inc. - Key offerings
SWOT

15.11 Meso Scale Diagnostics LLC

Meso Scale Diagnostics LLC - Overview
Meso Scale Diagnostics LLC - Product / Service
Meso Scale Diagnostics LLC - Key offerings
SWOT

15.12 Miltenyi Biotec BV and Co. KG

Miltenyi Biotec BV and Co. KG - Overview
Miltenyi Biotec BV and Co. KG - Product / Service
Miltenyi Biotec BV and Co. KG - Key offerings
SWOT

15.13 QIAGEN N.V.

QIAGEN N.V. - Overview
QIAGEN N.V. - Product / Service
QIAGEN N.V. - Key offerings
SWOT

15.14 Revvity Inc.

Revvity Inc. - Overview
Revvity Inc. - Business segments
Revvity Inc. - Key offerings
Revvity Inc. - Segment focus
SWOT

15.15 Sartorius AG

Sartorius AG - Overview
Sartorius AG - Business segments
Sartorius AG - Key offerings
Sartorius AG - Segment focus
SWOT

15.16 Siemens Healthineers AG

Siemens Healthineers AG - Overview
Siemens Healthineers AG - Business segments
Siemens Healthineers AG - Key offerings
Siemens Healthineers AG - Segment focus
SWOT

15.17 Sigma Aldrich Chemicals Ltd.

Sigma Aldrich Chemicals Ltd. - Overview
Sigma Aldrich Chemicals Ltd. - Product / Service
Sigma Aldrich Chemicals Ltd. - Key offerings
SWOT

15.18 Thermo Fisher Scientific Inc.

Thermo Fisher Scientific Inc. - Overview
Thermo Fisher Scientific Inc. - Business segments
Thermo Fisher Scientific Inc. - Key news
Thermo Fisher Scientific Inc. - Key offerings
Thermo Fisher Scientific Inc. - Segment focus
SWOT

16. Appendix

16.1 Scope of the report

Market definition
Objectives
Notes and caveats

16.2 Inclusions and exclusions checklist

Inclusions checklist
Exclusions checklist

16.3 Currency conversion rates for US$

16.4 Research methodology

16.5 Data procurement

Information sources

16.6 Data validation

16.7 Validation techniques employed for market sizing

16.8 Data synthesis

16.9 360 degree market analysis

16.10 List of abbreviations

Research Methodology

Technavio presents a detailed picture of the market by way of study, synthesis, and summation of data from multiple sources. The analysts have presented the various facets of the market with a particular focus on identifying the key industry influencers. The data thus presented is comprehensive, reliable, and the result of extensive research, both primary and secondary.

INFORMATION SOURCES

Primary sources

  • Manufacturers and suppliers
  • Channel partners
  • Industry experts
  • Strategic decision makers

Secondary sources

  • Industry journals and periodicals
  • Government data
  • Financial reports of key industry players
  • Historical data
  • Press releases

DATA ANALYSIS

Data Synthesis

  • Collation of data
  • Estimation of key figures
  • Analysis of derived insights

Data Validation

  • Triangulation with data models
  • Reference against proprietary databases
  • Corroboration with industry experts

REPORT WRITING

Qualitative

  • Market drivers
  • Market challenges
  • Market trends
  • Five forces analysis

Quantitative

  • Market size and forecast
  • Market segmentation
  • Geographical insights
  • Competitive landscape

Interested in this report?

Get your sample now to see our research methodology and insights!

Download Now

Frequently Asked Questions

Multiplex Assays market growth will increase by USD 1414.8 million during 2026-2030.

The Multiplex Assays market is expected to grow at a CAGR of 7.2% during 2026-2030.

Multiplex Assays market is segmented by Type (Protein multiplex assays, Nucleic acid multiplex assays, Cell-based multiplex assays) Product (Consumables, Instruments and accessories, Services) Technology (Flow cytometry, Multiplex real-time PCR, Others)

Abbott Laboratories, Agilent Technologies Inc., BD Biosciences, Beckman Coulter Inc., Bio Rad Laboratories Inc., BioMerieux SA, DiaSorin SpA, Eurofins Scientific SE, Hologic Inc., Meso Scale Diagnostics LLC, Miltenyi Biotec BV and Co. KG, Promega Corp., QIAGEN N.V., Revvity Inc., Sartorius AG, Seegene Inc., Siemens Healthineers AG, Sigma Aldrich Chemicals Ltd., Tecan Trading AG, Thermo Fisher Scientific Inc. are a few of the key vendors in the Multiplex Assays market.

North America will register the highest growth rate of 41.7% among the other regions. Therefore, the Multiplex Assays market in North America is expected to garner significant business opportunities for the vendors during the forecast period.

US, Canada, Mexico, Germany, UK, France, Italy, Spain, The Netherlands, China, India, Japan, South Korea, Indonesia, Thailand, Brazil, Saudi Arabia, UAE, Turkey, Argentina, Colombia, South Africa, Israel

  • Growing adoption of precision medicine approaches is the driving factor this market.

The Multiplex Assays market vendors should focus on grabbing business opportunities from the Type segment as it accounted for the largest market share in the base year.
RIA - Research AI Assistant
Ask RIA
