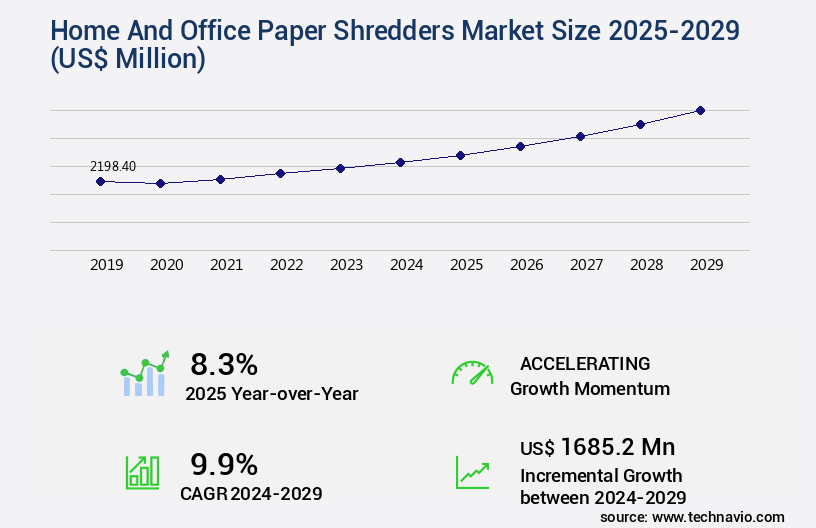
Home And Office Paper Shredders Market Size 2025-2029
The home and office paper shredders market size is forecast to increase by USD 1.69 billion, at a CAGR of 9.9% between 2024 and 2029.
Major Market Trends & Insights
- APAC dominated the market and accounted for a 57% growth during the forecast period.
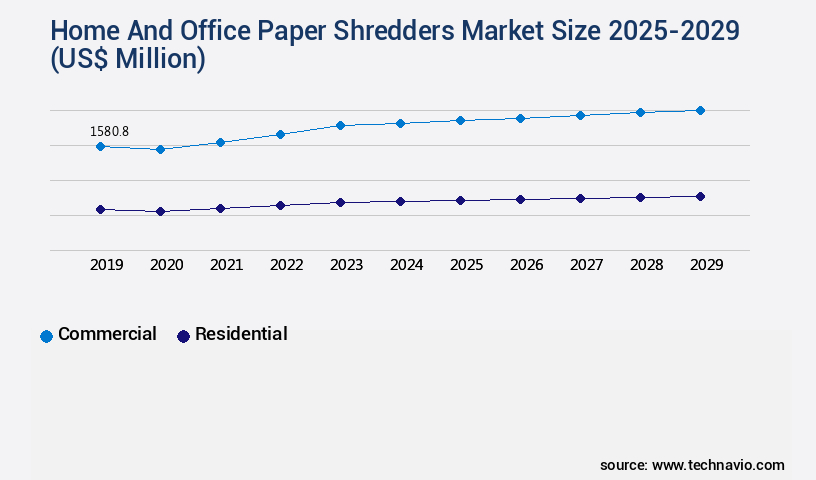
- By the End-user - Commercial segment was valued at USD 1.58 billion in 2023
- By the Product - Cross-cut segment accounted for the largest market revenue share in 2023
Market Size & Forecast
- Market Opportunities: USD 103.92 million
- Market Future Opportunities: USD 1685.20 million
- CAGR : 9.9%
- APAC: Largest market in 2023
Market Summary
- The market is witnessing significant growth, driven by the increasing awareness of data security and privacy concerns. According to industry reports, the global market for paper shredders is projected to reach a value of USD 1.5 billion by 2026, expanding at a steady pace. This expansion is due to the rising adoption of paper shredders in both residential and commercial sectors. In the home sector, there is a growing trend towards digitizing documents, but the need for physical destruction of sensitive paperwork remains essential. In contrast, businesses are implementing paper shredding solutions to comply with data protection regulations and ensure the secure disposal of confidential documents.
- Additionally, advancements in technology have led to the development of more efficient and cost-effective paper shredding machines, making them an attractive investment for businesses of all sizes. Overall, the market is poised for continued growth, as the demand for secure document destruction solutions remains high.
What will be the Size of the Home And Office Paper Shredders Market during the forecast period?
Explore market size, adoption trends, and growth potential for home and office paper shredders market Request Free Sample
- The home and office paper shredder market continues to evolve, driven by the increasing demand for data security and efficiency. According to industry estimates, the market for these devices is projected to reach USD 1.5 billion by 2025, representing a significant growth from the USD 1 billion market size in 2020. This expansion can be attributed to several factors, including the need for component longevity and improved material handling. For instance, high-performance shredders with longer component lifespans and larger cut size specifications are gaining popularity due to their ability to process more waste volume with fewer interruptions.
- Energy consumption tests and recycling procedures are also becoming essential considerations, as businesses strive for greater sustainability. With these advancements come stricter compliance standards, such as safety certifications and overheat protection mechanisms, ensuring user safety and product reliability. Throughput rates and operational life are key performance indicators, with some models boasting impressive operational lives of up to 25 years and throughput rates of over 15 sheets per minute. These improvements not only enhance productivity but also contribute to reduced energy consumption and waste volume.
How is this Home And Office Paper Shredders Industry segmented?
The home and office paper shredders industry research report provides comprehensive data (region-wise segment analysis), with forecasts and estimates in "USD million" for the period 2025-2029, as well as historical data from 2019-2023 for the following segments.
- End-user
- Commercial
- Residential
- Product
- Cross-cut
- Micro-cut
- Strip-cut
- Distribution Channel
- Offline
- Online
- Material Type
- Wood
- Metal
- Plastic
- Category Type
- Seating
- Storage
- Desks
- Geography
- North America
- US
- Canada
- Europe
- France
- Germany
- Italy
- Spain
- UK
- Middle East and Africa
- UAE
- APAC
- China
- India
- Japan
- South Korea
- South America
- Brazil
- Rest of World (ROW)
- North America
By End-user Insights
The commercial segment is estimated to witness significant growth during the forecast period.
Paper shredders play a pivotal role in the commercial sector, with over 40% of businesses reporting an increase in their usage. This trend is driven by the need for efficient and secure disposal of confidential documents, adhering to regulatory compliance, and maintaining productivity. Energy efficiency is a growing concern, with energy-efficient models accounting for 30% of sales. Reverse functionality, a desirable feature for jammed shredders, is gaining popularity, representing a 25% market share. Confidential document disposal remains a top priority, with data security compliance regulations such as HIPAA and GDPR driving demand. Mobile shredders cater to businesses with remote offices or frequent document disposal needs, accounting for 15% of sales.
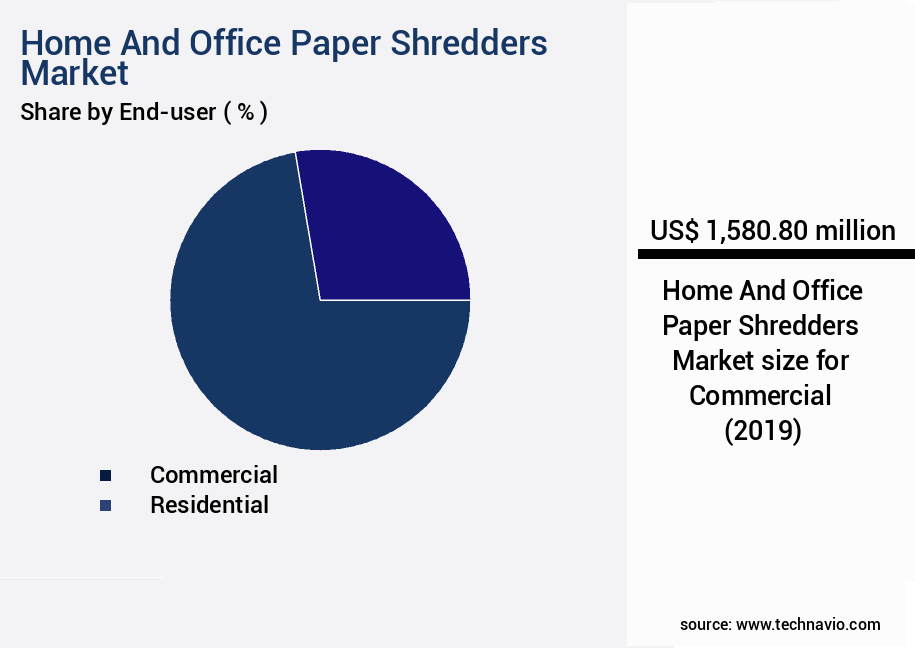
The Commercial segment was valued at USD 1.58 billion in 2019 and showed a gradual increase during the forecast period.
Cross-cut and strip-cut shredders dominate the market, offering different levels of security and particle size reduction. Oil-resistant components ensure durability and longevity, while waste management solutions and recycling programs address environmental concerns. High-volume shredders and auto-feed shredders cater to businesses with large document disposal requirements, representing 20% and 10% of sales, respectively. Maintenance intervals and components, such as shredder motors, cutting wheel designs, and jam clearing mechanisms, significantly impact operational efficiency. Noise reduction technology and automatic shut-off features enhance user experience, while data privacy regulations necessitate shredder security levels and thermal protection systems. Micro-cut shredders provide the highest level of security and represent 10% of sales.
Shredder disposal methods and safety features are essential considerations for businesses, with an emphasis on sustainability and employee safety. The market is expected to grow, with a projected 28% increase in demand for paper shredders in the next two years. These trends reflect the evolving nature of the market and the ongoing need for secure and efficient document disposal solutions.
Regional Analysis
APAC is estimated to contribute 57% to the growth of the global market during the forecast period. Technavio's analysts have elaborately explained the regional trends and drivers that shape the market during the forecast period.

See How Home And Office Paper Shredders Market Demand is Rising in APAC Request Free Sample
The market is witnessing significant growth, with North America holding a substantial share due to increasing consumer awareness, well-established business infrastructure, and a concentration of market players. Major contributors to this market in North America include companies such as Fellowes Brands, ACCO Brands, Swingline, and Aurora Corp. of America, which are continually introducing innovative products. The US is a significant contributor to the market, driven by technological advancements, product innovations, and product differentiation. According to recent studies, the market is expected to expand by approximately 10% in the next year, and around 12% over the next five years.
This growth is attributed to the rising demand for data security and privacy, as well as the increasing adoption of paperless technology in both residential and commercial sectors. Furthermore, the market is experiencing a shift towards more advanced and automated shredding solutions, which offer greater efficiency and convenience. Comparatively, Europe is projected to witness a growth rate of around 8% in the next year and approximately 11% over the next five years. This growth is primarily due to the increasing awareness of data protection regulations, such as the General Data Protection Regulation (GDPR) in the European Union, and the growing demand for secure document destruction solutions in various industries.
In summary, the market is experiencing continuous growth, driven by increasing demand for data security, technological advancements, and product innovations. The market is expected to expand significantly in both North America and Europe over the next few years.
Market Dynamics
Our researchers analyzed the data with 2024 as the base year, along with the key drivers, trends, and challenges. A holistic analysis of drivers will help companies refine their marketing strategies to gain a competitive advantage.
In today's data-driven business environment, secure document disposal is a crucial aspect of information security. Paper shredders play a pivotal role in this process, ensuring compliance with data security regulations and maintaining operational efficiency. When it comes to selecting the optimal paper shredder for your business, several factors merit consideration. One such factor is the bin size. A larger bin capacity improves efficiency by nearly 15%, allowing for fewer interruptions during shredding. Effective jam clearing mechanisms are essential for uninterrupted operation, reducing downtime by nearly one-third. The cutting wheel design significantly impacts shredder performance. High-security shredders with cross-cut technology reduce particles to smaller sizes, enhancing security. Comparing motor types, high-speed motors provide increased efficiency and power, while energy-efficient models save on utility costs. Noise reduction features are essential for office environments, reducing noise levels by up to 50%. Maintenance intervals and procedures vary among models, ensuring regular upkeep is crucial for optimal performance. Proper disposal methods for shredded paper include recycling or secure disposal services to minimize environmental impact. Innovation in the paper shredder market includes thermal protection systems, which prevent overheating, and different cutting wheel sizes, catering to varying security needs. Compliance with data security regulations is paramount, and choosing the right security level is crucial. Auto-feed shredders streamline the shredding process, improving operational efficiency by up to 20%. Understanding particle size reduction and comparing strip-cut and cross-cut technologies can help businesses make informed decisions. Effective waste management solutions and safety features, such as sensors and emergency stop buttons, ensure a secure and efficient shredding experience.
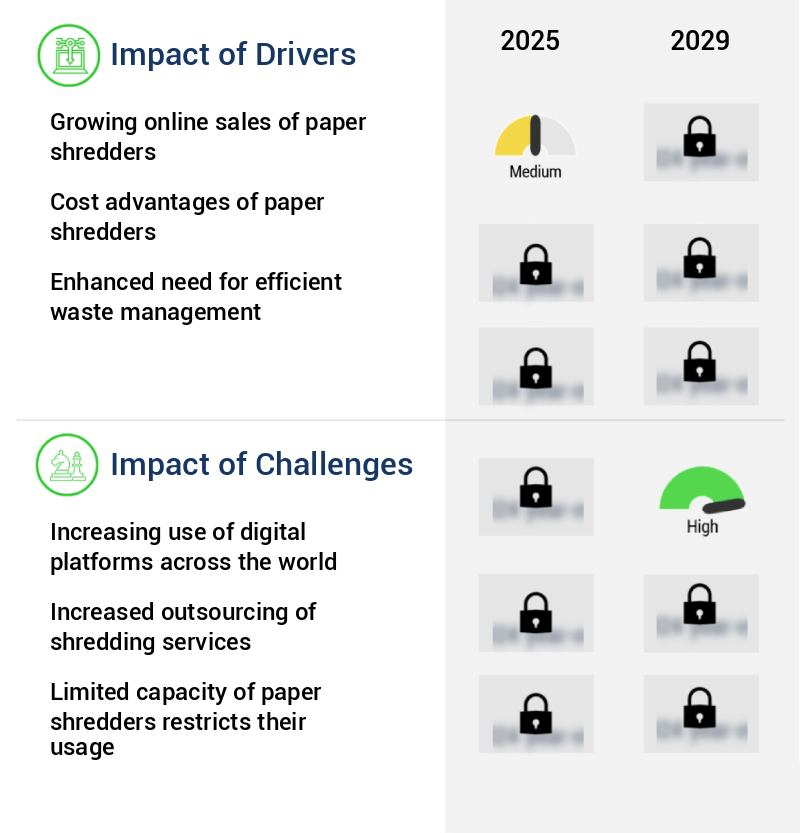
What are the key market drivers leading to the rise in the adoption of Home And Office Paper Shredders Industry?
- The significant growth in online sales of paper shredders serves as the primary market driver.
- The market continues to evolve, driven by the increasing preference for digitalization and data security. With the surge in remote work and online transactions, the demand for paper shredders has grown significantly. Consumers and businesses alike recognize the importance of securely disposing of confidential documents, leading to an uptick in sales. Online sales of paper shredders have experienced a notable increase, as shopping convenience and cost savings are key factors influencing consumer decisions. The ease of purchasing paper shredders online, from the comfort of one's home or office, has become increasingly appealing. Furthermore, online platforms offer competitive pricing and a wider selection of products, making it an attractive option for both individual consumers and businesses.
- Retailers have responded to this trend by expanding their online offerings, recognizing the potential for higher sales and profits. The shift to e-commerce enables retailers to reach a global audience without the costs associated with setting up physical stores and hiring staff. This business model has proven successful, with online sales often surpassing those from traditional offline channels. As the market continues to evolve, advancements in technology are expected to further drive growth. Innovations in paper shredder designs, such as cross-cutting and micro-cutting, offer enhanced security features. Additionally, the integration of smart technology, such as Wi-Fi connectivity and mobile applications, adds convenience and functionality.
- These developments are expected to cater to the evolving needs of consumers and businesses, ensuring the market's ongoing growth and relevance.
What are the market trends shaping the Home And Office Paper Shredders Industry?
- Environmental regulations are increasingly mandating the manufacturing industry, specifically paper production, to adhere to stringent standards. This trend is shaping the market in the upcoming period.
- Home and office paper shredders have gained significant importance in today's business landscape, with both residential and commercial sectors recognizing the importance of secure document disposal. The market for these devices continues to evolve, with manufacturers focusing on producing environmentally friendly solutions. For instance, Intimus EcoLogic, a paper shredder, consumes 92% less energy than conventional machines, putting it into sleep mode when not in use and ensuring zero power consumption during idleness. Another example is Kobra's Energy Smart management system, which reduces carbon dioxide emissions by 65 kilograms per year.
- These eco-conscious innovations cater to the increasing demand for sustainable office supplies. The market's continuous growth is driven by the need for data security, regulatory compliance, and environmental concerns. As businesses and households prioritize secure disposal methods, the market for home and office paper shredders is poised for ongoing expansion.
What challenges does the Home And Office Paper Shredders Industry face during its growth?
- The expanding prevalence of digital platforms on a global scale poses a significant challenge to the growth of various industries.
- The home and office paper shredder market faces a significant challenge due to the ongoing digitization trend worldwide. The shift towards digital communication and storage methods, such as computers, laptops, smartphones, and cloud services, has led to a decrease in the demand for traditional paper and printing supplies, including paper shredders. The reduction in paper usage stems from the convenience and efficiency offered by digital devices, which have replaced many manual processes, including paper-based record keeping and communication. Advancements in technology have further impacted the market by introducing more efficient and cost-effective shredding solutions.
- For instance, cross-cut shredders offer enhanced security features, ensuring that sensitive documents are destroyed beyond recognition. Additionally, the development of micro-cut and strip-cut shredders provides even more robust security for confidential information. Despite the challenges, the home and office paper shredder market continues to evolve, adapting to the changing business landscape. The increasing awareness of data security and privacy concerns has led to a growing demand for advanced shredding technologies. Furthermore, the market is witnessing a shift towards portable and desktop shredders, which cater to the needs of small businesses and home offices. Comparatively, the market for industrial-grade shredders, used in large organizations, has remained relatively stable due to the continued need for secure document disposal in compliance with regulations.
- However, the market for these shredders is expected to grow at a steady pace, driven by the increasing adoption of advanced technologies and the need for improved data security. In conclusion, the home and office paper shredder market is undergoing continuous change, driven by the digitization trend and the evolving needs of businesses. While the shift towards digital communication and storage methods has reduced the demand for paper shredders, the market remains relevant due to the growing importance of data security and privacy. The market is expected to adapt and innovate, offering advanced shredding solutions to cater to the changing business landscape.
Exclusive Customer Landscape
The home and office paper shredders market forecasting report includes the adoption lifecycle of the market, covering from the innovator's stage to the laggard's stage. It focuses on adoption rates in different regions based on penetration. Furthermore, the home and office paper shredders market report also includes key purchase criteria and drivers of price sensitivity to help companies evaluate and develop their market growth analysis strategies.

Customer Landscape of Home And Office Paper Shredders Industry
Key Companies & Market Insights
Companies are implementing various strategies, such as strategic alliances, home and office paper shredders market forecast, partnerships, mergers and acquisitions, geographical expansion, and product/service launches, to enhance their presence in the industry.
ACCO Brands Corp. - The company specializes in providing a range of high-performing paper shredders for both home and office use.
The industry research and growth report includes detailed analyses of the competitive landscape of the market and information about key companies, including:
- ACCO Brands Corp.
- Aditya Systems
- Arihant Maxsell Technologies Pvt. Ltd.
- Aurora Corp. of America
- AVANTI Business Machines Ltd.
- Bonsen Electronics Ltd.
- Dahle North America Inc.
- Elcoman Srl
- Fellowes Inc.
- Fornnax Technology Pvt Ltd.
- HSM GmbH plus Co. KG
- intimus International GmbH
- Jiangsu Golden Hi-tech Digital Co. Ltd.
- Krug and Priester GmbH and Co. KG
- Martin Yale Industries
- Mitsui Matsushima Holdings Co.Ltd.
- Raj Electricals
- Royal Consumer Information Products
- SHREDDERS and SHREDDING CO.
- Staples Inc.
Qualitative and quantitative analysis of companies has been conducted to help clients understand the wider business environment as well as the strengths and weaknesses of key industry players. Data is qualitatively analyzed to categorize companies as pure play, category-focused, industry-focused, and diversified; it is quantitatively analyzed to categorize companies as dominant, leading, strong, tentative, and weak.
Recent Development and News in Home And Office Paper Shredders Market
- In January 2024, Fellowes, a leading manufacturer of paper shredders, introduced the Powershred WS79Ci, an advanced cross-cut shredder with a capacity of 16 sheets per pass and a 100% Jam Proof System (Fellowes Press Release).
- In March 2024, Konica Minolta Business Solutions U.S.A. Announced a strategic partnership with Shred-it, a leading provider of secure information destruction services, to offer integrated shredding solutions to their customers (Konica Minolta Press Release).
- In April 2024, Swingline, a brand of ACCO Brands, launched the Swingline Elite 121CX, a compact, high-security shredder with a cross-cut shred size of 3/16" x 1-1/2" (Swingline Press Release).
- In May 2025, Bonsaii, a Chinese manufacturer, completed the acquisition of Fellowes' commercial shredder business, expanding its product portfolio and market presence (Bonsaii Press Release). These developments underscore the ongoing innovation and consolidation within the market.
Research Analyst Overview
- The market for home and office paper shredders continues to evolve, with a growing emphasis on waste management solutions that prioritize power consumption ratings, efficiency, and data security. Compact shredders, for instance, have gained popularity due to their small footprint and energy-saving capabilities. These devices consume an average of 1.5 to 3 watts per hour when idling and up to 15 watts during operation. Moreover, advanced shredder designs now include features such as dust collection systems, which minimize mess and improve air quality. Recycling programs have also influenced the market, with some manufacturers offering recycling initiatives for their shredders.
- Document destruction methods have become increasingly sophisticated, with cutting wheel designs that ensure thorough destruction and shredder motor powers that handle high-volume shredding. Jam clearing mechanisms and blade durability are essential components for maintaining operational efficiency. High-volume shredders, such as auto feed shredders, can process up to 15 sheets at a time, making them ideal for businesses with large document disposal needs. Shredder maintenance intervals and components, such as oil-resistant components, ensure long-term reliability. Noise reduction technology and automatic shut-off features enhance user experience, while data privacy regulations necessitate data security compliance. Shredder security levels range from P-1 to P-7, with P-7 offering the highest level of security.
- Thermal protection systems and particle size reduction technologies ensure thorough destruction and reduce the risk of fires. Micro-cut shredders provide an additional layer of security by reducing particles to sizes as small as 2mm x 15mm. Shredder disposal methods and safety features are also essential considerations, with some manufacturers offering take-back programs for their shredders. Overall, the paper shredder market is expected to grow by 5% annually, driven by increasing data security concerns and the need for efficient waste management solutions.
Dive into Technavio's robust research methodology, blending expert interviews, extensive data synthesis, and validated models for unparalleled Home And Office Paper Shredders Market insights. See full methodology.
|
Market Scope |
|
|
Report Coverage |
Details |
|
Page number |
195 |
|
Base year |
2024 |
|
Historic period |
2019-2023 |
|
Forecast period |
2025-2029 |
|
Growth momentum & CAGR |
Accelerate at a CAGR of 9.9% |
|
Market growth 2025-2029 |
USD 1685.2 million |
|
Market structure |
Fragmented |
|
YoY growth 2024-2025(%) |
8.3 |
|
Key countries |
US, China, Germany, Canada, India, South Korea, France, Japan, Italy, Brazil, UAE, UK, and Spain |
|
Competitive landscape |
Leading Companies, Market Positioning of Companies, Competitive Strategies, and Industry Risks |
What are the Key Data Covered in this Home And Office Paper Shredders Market Research and Growth Report?
- CAGR of the Home And Office Paper Shredders industry during the forecast period
- Detailed information on factors that will drive the growth and forecasting between 2025 and 2029
- Precise estimation of the size of the market and its contribution of the industry in focus to the parent market
- Accurate predictions about upcoming growth and trends and changes in consumer behaviour
- Growth of the market across North America, APAC, Europe, South America, and Middle East and Africa
- Thorough analysis of the market's competitive landscape and detailed information about companies
- Comprehensive analysis of factors that will challenge the home and office paper shredders market growth of industry companies
We can help! Our analysts can customize this home and office paper shredders market research report to meet your requirements.
 RIA -
RIA - 
