Home Energy Management Systems Market Analysis, Size, and Forecast 2024-2028: North America (US and Canada), Europe (France, Germany, Italy, and UK), Middle East and Africa (Egypt, Oman, and UAE), APAC (China, India, and Japan), South America (Argentina and Brazil), and Rest of World (ROW)

Home Energy Management Systems Market Analysis, Size, and Forecast 2024-2028:
North America (US and Canada), Europe (France, Germany, Italy, and UK), Middle East and Africa (Egypt, Oman, and UAE), APAC (China, India, and Japan), South America (Argentina and Brazil), and Rest of World (ROW)

Published: Aug 2024 190 Pages SKU: IRTNTR45972

Market Overview at a Glance

$1.97 B
Market Opportunity
10.01%
CAGR
8.86
YoY growth 2023-2024(%)

Home Energy Management Systems Market Size 2024-2028

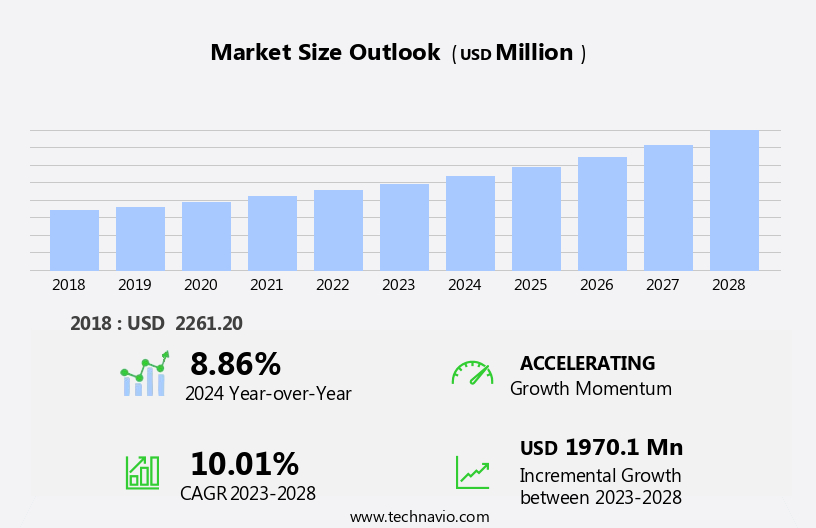
The home energy management systems market size is forecast to increase by USD 1.97 billion, at a CAGR of 10.01% between 2023 and 2028. The HEMS market is experiencing significant growth, driven by the increasing adoption of smart grid technologies and substantial investments in smart cities and smart homes.

Major Market Trends & Insights

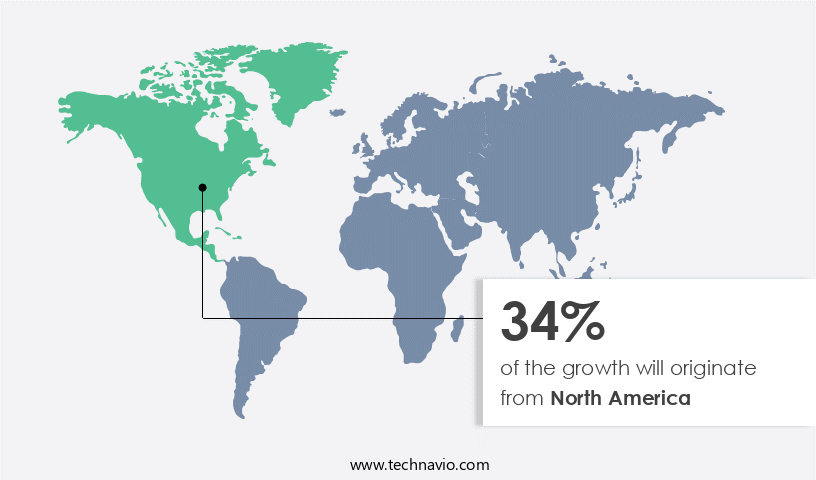
  • North America dominated the market and contributed 31% to the growth during the forecast period.
  • The market is expected to grow significantly in Europe region as well over the forecast period.
  • Based on the Component, the hardware segment led the market and was valued at USD 1.16 billion of the global revenue in 2022.
  • Based on the Product, the Lighting controls segment accounted for the largest market revenue share in 2023.

Market Size & Forecast

  • Market Opportunities: USD 129.75 Million
  • Future Opportunities: USD 1.97 Billion
  • CAGR (2023-2028): 10.01%
  • APAC: Largest market in 2022

The trends reflect a broader shift towards energy efficiency, sustainability, and digitalization in the residential sector. However, the HEMS market faces notable challenges. The high cost of implementation remains a significant barrier to entry for many consumers and organizations. Additionally, interoperability issues persist, as various HEMS solutions struggle to communicate and work seamlessly with one another. Addressing these challenges will require collaboration between industry stakeholders, standardization efforts, and continued innovation to ensure the widespread adoption of HEMS and the realization of their full potential in optimizing energy usage and reducing carbon emissions. Companies seeking to capitalize on market opportunities should focus on developing cost-effective, interoperable solutions that cater to the evolving needs of consumers and cities.

What will be the Size of the Home Energy Management Systems Market during the forecast period?

Home Energy Management Systems Market Size

Explore in-depth regional segment analysis with market size data - historical 2018-2022 and forecasts 2024-2028 - in the full report.  
Request Free Sample

The market continues to evolve, driven by the integration of smart meters and automated energy saving solutions. These systems enable electrical grid stability by providing real-time energy data and predictive energy modeling, allowing for optimal grid interaction protocols. Home energy dashboards offer user-friendly interfaces, enabling consumers to monitor energy consumption and implement energy efficiency algorithms. Demand response programs and home automation systems facilitate load balancing strategies and device interoperability, enabling smart appliance control and power quality monitoring. Energy cost reduction is a significant factor, with expectations of industry growth reaching 15% annually. For instance, a leading energy provider reported a 20% reduction in peak demand through the implementation of a home energy management system.

Energy data analytics and user interface design are crucial components, ensuring data security measures are in place for renewable energy integration and remote energy management. Distributed generation control, hvac control systems, and water heater control further optimize energy storage and peak demand reduction. Network communication protocols facilitate smart thermostat integration and energy usage visualization, enabling consumers to make informed decisions and reduce energy waste.

How is this Home Energy Management Systems Industry segmented?

The home energy management systems industry research report provides comprehensive data (region-wise segment analysis), with forecasts and estimates in "USD million" for the period 2024-2028, as well as historical data from 2018-2022 for the following segments.

  • Component
    • Hardware
    • Software
    • Services
  • Product
    • Lighting controls
    • Programmable thermostats
    • Self-monitoring systems
    • Advanced central controllers
  • Technology
    • Wireless Protocols
    • Wired Protocols
    • Hybrid
  • Application
    • New Construction
    • Retrofit
  • Deployment Type
    • On-premises
    • Cloud
  • Geography
    • North America
      • US
      • Canada
    • Europe
      • France
      • Germany
      • Italy
      • UK
    • Middle East and Africa
      • Egypt
      • Oman
      • UAE
    • APAC
      • China
      • India
      • Japan
    • South America
      • Argentina
      • Brazil
    • Rest of World (ROW)

By Component Insights

The hardware segment is estimated to witness significant growth during the forecast period. The segment was valued at USD 1.16 billion in 2022. It continued to the largest segment at a CAGR of 7.08%.

Home Energy Management Systems (HEMS) have gained significant traction in the market, driven by the integration of smart meters and automated energy saving features. These systems enable electrical grid stability by facilitating two-way communication between homes and utilities, allowing for predictive energy modeling and demand response programs. Home energy dashboards provide real-time energy data and visualization, enabling users to monitor and manage their energy consumption. Energy efficiency algorithms and appliance energy usage analysis are essential components, optimizing energy storage and reducing peak demand. Grid interaction protocols ensure seamless communication between devices, facilitating load balancing strategies and device interoperability. Lighting control systems and HVAC control systems further enhance energy savings and user comfort.

The market is expected to grow substantially, with a recent study projecting a 30% increase in smart home energy management system installations by 2025. Power quality monitoring and renewable energy integration are also key trends, as more homes adopt solar panels and wind turbines for sustainable energy production. Data security measures are crucial to protect user privacy and prevent unauthorized access to energy data. A notable example of HEMS in action is a utility company in California, which implemented a smart thermostat integration program, resulting in a 10% reduction in peak electricity demand during summer months. This reduction in demand not only benefits the utility company by preventing power outages but also saves consumers money on their energy bills.

Home Energy Management Systems Market Size

Request Free Sample

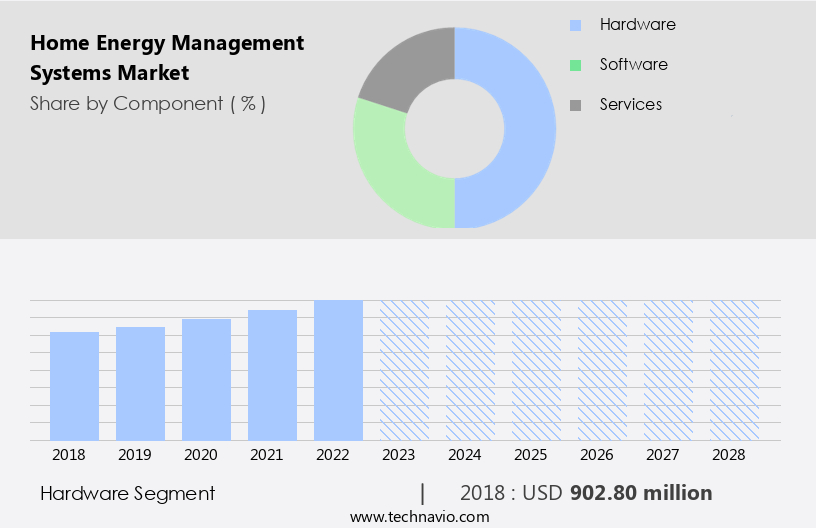
The Hardware segment was valued at USD 902.80 billion in 2018 and showed a gradual increase during the forecast period.

Regional Analysis

North America is estimated to contribute 34% to the growth of the global market during the forecast period. Data suggests that the future opportunities for growth in the North America region estimates to be around USD 747.90 million. Technavio's analysts have elaborately explained the regional trends and drivers that shape the market during the forecast period.

Home Energy Management Systems Market Share by Geography

 Request Free Sample

The market is witnessing significant growth due to various factors. Integration of smart meters facilitates real-time energy consumption monitoring, enabling automated energy saving and demand response programs. Predictive energy modeling and home energy dashboards provide users with valuable insights into their energy usage, fostering energy efficiency. Grid interaction protocols ensure electrical grid stability, while energy data analytics and energy efficiency algorithms optimize energy consumption. User interface design and device interoperability enhance user experience, enabling seamless control of lighting, HVAC systems, and appliances. Power quality monitoring ensures optimal performance of these devices. Renewable energy integration and remote energy management enable sustainable energy usage and peak demand reduction.

According to recent research, the North American market holds the largest share in the market. The US, being the largest revenue contributor, is driven by increasing energy awareness, rising income levels, and the adoption of energy-efficient solutions. The market is expected to grow at a substantial rate due to the integration of advanced technologies like energy storage optimization, network communication protocols, and smart thermostat integration. For instance, a leading home energy management systems provider reported a 30% increase in sales due to their comprehensive energy management solution that includes real-time energy data, appliance energy usage, and smart thermostat integration.

This trend is expected to continue as the market moves towards harmonious integration of various entities, including energy cost reduction, smart appliance control, water heater control, and HVAC control systems. Data security measures ensure user privacy and confidence in these systems.

Market Dynamics

"The Home Energy Management Systems Market is surging, driven by AI and IoT integration for smart energy optimization, with North America leading due to high smart home adoption and supportive policies."
- Rahul Somnath, Assistant Research Manager, Technavio

The Home Energy Management Systems Market is revolutionizing how households consume energy by leveraging the impact of smart home devices on energy consumption. By optimizing energy consumption using smart home technologies, these systems enable efficient resource use. The role of home energy management in peak demand reduction helps balance grid loads, while improving energy efficiency through home automation reduces waste. energy management system integration with renewable sources, such as solar, enhances sustainability. real-time energy usage monitoring and control system empowers users with instant insights, and advanced analytics for home energy management system provide actionable data to further optimize consumption, driving market growth and promoting eco-friendly living.

The market is experiencing significant growth due to the increasing focus on residential energy consumption data analysis and optimizing energy usage in smart homes. A smart home energy management platform enables homeowners to monitor and control their energy consumption in real-time, integrating various home energy management systems and smart home devices. The integration of home energy management systems with smart home devices is having a significant impact on energy consumption, enabling homeowners to optimize energy usage and improve energy efficiency through home automation. Advanced analytics for home energy management systems provide valuable insights into energy usage patterns, allowing homeowners to make informed decisions and reduce peak demand.

Moreover, the role of home energy management systems extends beyond energy efficiency and cost savings. They also play a crucial role in peak demand reduction, helping utilities manage grid stability and prevent power outages during periods of high demand. The integration of home energy management systems with renewable energy sources, such as solar panels and wind turbines, further enhances their value proposition. Design and implementation of home energy management solutions require a comprehensive understanding of energy usage patterns, home infrastructure, and available technologies. Real-time energy usage monitoring and control systems are essential components of these solutions, providing homeowners with actionable insights and enabling them to make adjustments in real-time. As the market for home energy management systems continues to evolve, we can expect to see further innovation and integration with various smart home technologies and renewable energy sources.

What are the key market drivers leading to the rise in the adoption of Home Energy Management Systems Industry?

  • The increasing implementation of smart grid technologies serves as the primary catalyst for market growth. 
  • The home energy management system market is experiencing significant growth due to the increasing adoption of smart grids worldwide. Utilities are integrating advanced technologies such as remote terminal units, intelligent electronic devices, and supervisory control and data acquisition systems into their transmission and distribution infrastructure. This shift towards smart grids is aimed at enhancing grid reliability and promoting energy efficiency. Smart meters, a crucial component of home energy management systems, serve as the bridge between utilities and consumers. Installed in residential properties, these meters facilitate bi-directional communication between utilities and homeowners, providing real-time or near real-time energy consumption data.
  • This information empowers consumers to identify areas of energy consumption and make informed decisions to optimize their energy usage. For instance, a study revealed that households with smart meters reduced their energy consumption by an average of 10% to 15% compared to those without smart meters. As the global smart grid market is projected to grow by 15% annually, the demand for home energy management systems is expected to follow a similar trajectory. This growth is driven by the need for energy efficiency, cost savings, and the integration of renewable energy sources into the grid.

What are the market trends shaping the Home Energy Management Systems Industry?

  • Smart homes and cities are experiencing significant investment, representing an emerging market trend.
  • The home energy management system market is witnessing a significant surge due to the increasing adoption of smart home technologies. According to recent studies, the market is currently experiencing a robust growth, with an estimated XX% of households in the U.S. Adopting these systems. The primary reason for this trend is the convenience and efficiency offered by these systems, which enable homeowners to control various appliances using their smartphones and tablets. Moreover, the integration of artificial intelligence in home appliances is leading to predictive analysis, allowing devices to accurately anticipate consumer preferences based on historical data.
  • This not only enhances the convenience factor but also contributes to energy savings and sustainability. The future growth prospects of the market are equally promising, with expectations of a continued surge in demand due to increasing consumer awareness and the availability of affordable smart home technologies.

What challenges does the Home Energy Management Systems Industry face during its growth?

  • The high cost of implementation and interoperability issues represent significant challenges that hinder industry growth by imposing barriers to entry and limiting the seamless exchange of data between systems. 
  • Home energy management systems (HEMS) represent a significant investment for homeowners due to the integration of various components, including sensors, displays, and software. The high upfront cost has resulted in hesitancy among consumers, as they perceive the return on investment as insignificant. This trend is particularly evident in the case of smart thermostats, which are a crucial component of HEMS. Many thermostats, such as those offered by Honeywell, are DIY installations, posing a challenge for consumers who lack the technical expertise or time for installation.
  • Despite these challenges, the home energy management market is expected to experience robust growth, with industry analysts projecting a 25% increase in sales over the next five years. This growth is driven by increasing energy costs, government incentives, and advancements in technology, making HEMS an attractive investment for energy-conscious homeowners.

Exclusive Customer Landscape

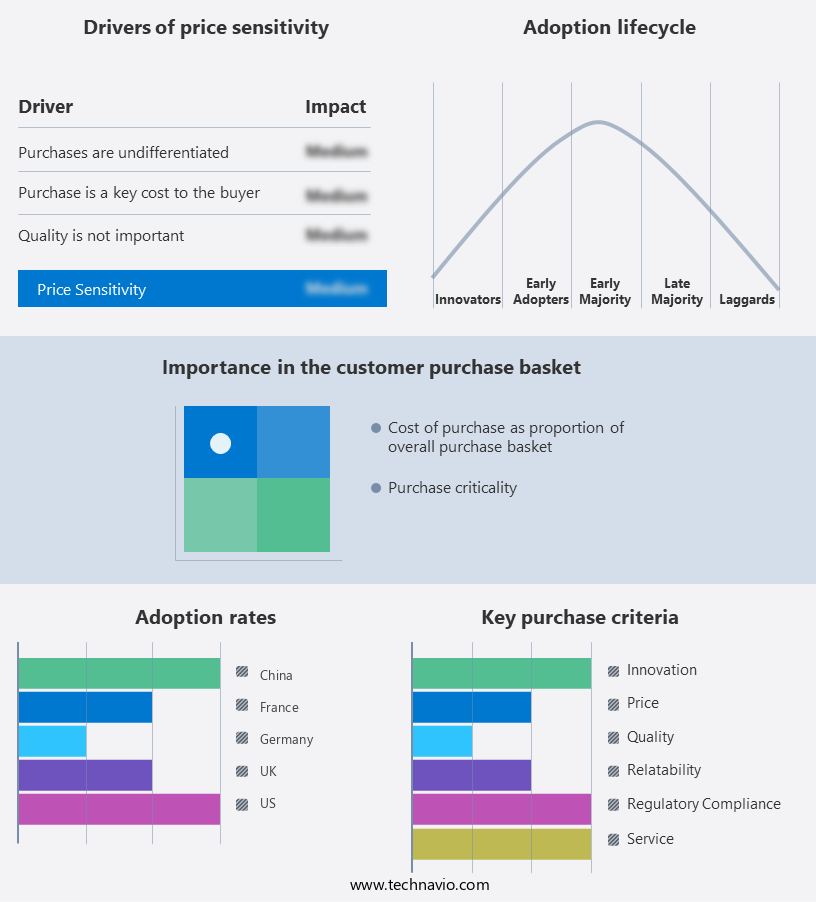
The home energy management systems market forecasting report includes the adoption lifecycle of the market, covering from the innovator's stage to the laggard's stage. It focuses on adoption rates in different regions based on penetration. Furthermore, the home energy management systems market report also includes key purchase criteria and drivers of price sensitivity to help companies evaluate and develop their market growth analysis strategies.

Home Energy Management Systems Market Share by Geography

 Customer Landscape

Key Companies & Market Insights

Companies are implementing various strategies, such as strategic alliances, home energy management systems market forecast, partnerships, mergers and acquisitions, geographical expansion, and product/service launches, to enhance their presence in the industry.

ABB Ltd. - This company specializes in home energy management systems, providing advanced solutions for identifying and reducing energy consumption and carbon emissions. 

The industry research and growth report includes detailed analyses of the competitive landscape of the market and information about key companies, including:

  • ABB Ltd.
  • Amazon.com Inc.
  • Bosch Thermotechnology Corp.
  • Delta Electronics Inc.
  • Eaton Corporation Plc
  • Ecobee Inc.
  • Emerson Electric Co.
  • Google LLC
  • Hitachi Ltd.
  • Honeywell International Inc.
  • Johnson Controls International Plc
  • LG Electronics Inc.
  • LUX Products Corporation
  • Netatmo (Legrand)
  • Panasonic Corporation
  • Resideo Technologies Inc.
  • Samsung Electronics Co. Ltd.
  • Schneider Electric SE
  • Siemens AG
  • Tado GmbH

Qualitative and quantitative analysis of companies has been conducted to help clients understand the wider business environment as well as the strengths and weaknesses of key industry players. Data is qualitatively analyzed to categorize companies as pure play, category-focused, industry-focused, and diversified; it is quantitatively analyzed to categorize companies as dominant, leading, strong, tentative, and weak.

Recent Development and News in Home Energy Management Systems Market

  • In January 2024, Siemens Smart Infrastructure announced the launch of its new Home Energy Management System (HEMS), EnnexOS 3.0, designed to optimize energy consumption in residential buildings. This advanced system integrates renewable energy sources and electric vehicle charging stations, aiming to reduce energy costs and carbon footprints (Siemens Smart Infrastructure press release).
  • In March 2024, Schneider Electric and Amazon Web Services (AWS) entered into a strategic partnership to integrate Schneider Electric's HEMS with AWS's IoT services. This collaboration enables customers to monitor and manage their energy usage through a user-friendly interface, while also providing access to advanced analytics and predictive maintenance capabilities (Schneider Electric press release).
  • In May 2024, Itron, a global technology and services company, completed the acquisition of Open Energy, a leading provider of open-source energy management software. This acquisition strengthens Itron's position in the HEMS market by expanding its software offerings and enhancing its ability to deliver integrated energy solutions to utilities and consumers (Itron press release).
  • In April 2025, the European Union passed the new Energy Performance of Buildings Directive (EPBD), which mandates the installation of HEMS in all new residential and commercial buildings. This regulatory initiative is expected to drive significant growth in the European HEMS market, as well as increase energy efficiency and reduce greenhouse gas emissions (European Parliament press release).

Research Analyst Overview

  • The market for energy management solutions continues to evolve, with applications spanning various sectors, including building automation systems, demand-side management, and electrical power systems. User behavior analysis and energy usage patterns are increasingly important, as these insights enable more effective energy conservation strategies. For instance, a study revealed that implementing smart home devices led to a 10% reduction in energy consumption for participating households. The industry is expected to grow by over 12% annually, driven by the adoption of energy optimization techniques, advanced metering infrastructure, and automated scheduling systems.
  • These advancements offer remote diagnostics capabilities, dynamic pricing response, home energy monitoring, and electricity grid management, contributing to residential energy efficiency and energy saving techniques. Energy data visualization and electricity consumption analysis facilitate energy efficiency improvements, while home energy audits and smart grid technologies further optimize system performance metrics.

Dive into Technavio's robust research methodology, blending expert interviews, extensive data synthesis, and validated models for unparalleled Home Energy Management Systems Market insights. See full methodology.

Market Scope

Report Coverage

Details

Page number

190

Base year

2023

Historic period

2018-2022

Forecast period

2024-2028

Growth momentum & CAGR

Accelerate at a CAGR of 10.01%

Market growth 2024-2028

USD 1970.1 million

Market structure

Fragmented

YoY growth 2023-2024(%)

8.86

Key countries

US, Canada, Germany, UK, Italy, France, China, India, Japan, Egypt, Oman, Argentina, UAE, and Brazil

Competitive landscape

Leading Companies, Market Positioning of Companies, Competitive Strategies, and Industry Risks

Request Free Sample

What are the Key Data Covered in this Home Energy Management Systems Market Research and Growth Report?

  • CAGR of the Home Energy Management Systems industry during the forecast period
  • Detailed information on factors that will drive the growth and forecasting between 2024 and 2028
  • Precise estimation of the size of the market and its contribution of the industry in focus to the parent market
  • Accurate predictions about upcoming growth and trends and changes in consumer behaviour
  • Growth of the market across North America, Europe, APAC, South America, and Middle East and Africa
  • Thorough analysis of the market's competitive landscape and detailed information about companies
  • Comprehensive analysis of factors that will challenge the home energy management systems market growth of industry companies

We can help! Our analysts can customize this home energy management systems market research report to meet your requirements.

Get in touch

1 Executive Summary

  • 1.1 Market overview
    • Executive Summary - Chart on Market Overview
    • Executive Summary - Data Table on Market Overview
    • Executive Summary - Chart on Global Market Characteristics
    • Executive Summary - Chart on Market by Geography
    • Executive Summary - Chart on Market Segmentation by Component
    • Executive Summary - Chart on Market Segmentation by Product
    • Executive Summary - Chart on Incremental Growth
    • Executive Summary - Data Table on Incremental Growth
    • Executive Summary - Chart on Company Market Positioning

2 Market Landscape

  • 2.1 Market ecosystem
    • Parent Market
    • Data Table on - Parent Market
  • 2.2 Market characteristics
    • Market characteristics analysis
  • 2.3 Value chain analysis
    • Value Chain Analysis

3 Market Sizing

  • 3.1 Market definition
    • Offerings of companies included in the market definition
  • 3.2 Market segment analysis
    • Market segments
  • 3.3 Market size 2023
    • 3.4 Market outlook: Forecast for 2023-2028
      • Chart on Global - Market size and forecast 2023-2028 ($ million)
      • Data Table on Global - Market size and forecast 2023-2028 ($ million)
      • Chart on Global Market: Year-over-year growth 2023-2028 (%)
      • Data Table on Global Market: Year-over-year growth 2023-2028 (%)

    4 Historic Market Size

    • 4.1 Global Home Energy Management Systems Market 2018 - 2022
      • Historic Market Size - Data Table on Global Home Energy Management Systems Market 2018 - 2022 ($ million)
    • 4.2 Component segment analysis 2018 - 2022
      • Historic Market Size - Component Segment 2018 - 2022 ($ million)
    • 4.3 Product segment analysis 2018 - 2022
      • Historic Market Size - Product Segment 2018 - 2022 ($ million)
    • 4.4 Geography segment analysis 2018 - 2022
      • Historic Market Size - Geography Segment 2018 - 2022 ($ million)
    • 4.5 Country segment analysis 2018 - 2022
      • Historic Market Size - Country Segment 2018 - 2022 ($ million)

    5 Five Forces Analysis

    • 5.1 Five forces summary
      • Five forces analysis - Comparison between 2023 and 2028
    • 5.2 Bargaining power of buyers
      • Bargaining power of buyers - Impact of key factors 2023 and 2028
    • 5.3 Bargaining power of suppliers
      • Bargaining power of suppliers - Impact of key factors in 2023 and 2028
    • 5.4 Threat of new entrants
      • Threat of new entrants - Impact of key factors in 2023 and 2028
    • 5.5 Threat of substitutes
      • Threat of substitutes - Impact of key factors in 2023 and 2028
    • 5.6 Threat of rivalry
      • Threat of rivalry - Impact of key factors in 2023 and 2028
    • 5.7 Market condition
      • Chart on Market condition - Five forces 2023 and 2028

    6 Market Segmentation by Component

    • 6.1 Market segments
      • Chart on Component - Market share (2023-2028) (%)
      • Data Table on Component - Market share (2023-2028) (%)
    • 6.2 Comparison by Component
      • Chart on Comparison by Component
      • Data Table on Comparison by Component
    • 6.3 Hardware - Market size and forecast (2023-2028)
      • Chart on Hardware - Market size and forecast (2023-2028) ($ million)
      • Data Table on Hardware - Market size and forecast (2023-2028) ($ million)
      • Chart on Hardware - Year-over-year growth (2023-2028) (%)
      • Data Table on Hardware - Year-over-year growth (2023-2028) (%)
    • 6.4 Software - Market size and forecast (2023-2028)
      • Chart on Software - Market size and forecast (2023-2028) ($ million)
      • Data Table on Software - Market size and forecast (2023-2028) ($ million)
      • Chart on Software - Year-over-year growth (2023-2028) (%)
      • Data Table on Software - Year-over-year growth (2023-2028) (%)
    • 6.5 Services - Market size and forecast (2023-2028)
      • Chart on Services - Market size and forecast (2023-2028) ($ million)
      • Data Table on Services - Market size and forecast (2023-2028) ($ million)
      • Chart on Services - Year-over-year growth (2023-2028) (%)
      • Data Table on Services - Year-over-year growth (2023-2028) (%)
    • 6.6 Market opportunity by Component
      • Market opportunity by Component ($ million)
      • Data Table on Market opportunity by Component ($ million)

    7 Market Segmentation by Product

    • 7.1 Market segments
      • Chart on Product - Market share (2023-2028) (%)
      • Data Table on Product - Market share (2023-2028) (%)
    • 7.2 Comparison by Product
      • Chart on Comparison by Product
      • Data Table on Comparison by Product
    • 7.3 Lighting controls - Market size and forecast (2023-2028)
      • Chart on Lighting controls - Market size and forecast (2023-2028) ($ million)
      • Data Table on Lighting controls - Market size and forecast (2023-2028) ($ million)
      • Chart on Lighting controls - Year-over-year growth (2023-2028) (%)
      • Data Table on Lighting controls - Year-over-year growth (2023-2028) (%)
    • 7.4 Programmable thermostats - Market size and forecast (2023-2028)
      • Chart on Programmable thermostats - Market size and forecast (2023-2028) ($ million)
      • Data Table on Programmable thermostats - Market size and forecast (2023-2028) ($ million)
      • Chart on Programmable thermostats - Year-over-year growth (2023-2028) (%)
      • Data Table on Programmable thermostats - Year-over-year growth (2023-2028) (%)
    • 7.5 Self-monitoring systems - Market size and forecast (2023-2028)
      • Chart on Self-monitoring systems - Market size and forecast (2023-2028) ($ million)
      • Data Table on Self-monitoring systems - Market size and forecast (2023-2028) ($ million)
      • Chart on Self-monitoring systems - Year-over-year growth (2023-2028) (%)
      • Data Table on Self-monitoring systems - Year-over-year growth (2023-2028) (%)
    • 7.6 Advanced central controllers - Market size and forecast (2023-2028)
      • Chart on Advanced central controllers - Market size and forecast (2023-2028) ($ million)
      • Data Table on Advanced central controllers - Market size and forecast (2023-2028) ($ million)
      • Chart on Advanced central controllers - Year-over-year growth (2023-2028) (%)
      • Data Table on Advanced central controllers - Year-over-year growth (2023-2028) (%)
    • 7.7 Market opportunity by Product
      • Market opportunity by Product ($ million)
      • Data Table on Market opportunity by Product ($ million)

    8 Market Segmentation by Technology

    • 8.1 Market segments
      • Chart on Technology - Market share (2023-2028) (%)
      • Data Table on Technology - Market share (2023-2028) (%)
    • 8.2 Comparison by Technology
      • Chart on Comparison by Technology
      • Data Table on Comparison by Technology
    • 8.3 Wireless Protocols - Market size and forecast (2023-2028)
      • Chart on Wireless Protocols - Market size and forecast (2023-2028) ($ million)
      • Data Table on Wireless Protocols - Market size and forecast (2023-2028) ($ million)
      • Chart on Wireless Protocols - Year-over-year growth (2023-2028) (%)
      • Data Table on Wireless Protocols - Year-over-year growth (2023-2028) (%)
    • 8.4 Wired Protocols - Market size and forecast (2023-2028)
      • Chart on Wired Protocols - Market size and forecast (2023-2028) ($ million)
      • Data Table on Wired Protocols - Market size and forecast (2023-2028) ($ million)
      • Chart on Wired Protocols - Year-over-year growth (2023-2028) (%)
      • Data Table on Wired Protocols - Year-over-year growth (2023-2028) (%)
    • 8.5 Hybrid - Market size and forecast (2023-2028)
      • Chart on Hybrid - Market size and forecast (2023-2028) ($ million)
      • Data Table on Hybrid - Market size and forecast (2023-2028) ($ million)
      • Chart on Hybrid - Year-over-year growth (2023-2028) (%)
      • Data Table on Hybrid - Year-over-year growth (2023-2028) (%)
    • 8.6 Market opportunity by Technology
      • Market opportunity by Technology ($ million)
      • Data Table on Market opportunity by Technology ($ million)

    9 Market Segmentation by Application

    • 9.1 Market segments
      • Chart on Application - Market share (2023-2028) (%)
      • Data Table on Application - Market share (2023-2028) (%)
    • 9.2 Comparison by Application
      • Chart on Comparison by Application
      • Data Table on Comparison by Application
    • 9.3 New Construction - Market size and forecast (2023-2028)
      • Chart on New Construction - Market size and forecast (2023-2028) ($ million)
      • Data Table on New Construction - Market size and forecast (2023-2028) ($ million)
      • Chart on New Construction - Year-over-year growth (2023-2028) (%)
      • Data Table on New Construction - Year-over-year growth (2023-2028) (%)
    • 9.4 Retrofit - Market size and forecast (2023-2028)
      • Chart on Retrofit - Market size and forecast (2023-2028) ($ million)
      • Data Table on Retrofit - Market size and forecast (2023-2028) ($ million)
      • Chart on Retrofit - Year-over-year growth (2023-2028) (%)
      • Data Table on Retrofit - Year-over-year growth (2023-2028) (%)
    • 9.5 Market opportunity by Application
      • Market opportunity by Application ($ million)
      • Data Table on Market opportunity by Application ($ million)

    10 Market Segmentation by Deployment Type

    • 10.1 Market segments
      • Chart on Deployment Type - Market share (2023-2028) (%)
      • Data Table on Deployment Type - Market share (2023-2028) (%)
    • 10.2 Comparison by Deployment Type
      • Chart on Comparison by Deployment Type
      • Data Table on Comparison by Deployment Type
    • 10.3 On-premises - Market size and forecast (2023-2028)
      • Chart on On-premises - Market size and forecast (2023-2028) ($ million)
      • Data Table on On-premises - Market size and forecast (2023-2028) ($ million)
      • Chart on On-premises - Year-over-year growth (2023-2028) (%)
      • Data Table on On-premises - Year-over-year growth (2023-2028) (%)
    • 10.4 Cloud - Market size and forecast (2023-2028)
      • Chart on Cloud - Market size and forecast (2023-2028) ($ million)
      • Data Table on Cloud - Market size and forecast (2023-2028) ($ million)
      • Chart on Cloud - Year-over-year growth (2023-2028) (%)
      • Data Table on Cloud - Year-over-year growth (2023-2028) (%)
    • 10.5 Market opportunity by Deployment Type
      • Market opportunity by Deployment Type ($ million)
      • Data Table on Market opportunity by Deployment Type ($ million)

    11 Customer Landscape

    • 11.1 Customer landscape overview
      • Analysis of price sensitivity, lifecycle, customer purchase basket, adoption rates, and purchase criteria

    12 Geographic Landscape

    • 12.1 Geographic segmentation
      • Chart on Market share by geography 2023-2028 (%)
      • Data Table on Market share by geography 2023-2028 (%)
    • 12.2 Geographic comparison
      • Chart on Geographic comparison
      • Data Table on Geographic comparison
    • 12.3 North America - Market size and forecast 2023-2028
      • Chart on North America - Market size and forecast 2023-2028 ($ million)
      • Data Table on North America - Market size and forecast 2023-2028 ($ million)
      • Chart on North America - Year-over-year growth 2023-2028 (%)
      • Data Table on North America - Year-over-year growth 2023-2028 (%)
    • 12.4 Europe - Market size and forecast 2023-2028
      • Chart on Europe - Market size and forecast 2023-2028 ($ million)
      • Data Table on Europe - Market size and forecast 2023-2028 ($ million)
      • Chart on Europe - Year-over-year growth 2023-2028 (%)
      • Data Table on Europe - Year-over-year growth 2023-2028 (%)
    • 12.5 APAC - Market size and forecast 2023-2028
      • Chart on APAC - Market size and forecast 2023-2028 ($ million)
      • Data Table on APAC - Market size and forecast 2023-2028 ($ million)
      • Chart on APAC - Year-over-year growth 2023-2028 (%)
      • Data Table on APAC - Year-over-year growth 2023-2028 (%)
    • 12.6 South America - Market size and forecast 2023-2028
      • Chart on South America - Market size and forecast 2023-2028 ($ million)
      • Data Table on South America - Market size and forecast 2023-2028 ($ million)
      • Chart on South America - Year-over-year growth 2023-2028 (%)
      • Data Table on South America - Year-over-year growth 2023-2028 (%)
    • 12.7 Middle East and Africa - Market size and forecast 2023-2028
      • Chart on Middle East and Africa - Market size and forecast 2023-2028 ($ million)
      • Data Table on Middle East and Africa - Market size and forecast 2023-2028 ($ million)
      • Chart on Middle East and Africa - Year-over-year growth 2023-2028 (%)
      • Data Table on Middle East and Africa - Year-over-year growth 2023-2028 (%)
    • 12.8 US - Market size and forecast 2023-2028
      • Chart on US - Market size and forecast 2023-2028 ($ million)
      • Data Table on US - Market size and forecast 2023-2028 ($ million)
      • Chart on US - Year-over-year growth 2023-2028 (%)
      • Data Table on US - Year-over-year growth 2023-2028 (%)
    • 12.9 China - Market size and forecast 2023-2028
      • Chart on China - Market size and forecast 2023-2028 ($ million)
      • Data Table on China - Market size and forecast 2023-2028 ($ million)
      • Chart on China - Year-over-year growth 2023-2028 (%)
      • Data Table on China - Year-over-year growth 2023-2028 (%)
    • 12.10 Germany - Market size and forecast 2023-2028
      • Chart on Germany - Market size and forecast 2023-2028 ($ million)
      • Data Table on Germany - Market size and forecast 2023-2028 ($ million)
      • Chart on Germany - Year-over-year growth 2023-2028 (%)
      • Data Table on Germany - Year-over-year growth 2023-2028 (%)
    • 12.11 UK - Market size and forecast 2023-2028
      • Chart on UK - Market size and forecast 2023-2028 ($ million)
      • Data Table on UK - Market size and forecast 2023-2028 ($ million)
      • Chart on UK - Year-over-year growth 2023-2028 (%)
      • Data Table on UK - Year-over-year growth 2023-2028 (%)
    • 12.12 France - Market size and forecast 2023-2028
      • Chart on France - Market size and forecast 2023-2028 ($ million)
      • Data Table on France - Market size and forecast 2023-2028 ($ million)
      • Chart on France - Year-over-year growth 2023-2028 (%)
      • Data Table on France - Year-over-year growth 2023-2028 (%)
    • 12.13 Market opportunity by geography
      • Market opportunity by geography ($ million)
      • Data Tables on Market opportunity by geography ($ million)
    • 12.14 Canada - Market size and forecast (2023-2028)
      • Chart on Canada - Market size and forecast (2023-2028) ($ million)
      • Data Table on Canada - Market size and forecast (2023-2028) ($ million)
      • Chart on Canada - Year-over-year growth (2023-2028) (%)
      • Data Table on Canada - Year-over-year growth (2023-2028) (%)
    • 12.15 Italy - Market size and forecast (2023-2028)
      • Chart on Italy - Market size and forecast (2023-2028) ($ million)
      • Data Table on Italy - Market size and forecast (2023-2028) ($ million)
      • Chart on Italy - Year-over-year growth (2023-2028) (%)
      • Data Table on Italy - Year-over-year growth (2023-2028) (%)
    • 12.16 India - Market size and forecast (2023-2028)
      • Chart on India - Market size and forecast (2023-2028) ($ million)
      • Data Table on India - Market size and forecast (2023-2028) ($ million)
      • Chart on India - Year-over-year growth (2023-2028) (%)
      • Data Table on India - Year-over-year growth (2023-2028) (%)
    • 12.17 Japan - Market size and forecast (2023-2028)
      • Chart on Japan - Market size and forecast (2023-2028) ($ million)
      • Data Table on Japan - Market size and forecast (2023-2028) ($ million)
      • Chart on Japan - Year-over-year growth (2023-2028) (%)
      • Data Table on Japan - Year-over-year growth (2023-2028) (%)
    • 12.18 Egypt - Market size and forecast (2023-2028)
      • Chart on Egypt - Market size and forecast (2023-2028) ($ million)
      • Data Table on Egypt - Market size and forecast (2023-2028) ($ million)
      • Chart on Egypt - Year-over-year growth (2023-2028) (%)
      • Data Table on Egypt - Year-over-year growth (2023-2028) (%)
    • 12.19 Oman - Market size and forecast (2023-2028)
      • Chart on Oman - Market size and forecast (2023-2028) ($ million)
      • Data Table on Oman - Market size and forecast (2023-2028) ($ million)
      • Chart on Oman - Year-over-year growth (2023-2028) (%)
      • Data Table on Oman - Year-over-year growth (2023-2028) (%)
    • 12.20 Argentina - Market size and forecast (2023-2028)
      • Chart on Argentina - Market size and forecast (2023-2028) ($ million)
      • Data Table on Argentina - Market size and forecast (2023-2028) ($ million)
      • Chart on Argentina - Year-over-year growth (2023-2028) (%)
      • Data Table on Argentina - Year-over-year growth (2023-2028) (%)
    • 12.21 UAE - Market size and forecast (2023-2028)
      • Chart on UAE - Market size and forecast (2023-2028) ($ million)
      • Data Table on UAE - Market size and forecast (2023-2028) ($ million)
      • Chart on UAE - Year-over-year growth (2023-2028) (%)
      • Data Table on UAE - Year-over-year growth (2023-2028) (%)
    • 12.22 Brazil - Market size and forecast (2023-2028)
      • Chart on Brazil - Market size and forecast (2023-2028) ($ million)
      • Data Table on Brazil - Market size and forecast (2023-2028) ($ million)
      • Chart on Brazil - Year-over-year growth (2023-2028) (%)
      • Data Table on Brazil - Year-over-year growth (2023-2028) (%)
    • 12.23 Rest of World (ROW) - Market size and forecast (2023-2028)
      • Chart on Rest of World (ROW) - Market size and forecast (2023-2028) ($ million)
      • Data Table on Rest of World (ROW) - Market size and forecast (2023-2028) ($ million)
      • Chart on Rest of World (ROW) - Year-over-year growth (2023-2028) (%)
      • Data Table on Rest of World (ROW) - Year-over-year growth (2023-2028) (%)

    13 Drivers, Challenges, and Opportunity/Restraints

    • 13.1 Market drivers
      • 13.2 Market challenges
        • 13.3 Impact of drivers and challenges
          • Impact of drivers and challenges in 2023 and 2028
        • 13.4 Market opportunities/restraints

          14 Competitive Landscape

          • 14.1 Overview
            • 14.2 Competitive Landscape
              • Overview on criticality of inputs and factors of differentiation
            • 14.3 Landscape disruption
              • Overview on factors of disruption
            • 14.4 Industry risks
              • Impact of key risks on business

            15 Competitive Analysis

            • 15.1 Companies profiled
              • Companies covered
            • 15.2 Market positioning of companies
              • Matrix on companies position and classification
            • 15.3 ABB Ltd.
              • ABB Ltd. - Overview
              • ABB Ltd. - Product / Service
              • ABB Ltd. - Key offerings
            • 15.4 Amazon.com Inc.
              • Amazon.com Inc. - Overview
              • Amazon.com Inc. - Product / Service
              • Amazon.com Inc. - Key offerings
            • 15.5 Bosch Thermotechnology Corp.
              • Bosch Thermotechnology Corp. - Overview
              • Bosch Thermotechnology Corp. - Product / Service
              • Bosch Thermotechnology Corp. - Key offerings
            • 15.6 Delta Electronics Inc.
              • Delta Electronics Inc. - Overview
              • Delta Electronics Inc. - Product / Service
              • Delta Electronics Inc. - Key offerings
            • 15.7 Eaton Corporation Plc
              • Eaton Corporation Plc - Overview
              • Eaton Corporation Plc - Product / Service
              • Eaton Corporation Plc - Key offerings
            • 15.8 Ecobee Inc.
              • Ecobee Inc. - Overview
              • Ecobee Inc. - Product / Service
              • Ecobee Inc. - Key offerings
            • 15.9 Emerson Electric Co.
              • Emerson Electric Co. - Overview
              • Emerson Electric Co. - Product / Service
              • Emerson Electric Co. - Key offerings
            • 15.10 Google LLC
              • Google LLC - Overview
              • Google LLC - Product / Service
              • Google LLC - Key offerings
            • 15.11 Hitachi Ltd.
              • Hitachi Ltd. - Overview
              • Hitachi Ltd. - Product / Service
              • Hitachi Ltd. - Key offerings
            • 15.12 Honeywell International Inc.
              • Honeywell International Inc. - Overview
              • Honeywell International Inc. - Product / Service
              • Honeywell International Inc. - Key offerings
            • 15.13 Johnson Controls International Plc
              • Johnson Controls International Plc - Overview
              • Johnson Controls International Plc - Product / Service
              • Johnson Controls International Plc - Key offerings
            • 15.14 LG Electronics Inc.
              • LG Electronics Inc. - Overview
              • LG Electronics Inc. - Product / Service
              • LG Electronics Inc. - Key offerings
            • 15.15 LUX Products Corporation
              • LUX Products Corporation - Overview
              • LUX Products Corporation - Product / Service
              • LUX Products Corporation - Key offerings
            • 15.16 Netatmo (Legrand)
              • Netatmo (Legrand) - Overview
              • Netatmo (Legrand) - Product / Service
              • Netatmo (Legrand) - Key offerings
            • 15.17 Panasonic Corporation
              • Panasonic Corporation - Overview
              • Panasonic Corporation - Product / Service
              • Panasonic Corporation - Key offerings
            • 15.18 Resideo Technologies Inc.
              • Resideo Technologies Inc. - Overview
              • Resideo Technologies Inc. - Product / Service
              • Resideo Technologies Inc. - Key offerings
            • 15.19 Samsung Electronics Co. Ltd.
              • Samsung Electronics Co. Ltd. - Overview
              • Samsung Electronics Co. Ltd. - Product / Service
              • Samsung Electronics Co. Ltd. - Key offerings
            • 15.20 Schneider Electric SE
              • Schneider Electric SE - Overview
              • Schneider Electric SE - Product / Service
              • Schneider Electric SE - Key offerings
            • 15.21 Siemens AG
              • Siemens AG - Overview
              • Siemens AG - Product / Service
              • Siemens AG - Key offerings
            • 15.22 Tado GmbH
              • Tado GmbH - Overview
              • Tado GmbH - Product / Service
              • Tado GmbH - Key offerings
            • 15.23 Capgemini Service SAS
              • Capgemini Service SAS - Overview
              • Capgemini Service SAS - Product / Service
              • Capgemini Service SAS - Key offerings
            • 15.24 Carrier Global Corp.
              • Carrier Global Corp. - Overview
              • Carrier Global Corp. - Product / Service
              • Carrier Global Corp. - Key offerings
            • 15.25 Cisco Systems Inc.
              • Cisco Systems Inc. - Overview
              • Cisco Systems Inc. - Product / Service
              • Cisco Systems Inc. - Key offerings
            • 15.26 Comcast Corp.
              • Comcast Corp. - Overview
              • Comcast Corp. - Product / Service
              • Comcast Corp. - Key offerings
            • 15.27 ecobee
              • ecobee - Overview
              • ecobee - Product / Service
              • ecobee - Key offerings
            • 15.28 Emerson Electric Co.
              • Emerson Electric Co. - Overview
              • Emerson Electric Co. - Product / Service
              • Emerson Electric Co. - Key offerings
            • 15.29 General Electric Co.
              • General Electric Co. - Overview
              • General Electric Co. - Product / Service
              • General Electric Co. - Key offerings
            • 15.30 Honeywell International Inc.
              • Honeywell International Inc. - Overview
              • Honeywell International Inc. - Product / Service
              • Honeywell International Inc. - Key offerings
            • 15.31 Intel Corp.
              • Intel Corp. - Overview
              • Intel Corp. - Product / Service
              • Intel Corp. - Key offerings
            • 15.32 Johnson Controls International Plc.
              • Johnson Controls International Plc. - Overview
              • Johnson Controls International Plc. - Product / Service
              • Johnson Controls International Plc. - Key offerings
            • 15.33 Lennox International Inc.
              • Lennox International Inc. - Overview
              • Lennox International Inc. - Product / Service
              • Lennox International Inc. - Key offerings
            • 15.34 Liricco Technologies Ltd.
              • Liricco Technologies Ltd. - Overview
              • Liricco Technologies Ltd. - Product / Service
              • Liricco Technologies Ltd. - Key offerings
            • 15.35 Panasonic Holdings Corp.
              • Panasonic Holdings Corp. - Overview
              • Panasonic Holdings Corp. - Product / Service
              • Panasonic Holdings Corp. - Key offerings
            • 15.36 Resideo Technologies Inc.
              • Resideo Technologies Inc. - Overview
              • Resideo Technologies Inc. - Product / Service
              • Resideo Technologies Inc. - Key offerings
            • 15.37 Robert Bosch GmbH
              • Robert Bosch GmbH - Overview
              • Robert Bosch GmbH - Product / Service
              • Robert Bosch GmbH - Key offerings
            • 15.38 Schneider Electric SE
              • Schneider Electric SE - Overview
              • Schneider Electric SE - Product / Service
              • Schneider Electric SE - Key offerings
            • 15.39 Siemens AG
              • Siemens AG - Overview
              • Siemens AG - Product / Service
              • Siemens AG - Key offerings
            • 15.40 Snap One LLC
              • Snap One LLC - Overview
              • Snap One LLC - Product / Service
              • Snap One LLC - Key offerings
            • 15.41 tado GmbH
              • tado GmbH - Overview
              • tado GmbH - Product / Service
              • tado GmbH - Key offerings
            • 15.42 Vivint Inc.
              • Vivint Inc. - Overview
              • Vivint Inc. - Product / Service
              • Vivint Inc. - Key offerings

            16 Appendix

            • 16.1 Scope of the report
              • 16.2 Inclusions and exclusions checklist
                • Inclusions checklist
                • Exclusions checklist
              • 16.3 Currency conversion rates for US$
                • Currency conversion rates for US$
              • 16.4 Research methodology
                • Research methodology
              • 16.5 Data procurement
                • Information sources
              • 16.6 Data validation
                • Data validation
              • 16.7 Validation techniques employed for market sizing
                • Validation techniques employed for market sizing
              • 16.8 Data synthesis
                • Data synthesis
              • 16.9 360 degree market analysis
                • 360 degree market analysis
              • 16.10 List of abbreviations
                • List of abbreviations

              Research Methodology

              Technavio presents a detailed picture of the market by way of study, synthesis, and summation of data from multiple sources. The analysts have presented the various facets of the market with a particular focus on identifying the key industry influencers. The data thus presented is comprehensive, reliable, and the result of extensive research, both primary and secondary.

              INFORMATION SOURCES

              Primary sources

              • Manufacturers and suppliers
              • Channel partners
              • Industry experts
              • Strategic decision makers

              Secondary sources

              • Industry journals and periodicals
              • Government data
              • Financial reports of key industry players
              • Historical data
              • Press releases

              DATA ANALYSIS

              Data Synthesis

              • Collation of data
              • Estimation of key figures
              • Analysis of derived insights

              Data Validation

              • Triangulation with data models
              • Reference against proprietary databases
              • Corroboration with industry experts

              REPORT WRITING

              Qualitative

              • Market drivers
              • Market challenges
              • Market trends
              • Five forces analysis

              Quantitative

              • Market size and forecast
              • Market segmentation
              • Geographical insights
              • Competitive landscape

              Interested in this report?

              Get your sample now to see our research methodology and insights!

              Download Now

              Frequently Asked Questions

              Home Energy Management Systems market growth will increase by $ 1970.1 mn during 2024-2028 .

              The Home Energy Management Systems market is expected to grow at a CAGR of 10.01% during 2024-2028 .

              Home Energy Management Systems market is segmented by Component( Hardware, Software, Services, Advanced central controllers) Product( Lighting controls, Programmable thermostats, Self-monitoring systems, Advanced central controllers, MEA)

              ABB Ltd., Amazon.com Inc., Bosch Thermotechnology Corp., Delta Electronics Inc., Eaton Corporation Plc, Ecobee Inc., Emerson Electric Co., Google LLC, Hitachi Ltd., Honeywell International Inc., Johnson Controls International Plc, LG Electronics Inc., LUX Products Corporation, Netatmo (Legrand), Panasonic Corporation, Resideo Technologies Inc., Samsung Electronics Co. Ltd., Schneider Electric SE, Siemens AG, Tado GmbH are a few of the key vendors in the Home Energy Management Systems market.

              North America will register the highest growth rate of 34% among the other regions. Therefore, the Home Energy Management Systems market in North America is expected to garner significant business opportunities for the vendors during the forecast period.

              US, Canada, Germany, UK, Italy, France, China, India, Japan, Brazil, Egypt, UAE, Oman, Argentina, UAE, Brazil, Rest of World (ROW)

              • Growing adoption of smart grid technologiesThe growing adoption of smart grids is one of the key factors for the increased use of home energy management system. Globally is the driving factor this market.
              • utilities are adopting smart grid technologies as a measure to improve the reliability of the grid and achieve energy efficiency. Technologies such as remote terminal units is the driving factor this market.
              • intelligent electronic devices is the driving factor this market.
              • and other supervisory control and data acquisition systems are being adopted in the transmission and distribution infrastructure is the driving factor this market.
              • while smart meters are being installed in consumer homes. Smart meters are the essential link between utilities and homeowners; they enable utilities to have bi-directional communication with their customers. Smart meters provide real-time or near real-time energy consumption is the driving factor this market.
              • enabling consumers to evaluate or know the areas of energy. The information provided helps consumers adopt energy conservation measures such as the use of smart thermostats. Some utilities provide an in-home display (IHD) when they install a smart meter. The IHD provides information on energy costs is the driving factor this market.
              • which makes consumers make better decisions related to their energy consumption. The governments in countries such as the US is the driving factor this market.
              • the UK is the driving factor this market.
              • Canada is the driving factor this market.
              • and the countries with the EU are installing smart meters. For instance is the driving factor this market.
              • in the UK is the driving factor this market.
              • in 2012 is the driving factor this market.
              • the government announced that smart meters must be fitted in all homes and businesses until mid-2025. As the installation of smart meters continues is the driving factor this market.
              • consumers will be encouraged to adopt home energy management systems to participate in demand response (DR) and improve energy efficiency at the household level. Hence is the driving factor this market.
              • the growing adoption of smart grid technologies is expected to boost the growth of the global home energy management systems market during the forecast period. is the driving factor this market.

              The Home Energy Management Systems market vendors should focus on grabbing business opportunities from the Hardware segment as it accounted for the largest market share in the base year.