
Hospitality Real Estate Market Size 2025-2029
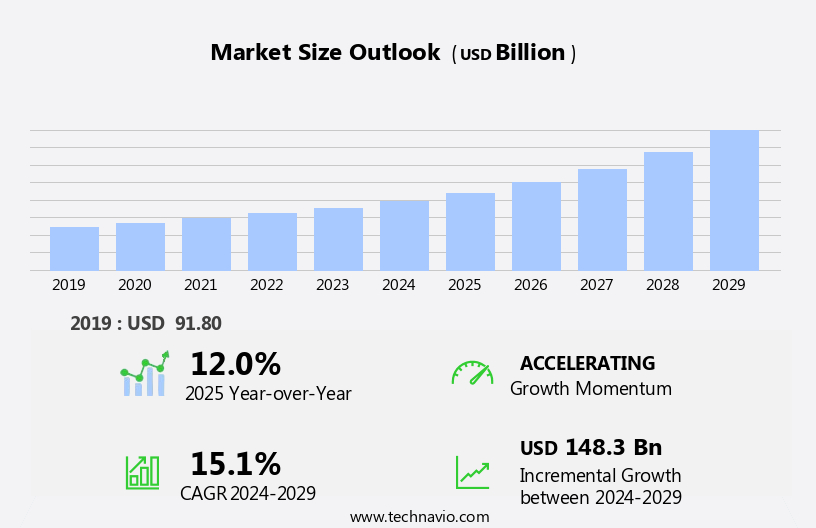
The hospitality real estate market size is forecast to increase by USD 148.3 billion, at a CAGR of 15.1% between 2024 and 2029.
- The market is experiencing significant shifts, driven by the increasing prevalence of quick-service restaurants and the adoption of technology in the industry. The proliferation of quick-service restaurants signifies a growing demand for flexible and cost-effective real estate solutions, as these businesses often require smaller footprints and lower overhead costs compared to traditional full-service restaurants. Meanwhile, technological advancements are revolutionizing the real estate sector, enabling more efficient property management, improved customer experiences, and enhanced data analysis. However, the market faces challenges, including uncertain macroeconomic conditions that can impact investment decisions and the overall economic health of the hospitality industry.
- These challenges necessitate strategic planning and adaptability from industry players, as they navigate the evolving market landscape. Companies seeking to capitalize on opportunities and mitigate risks must stay informed of these trends and be prepared to respond effectively to the dynamic market conditions.
What will be the Size of the Hospitality Real Estate Market during the forecast period?
Explore in-depth regional segment analysis with market size data - historical 2019-2023 and forecasts 2025-2029 - in the full report.
Request Free Sample
The market continues to evolve, with dynamic market dynamics shaping various sectors. Guest service technologies and hotel management systems are increasingly integrated to enhance customer satisfaction and streamline operations. Regulations and property valuation play crucial roles in hotel financing, while smart room technology , hospitatlity robots and high-speed internet are essential for attracting guests. Interior design and sustainable building practices are key considerations for construction management, as digital marketing and social media engagement drive demand. Hotel ratings and branding strategies are shaped by reputation management and yield management strategies. Energy efficiency and concierge services are essential hotel amenities, with public relations and sales and reservations systems optimized for seamless guest experiences.
Guest feedback and staff training are integral to risk management and hotel operations, while occupancy rate and due diligence are crucial for effective revenue management. Hotel construction and site selection are influenced by zoning laws and building codes, with meeting rooms, banquet facilities, fitness centers, and spa services adding value to properties. Lease agreements and building permits are essential for property management, while wi-fi networks and meeting room technology support productivity and convenience. Security systems and accessibility standards ensure guest safety and compliance, with revenue management software and loyalty programs driving repeat business. Digital Signage and supply chain management optimize operational efficiency, while inventory management and employee scheduling systems support effective hotel operations.
How is this Hospitality Real Estate Industry segmented?
The hospitality real estate industry research report provides comprehensive data (region-wise segment analysis), with forecasts and estimates in "USD billion" for the period 2025-2029, as well as historical data from 2019-2023 for the following segments.
- Application
- Full service restaurants
- Quick service establishments
- Catering services
- Type
- Hotels and accommodation
- Spas and resorts
- Other services
- Sector
- Owned and operated
- Franchised properties
- Real estate investment trusts
- Management contracts
- End-User
- Business Travelers
- Leisure Travelers
- Event Organizers
- Geography
- North America
- US
- Canada
- Europe
- France
- Germany
- Italy
- UK
- APAC
- China
- India
- Japan
- South America
- Brazil
- Rest of World (ROW)
- North America
By Application Insights
The full service restaurants segment is estimated to witness significant growth during the forecast period.
The hospitality industry continues to evolve, with guest service technologies and hotel management systems playing a pivotal role in enhancing customer satisfaction. Hotel regulations ensure safety and compliance, while property valuation and hotel financing facilitate growth. Smart room technology, high-speed internet, and digital marketing are essential amenities for modern travelers. Sustainable building practices and interior design are key trends, with a focus on energy efficiency and accessibility standards. Maintenance and repair, supply chain management, and wi-fi networks ensure smooth hotel operations. Lease agreements, hotel ratings, and revenue management software help in effective business management. Hotel construction, site selection, and zoning laws are crucial aspects of expansion.
Meeting rooms, banquet facilities, fitness centers, and spa services cater to diverse guest needs. Branding strategies, reputation management, and yield management strategies are essential for competitive edge. Hotel booking platforms facilitate reservations, while concierge services and sales and reservations teams cater to guest needs. Guest feedback, staff training, and risk management ensure quality service. Hotel technology infrastructure, public relations, and hotel amenities contribute to a memorable guest experience. Occupancy rate, due diligence, and loyalty programs are essential for business traveler success. In this dynamic market, understanding these trends and incorporating them effectively is the key to thriving in the hospitality industry.
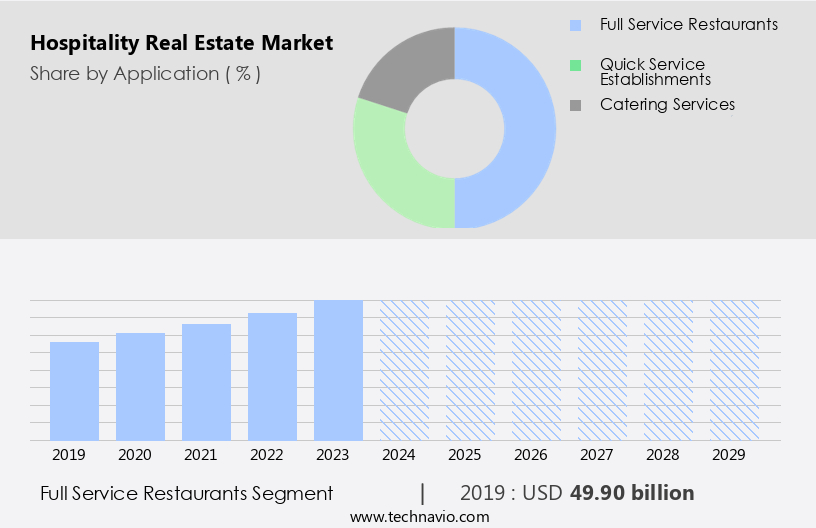
The Full service restaurants segment was valued at USD 49.90 billion in 2019 and showed a gradual increase during the forecast period.
Regional Analysis
North America is estimated to contribute 34% to the growth of the global market during the forecast period.Technavio's analysts have elaborately explained the regional trends and drivers that shape the market during the forecast period.

In the dynamic hospitality industry, various entities play integral roles in shaping market trends and dynamics. Guest service technologies and hotel management systems enhance operational efficiency and elevate customer experiences. Hotel regulations ensure safety and compliance, while property valuation and hotel financing facilitate growth and development. Smart room technology, high-speed internet, and digital marketing attract and retain guests. Sustainable building practices, maintenance and repair, and construction management minimize environmental impact and ensure durability. Meeting rooms, employee scheduling, and supply chain management optimize resources and productivity. Wi-fi networks, lease agreements, and hotel ratings provide valuable insights for decision-making.
Hotel construction, site selection, and zoning laws shape the physical landscape of the industry. Room service, inventory management, and social media marketing engage guests and build loyalty. Building codes, hotel marketing, and green building certifications promote sustainability and adherence to standards. Banquet facilities, building permits, fitness centers, and spa services cater to diverse guest needs. Branding strategies, accessibility standards, revenue management software, reputation management, and yield management strategies optimize revenue and customer satisfaction. Hotel booking platforms, energy efficiency, concierge services, and hotel technology and managements infrastructure streamline operations and enhance guest experiences. Public relations, hotel amenities, sales and reservations, guest feedback, staff training, risk management, and hotel operations ensure smooth and profitable business operations. Occupancy rate, due diligence, and loyalty programs are essential metrics for measuring success and growth.
Market Dynamics
Our researchers analyzed the data with 2024 as the base year, along with the key drivers, trends, and challenges. A holistic analysis of drivers will help companies refine their marketing strategies to gain a competitive advantage.
The intersection of travel, tourism, and real estate, the hospitality industry presents unique opportunities for investors seeking stable returns. This vibrant market encompasses a diverse range of properties, from luxury resorts and full-service hotels to extended-stay apartments and vacation rentals. Hospitality real estate assets are characterized by their income-generating potential, with revenue streams derived from room rentals, food and beverage sales, and additional services. Location plays a pivotal role in the success of hospitality real estate, with desirable factors including proximity to tourist attractions, transportation hubs, and business centers. Other essential elements include strong demand, competitive pricing, and operational efficiency. Amenities, such as swimming pools, fitness centers, and spas, add value and enhance the guest experience. Investors must navigate various challenges, including economic cycles, changing consumer preferences, and technological advancements. Adaptability and innovation are crucial, with trends like sustainable practices, contactless services, and personalized experiences shaping the future of the market.
What are the key market drivers leading to the rise in the adoption of Hospitality Real Estate Industry?
- The increase in the number of quick-service restaurants serves as the primary driver for market growth in this sector.
- The market is experiencing significant growth due to various factors. One key driver is the increasing demand for meeting spaces and customer satisfaction in the business sector. Consequently, there is a rising need for modern buildings equipped with advanced security systems, efficient employee scheduling tools, and high-speed wi-fi networks. Additionally, supply chain management is becoming increasingly important, necessitating the development of large, centrally located facilities. Lease agreements are another crucial aspect of the market. Hotel ratings and construction continue to influence site selection, with developers prioritizing areas that cater to both business and leisure travelers. Zoning laws and inventory management also play a vital role in the success of hospitality businesses.
- Moreover, the hospitality industry's focus on enhancing the guest experience extends to room service and other amenities. Effective management of these services and resources is essential to maintaining customer satisfaction and retention. Overall, the market is dynamic and evolving, presenting both opportunities and challenges for investors and developers.
What are the market trends shaping the Hospitality Real Estate Industry?
- The real estate industry is experiencing a significant trend towards technological adoption. This includes the use of advanced tools and systems for property listings, virtual tours, and remote transactions. Technological innovations are becoming mandatory for professionals seeking to stay competitive in the market.
- The market is experiencing significant technological advancements, transforming commercial properties and benefiting various stakeholders. One emerging trend is the adoption of smart sensor technology, which not only contributes to green building certifications but also enhances energy savings. Another trend is the implementation of cloud technology, enabling property managers to collect and analyze leasing data from multiple properties in a centralized database. Moreover, technology plays a crucial role in hotel marketing through social media platforms, branding strategies, and reputation management. Building codes and accessibility standards are also being addressed with the help of technology, ensuring compliance and enhancing the guest experience.
- Additionally, revenue management software and yield management strategies are essential tools for optimizing occupancy rates and maximizing revenue. Fitness centers and spa services can also be managed more efficiently with technology, providing tenants with added value and convenience. Building permits can be obtained more efficiently through digital applications and approvals, streamlining the development process. Overall, technology adoption in the market is driving productivity, cost savings, and enhanced guest experiences.
What challenges does the Hospitality Real Estate Industry face during its growth?
- The industry's growth is negatively impacted by uncertain macroeconomic conditions, which pose a significant challenge.
- The market is influenced by various factors, including economic conditions, technology, and guest preferences. The moderate to slow growth and volatility of the US and global economies pose a risk to the industry, as uncertain economic conditions may lead to decreased demand for commercial spaces due to customers postponing spending. Macroeconomic factors such as labor and healthcare costs, access to credit, and non-residential real estate markets also impact the demand. Technology plays a significant role in the hospitality industry, with hotel technology infrastructure, hotel booking platforms, and concierge services becoming increasingly important. Energy efficiency is another key trend, as hotels seek to reduce operating costs and appeal to eco-conscious guests.
- Hotel amenities, sales and reservations, guest feedback, and staff training are essential components of hotel operations that require ongoing attention. Risk management is crucial in the hospitality industry, with public relations and security being critical areas of focus. Hotel technology infrastructure, including cybersecurity, is essential to protect guest data and maintain a positive reputation. Effective sales and reservations systems, guest feedback mechanisms, and staff training programs can help improve the guest experience and increase occupancy rates. Due diligence is essential when investing in hospitality real estate, with careful consideration given to market conditions, location, competition, and operational efficiency.
- Regular review and analysis of these factors are necessary to ensure the long-term success of hospitality real estate investments.
Exclusive Customer Landscape
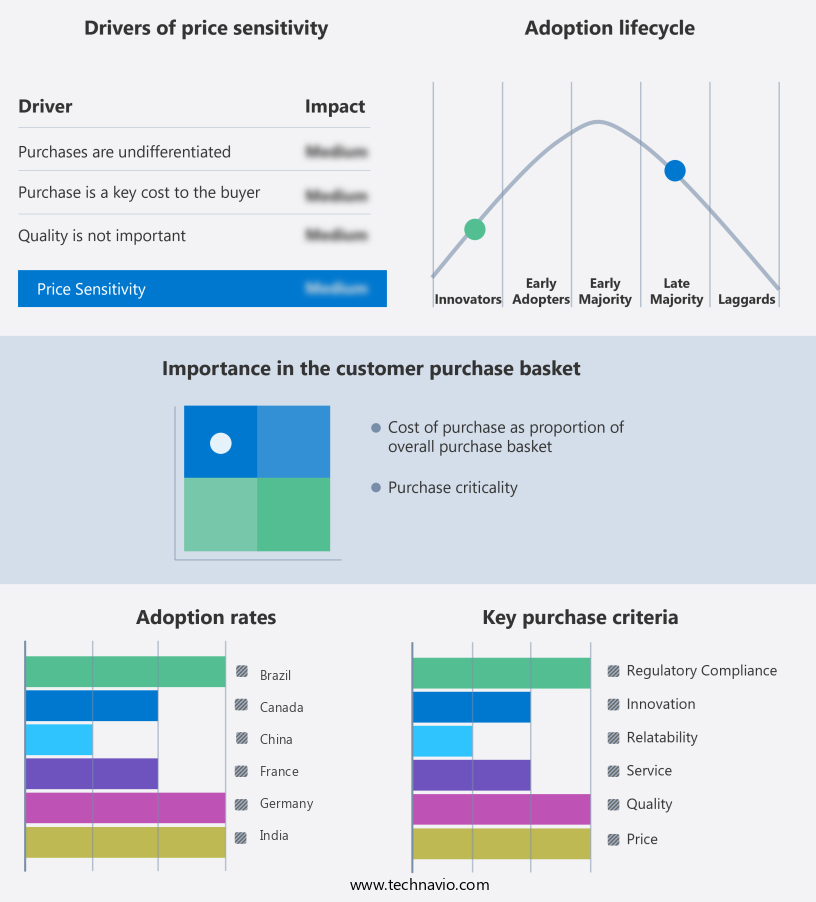
The hospitality real estate market forecasting report includes the adoption lifecycle of the market, covering from the innovator's stage to the laggard's stage. It focuses on adoption rates in different regions based on penetration. Furthermore, the hospitality real estate market report also includes key purchase criteria and drivers of price sensitivity to help companies evaluate and develop their market growth analysis strategies.
Customer Landscape
Key Companies & Market Insights
Companies are implementing various strategies, such as strategic alliances, hospitality real estate market forecast, partnerships, mergers and acquisitions, geographical expansion, and product/service launches, to enhance their presence in the industry.
Apple Hospitality REIT Inc. - The company specializes in the acquisition and management of hospitality real estate properties, including Embassy Suites, Homewood Suites, and Springhill Suites. Our portfolio caters to the growing demand for extended-stay accommodations, providing travelers with comfortable and convenient lodging solutions. Each property undergoes rigorous renovation and maintenance to ensure a superior guest experience. By implementing innovative marketing strategies and leveraging advanced technology, we maximize occupancy rates and enhance revenue generation. Our commitment to operational excellence and customer satisfaction sets US apart in the competitive hospitality industry.
The industry research and growth report includes detailed analyses of the competitive landscape of the market and information about key companies, including:
- Apple Hospitality REIT Inc.
- Atrium Hospitality LP
- Best Western International Inc.
- Choice Hotels International Inc.
- Extended Stay America
- G6 Hospitality LLC
- Hilton Worldwide Holdings Inc.
- Host Hotels and Resorts Inc.
- Huazhu Group Ltd.
- Hyatt Hotels Corp.
- InterContinental Hotels Group Plc
- Jones Lang LaSalle Inc.
- Marriott International Inc.
- OTO Development
- Sonesta International Hotels Corp.
- The Georgetown Co. LLC
- Wyndham Hotels and Resorts Inc.
Qualitative and quantitative analysis of companies has been conducted to help clients understand the wider business environment as well as the strengths and weaknesses of key industry players. Data is qualitatively analyzed to categorize companies as pure play, category-focused, industry-focused, and diversified; it is quantitatively analyzed to categorize companies as dominant, leading, strong, tentative, and weak.
Recent Development and News in Hospitality Real Estate Market
- In January 2024, Marriott International announced the acquisition of European boutique hotel chain, Eurostars Hotels, for approximately â¬2.8 billion. This strategic move expanded Marriott's European footprint and added 135 hotels to its portfolio (Marriott International Inc., 2024).
- In March 2024, Hilton Worldwide and Airbnb signed a partnership agreement, allowing Hilton Honors members to earn and redeem points for select Airbnb stays. This collaboration marked the first time a major hotel chain integrated Airbnb into its loyalty program (Hilton Worldwide, 2024).
- In May 2024, Starwood Capital Group closed a USD7.6 billion fund dedicated to hospitality real estate investments. This fund, the largest of its kind, would focus on acquiring, developing, and repositioning hotels and resorts worldwide (Starwood Capital Group, 2024).
- In January 2025, AccorHotels and sbe Entertainment Group announced a strategic partnership to develop and operate Moxy and Mondrian hotels under the AccorHotels brand. This collaboration combined AccorHotels' global reach and sbe's lifestyle expertise, aiming to attract a younger demographic (AccorHotels, 2025).
Research Analyst Overview
- In the dynamic the market, sustainability initiatives are gaining momentum with water conservation and energy-efficient appliances becoming essential elements in hotel design trends. Building materials with high insulation properties and accessibility compliance are prioritized for energy savings and inclusivity. Property insurance, fire safety systems, and waste management are crucial considerations for ensuring operational efficiency and reducing risks. Extended stay hotels and resort properties continue to attract investors due to their potential for stable rental income. Mixed-use developments, including hotel franchising and commercial real estate, offer opportunities for capital appreciation. Boutique hotels and luxury properties, with their unique architectural design, cater to discerning travelers seeking personalized experiences.
- Management contracts and property taxes are essential aspects of hotel operations, requiring careful consideration. Short-term rentals and vacation rentals are disrupting traditional hotel models, necessitating adaptive strategies. Landscape architecture and community engagement contribute to enhancing guest experiences and fostering loyalty. Hotel developers and investors must navigate these trends while ensuring compliance with fire safety systems, building codes, and accessibility regulations. Sustainability, design, and operational efficiency are key drivers in the evolving hospitality real estate landscape.
Dive into Technavio's robust research methodology, blending expert interviews, extensive data synthesis, and validated models for unparalleled Hospitality Real Estate Market insights. See full methodology.
|
Market Scope |
|
|
Report Coverage |
Details |
|
Page number |
205 |
|
Base year |
2024 |
|
Historic period |
2019-2023 |
|
Forecast period |
2025-2029 |
|
Growth momentum & CAGR |
Accelerate at a CAGR of 15.1% |
|
Market growth 2025-2029 |
USD 148.3 billion |
|
Market structure |
Fragmented |
|
YoY growth 2024-2025(%) |
12.0 |
|
Key countries |
US, Germany, China, UK, France, Italy, Brazil, Japan, Canada, and India |
|
Competitive landscape |
Leading Companies, Market Positioning of Companies, Competitive Strategies, and Industry Risks |
What are the Key Data Covered in this Hospitality Real Estate Market Research and Growth Report?
- CAGR of the Hospitality Real Estate industry during the forecast period
- Detailed information on factors that will drive the growth and forecasting between 2025 and 2029
- Precise estimation of the size of the market and its contribution of the industry in focus to the parent market
- Accurate predictions about upcoming growth and trends and changes in consumer behaviour
- Growth of the market across North America, Europe, APAC, South America, and Middle East and Africa
- Thorough analysis of the market's competitive landscape and detailed information about companies
- Comprehensive analysis of factors that will challenge the hospitality real estate market growth of industry companies
We can help! Our analysts can customize this hospitality real estate market research report to meet your requirements.
 RIA -
RIA - 
