Human Liver Models Market Analysis, Size, and Forecast 2026-2030: North America (US, Canada, and Mexico), Europe (Germany, UK, and France), APAC (China, Japan, and India), South America (Brazil and Argentina), Middle East and Africa (Saudi Arabia, South Africa, and UAE), Asia, Rest of World (ROW)

Human Liver Models Market Analysis, Size, and Forecast 2026-2030:
North America (US, Canada, and Mexico), Europe (Germany, UK, and France), APAC (China, Japan, and India), South America (Brazil and Argentina), Middle East and Africa (Saudi Arabia, South Africa, and UAE), Asia, Rest of World (ROW)

Published: Jan 2026 296 Pages SKU: IRTNTR72592

Market Overview at a Glance

$5.17 B
Market Opportunity
21.3%
CAGR 2025 - 2030
40.3%
North America Growth
$1.47 B
Liver organoids segment 2024

Human Liver Models Market Size 2026-2030

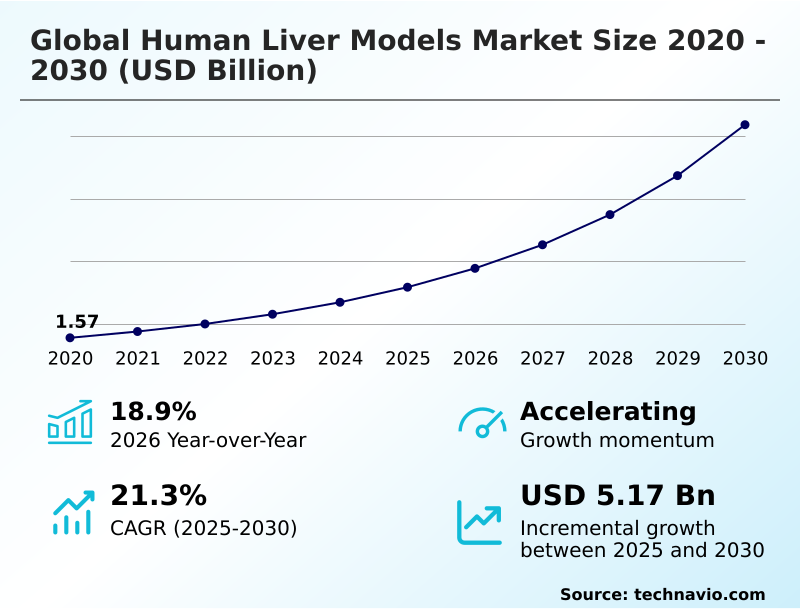
The human liver models market size is valued to increase by USD 5.17 billion, at a CAGR of 21.3% from 2025 to 2030. Technological convergence of AI and bioengineering will drive the human liver models market.

Major Market Trends & Insights

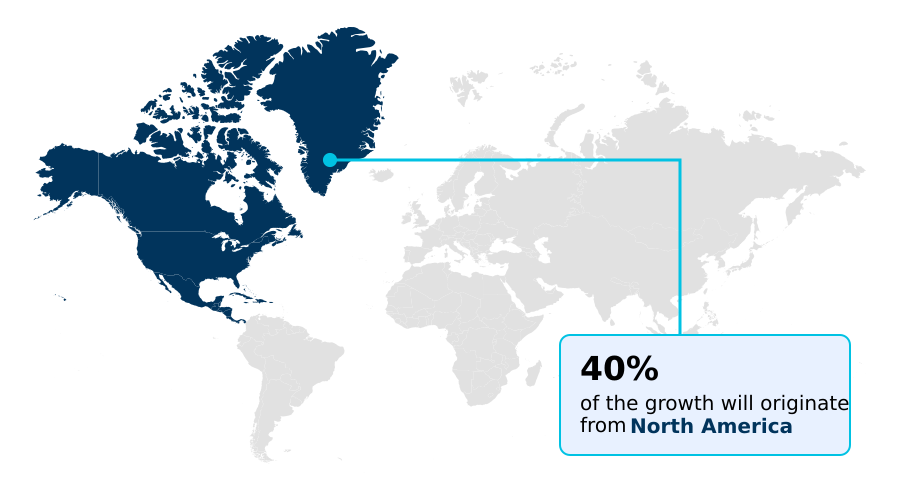
  • North America dominated the market and accounted for a 40.3% growth during the forecast period.
  • By Type - Liver organoids segment was valued at USD 1.47 billion in 2024
  • By Application - ADME studies segment accounted for the largest market revenue share in 2024

Market Size & Forecast

  • Market Opportunities: USD 6.77 billion
  • Market Future Opportunities: USD 5.17 billion
  • CAGR from 2025 to 2030 : 21.3%

Market Summary

  • The human liver models market is undergoing a significant transformation, driven by the pressing need for more predictive and human-relevant preclinical tools. A major catalyst is the convergence of advanced tissue engineering with AI-driven drug discovery, which demands the high-quality, human-specific data that engineered liver models provide.
  • This symbiotic relationship is accelerating the move away from traditional animal testing, further supported by regulatory tailwinds like the FDA Modernization Act 2.0. A key trend is the specialization of platforms, such as liver-on-a-chip and 3D microtissues, for evaluating advanced therapeutic modalities, including gene therapies and antibody-drug conjugates.
  • For instance, a biotechnology firm can now use a microphysiological system to model lipid nanoparticle delivery and first-pass metabolism with greater accuracy. However, widespread adoption is tempered by the high implementation costs and technical complexity of these systems.
  • The operational expertise required to run perfusion systems and ensure biological reproducibility presents a considerable barrier for smaller labs, highlighting an ongoing tension between innovation and accessibility. This dynamic shapes a market landscape where cutting-edge predictive toxicology and disease modelling capabilities are balanced against practical challenges of cost and scalability.

What will be the Size of the Human Liver Models Market during the forecast period?

Get Key Insights on Market Forecast (PDF) Request Free Sample

How is the Human Liver Models Market Segmented?

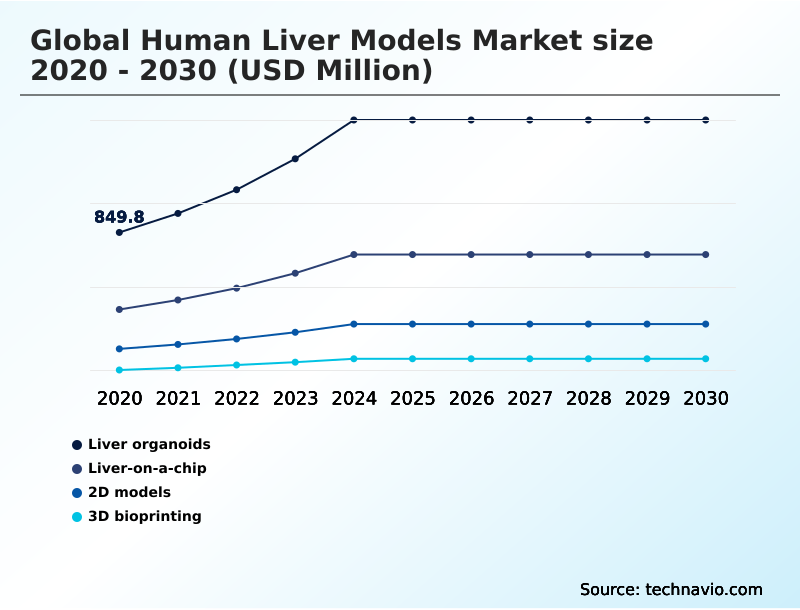
The human liver models industry research report provides comprehensive data (region-wise segment analysis), with forecasts and estimates in "USD million" for the period 2026-2030, as well as historical data from 2020-2024 for the following segments.

  • Type
    • Liver organoids
    • Liver-on-a-chip
    • 2D models
    • 3D bioprinting
  • Application
    • ADME studies
    • Toxicology testing
    • Disease modelling
    • Others
  • End-user
    • Pharmaceutical and biotechnology companies
    • Contract research organizations
    • Academic and research institutes
  • Geography
    • North America
      • US
      • Canada
      • Mexico
    • Europe
      • Germany
      • UK
      • France
    • Asia
    • Rest of World (ROW)

By Type Insights

The liver organoids segment is estimated to witness significant growth during the forecast period.

The liver organoids segment is advancing through innovations that overcome previous logistical and functional limitations.

A critical development is the ability to maintain functional in vitro models using stem-cell-derived hepatocytes at ambient temperatures for up to two weeks, enabling global ambient temperature shipping and improving biological reproducibility across research sites.

This addresses a major bottleneck in preclinical drug development. These advanced organoids, which integrate non-parenchymal cells, are increasingly pivotal for complex disease modelling, particularly in fibrotic disease modeling, where recapitulating cellular crosstalk is essential.

The move towards dynamic cell culture within these organoids enhances their physiological relevance, making them a cornerstone for next-generation therapeutic evaluation.

Request Free Sample

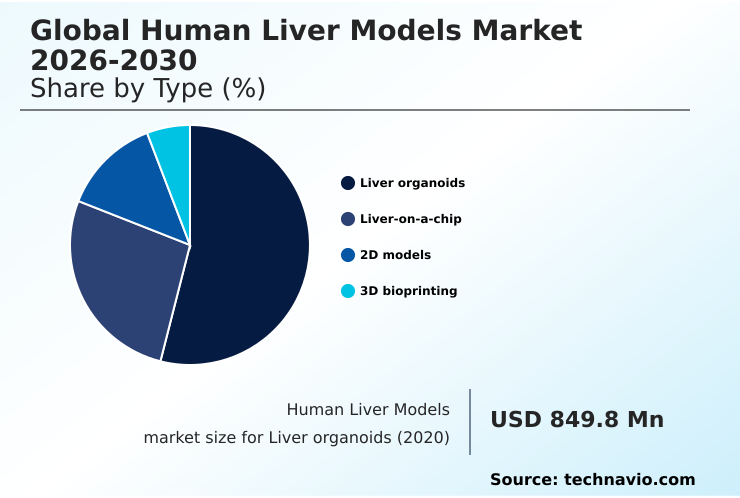
The Liver organoids segment was valued at USD 1.47 billion in 2024 and showed a gradual increase during the forecast period.

Request Free Sample

Regional Analysis

North America is estimated to contribute 40.3% to the growth of the global market during the forecast period.Technavio’s analysts have elaborately explained the regional trends and drivers that shape the market during the forecast period.

See How Human Liver Models Market Demand is Rising in North America Request Free Sample

North America is the primary engine of growth, contributing over 40% of the market's incremental expansion.

This dominance is cemented by a favorable regulatory climate in the United States, where the FDA's acceptance of new approach methodologies for preclinical drug development has de-risked adoption for pharmaceutical firms.

The qualification of organ-chip data for toxicology testing can reduce screening phases by up to 30%. Consequently, large contract research organizations have accelerated the integration of liver spheroid models and cryopreserved human hepatocytes for ADME studies.

This has led to a 40% increase in the adoption of advanced human liver models for regulatory validation.

The region's robust ecosystem, which combines technology innovators with a high concentration of pharmaceutical clients, ensures it remains at the forefront of both commercial adoption and technological innovation in predictive toxicology and the use of body-on-chip systems.
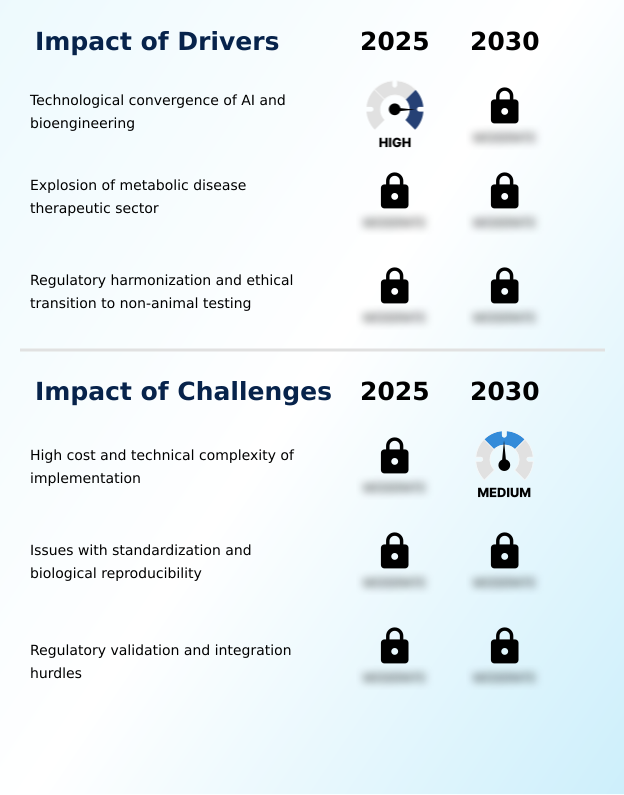
Market Dynamics

Our researchers analyzed the data with 2025 as the base year, along with the key drivers, trends, and challenges. A holistic analysis of drivers will help companies refine their marketing strategies to gain a competitive advantage.

  • The evolution of the global human liver models market 2026-2030 is increasingly defined by its application in highly specific and complex areas of drug development.
  • The use of predictive toxicology using liver models has matured beyond general screening to incorporate nuanced in vitro models for DILI prediction, enabling drug developers to identify hepatotoxic liabilities with greater precision early in the pipeline. This proactive failure analysis can save multiples on downstream clinical trial expenses compared to traditional workflows.
  • Concurrently, organ-on-chip for ADME studies are becoming standard for characterizing pharmacokinetic profiles, providing a dynamic and physiologically relevant alternative to static cultures. The sector is also seeing significant advances in biofabrication, with 3D bioprinted liver tissue constructs offering unparalleled architectural biomimicry.
  • These sophisticated platforms are proving essential for assessing lipid nanoparticle mediated delivery, a critical step for validating next-generation mRNA vaccines and gene therapies. Furthermore, specialized models are being developed for modeling metabolic dysfunction associated steatohepatitis (MASH), addressing a massive unmet need in metabolic disease research and accelerating the search for effective treatments.

What are the key market drivers leading to the rise in the adoption of Human Liver Models Industry?

  • The technological convergence of AI and bioengineering serves as a key market driver, transforming biological models into sources of digital insight for drug discovery.

  • The market is driven by the convergence of AI with bioengineering, which transforms human-relevant in vitro systems into powerful data generation engines for drug discovery.
  • Advances in 3D bioprinting and bioink formulation are central to this, enabling the automated fabrication of tissues for high-content screening.
  • This synergy is creating a feedback loop where AI-driven design improves tissue engineering, while the resulting organ-on-a-chip technology provides clean, human-specific data to train machine learning algorithms.
  • Innovations in perfusion systems are also lowering barriers to entry, with new platforms reducing experiment setup times by 30%.
  • This makes it easier for labs to adopt sophisticated multi-organ systems and move beyond the limitations of older models that struggled to maintain long-term cytochrome P450 metabolism.

What are the market trends shaping the Human Liver Models Industry?

  • A key market trend involves the optimization of models for advanced therapeutics and genetic medicines. This reflects a shift toward specialized platforms for novel drug modalities.

  • A significant trend is the adaptation of models for advanced therapeutic modalities. Platforms are being optimized for gene therapy validation and for assessing RNA interference drugs, where predicting the efficacy of lipid nanoparticle delivery is critical. Unlike traditional cell-based assays, new systems can replicate physiological flow, improving predictive accuracy for mRNA uptake by over 40% compared to static cultures.
  • This allows for more effective hepatotoxicity screening and characterization of large-molecule drugs. The development of 3D microtissues and scaffold-free tissue with complex hepatic tissue microarchitecture is enabling researchers to create more accurate representations of human liver biology, which is essential for testing these next-generation treatments.

What challenges does the Human Liver Models Industry face during its growth?

  • The high cost and technical complexity associated with implementation remain a key challenge, affecting the broader adoption of advanced systems.

  • High implementation costs and technical complexity are significant challenges, as the capital expenditure for a microphysiological system or liver-on-a-chip platform can be up to 10 times higher than for traditional 2D models. This barrier is particularly acute for smaller labs, which may lack the resources and multidisciplinary expertise for high-throughput screening.
  • Operating these systems often involves a steep learning curve, which can increase technician onboarding time by over 60%. While innovations are simplifying workflows for applications like drug-induced liver injury analysis, the field must continue to address issues of cost and usability to broaden adoption.
  • Ensuring long-term metabolic competency and achieving the goals of new approach methodologies for predictive toxicology remain difficult without more accessible and standardized platforms.

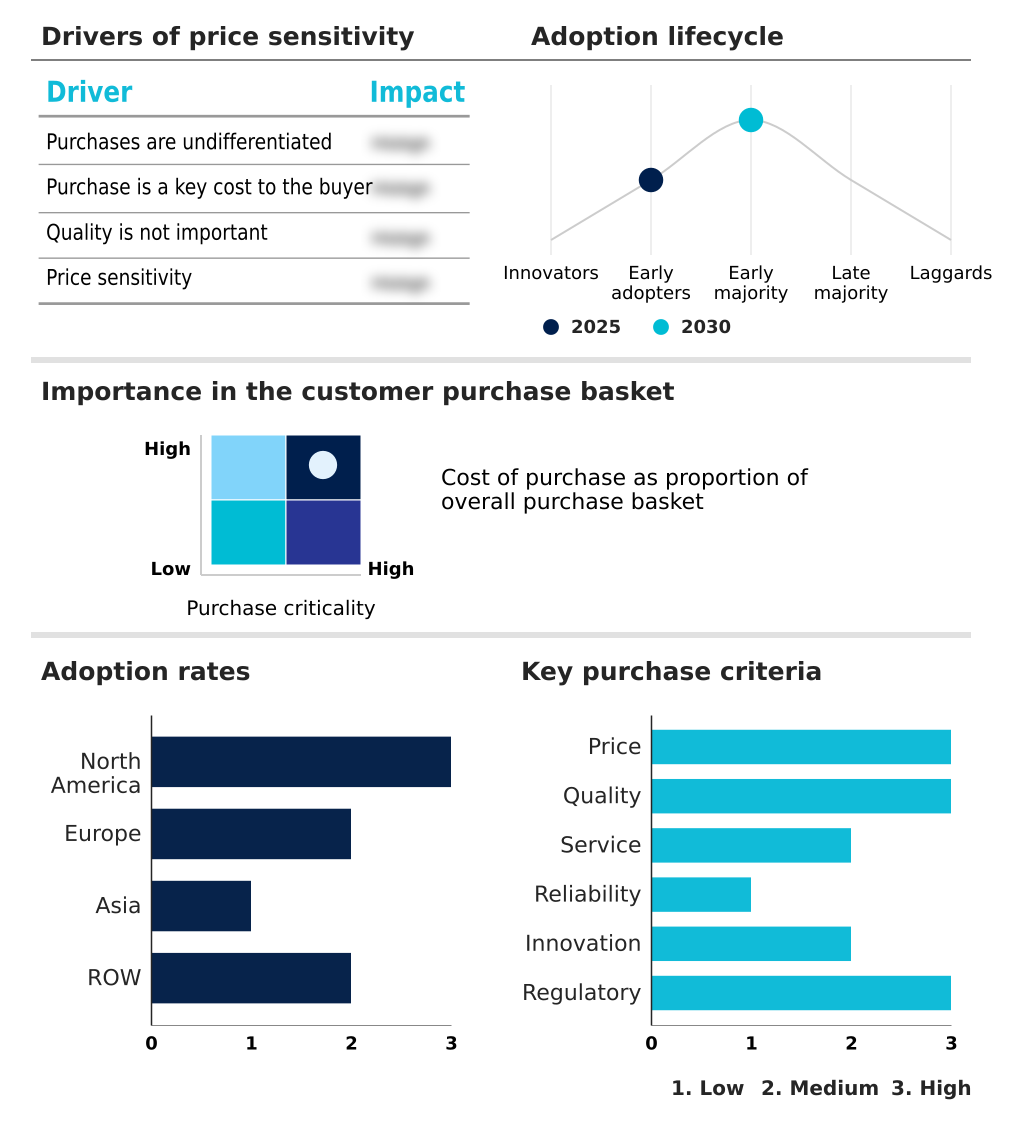
Exclusive Technavio Analysis on Customer Landscape

The human liver models market forecasting report includes the adoption lifecycle of the market, covering from the innovator’s stage to the laggard’s stage. It focuses on adoption rates in different regions based on penetration. Furthermore, the human liver models market report also includes key purchase criteria and drivers of price sensitivity to help companies evaluate and develop their market growth analysis strategies.

Customer Landscape of Human Liver Models Industry

Competitive Landscape

Companies are implementing various strategies, such as strategic alliances, human liver models market forecast, partnerships, mergers and acquisitions, geographical expansion, and product/service launches, to enhance their presence in the industry.

ATCC - Supplies credible biological products and advanced model systems, including HepG2 and primary hepatocyte cells, crucial for complex liver research and development applications.

The industry research and growth report includes detailed analyses of the competitive landscape of the market and information about key companies, including:

  • ATCC
  • BioIVT LLC
  • Biopredic Advancells Pvt. Ltd.
  • CELLINK AB
  • CN Bio Innovations Ltd.
  • Corning Inc.
  • Cyfuse Biomedical K.K.
  • Emulate Inc.
  • InSphero AG
  • Kirkstall Ltd.
  • Merck KGaA
  • MIMETAS BV
  • Organovo Holdings Inc.
  • Pandorum Technologies Pvt. Ltd.
  • PhoenixBio Co., Ltd.
  • Promega Corp.
  • STEMCELL Technologies Inc.
  • Thermo Fisher Scientific Inc.

Qualitative and quantitative analysis of companies has been conducted to help clients understand the wider business environment as well as the strengths and weaknesses of key industry players. Data is qualitatively analyzed to categorize companies as pure play, category-focused, industry-focused, and diversified; it is quantitatively analyzed to categorize companies as dominant, leading, strong, tentative, and weak.

Recent Development and News in Human liver models market

  • In September 2024, Emulate Inc. had its Liver-Chip accepted into the United States Food and Drug Administration's (FDA) Innovative Science and Technology Approaches for New Drugs (ISTAND) Pilot Program, marking a key step toward the qualification of organ-on-chip technology for regulatory submissions.
  • In February 2025, BICO Group launched a specialized high-resolution bioink kit designed to replicate the specific stiffness and microarchitecture of hepatic tissue, addressing a significant technical barrier in 3D bioprinting.
  • In April 2025, Organovo Holdings Inc. completed its strategic rebranding to VivoSim Labs, Inc., signaling a renewed focus on commercializing its 3D bioprinting platform for predictive toxicology in the US market.
  • In May 2025, Labcorp announced the expansion of its non-clinical safety portfolio to include a comprehensive suite of 3D human liver spheroid assays, standardizing these advanced models for industrial-scale safety testing.

Dive into Technavio’s robust research methodology, blending expert interviews, extensive data synthesis, and validated models for unparalleled Human Liver Models Market insights. See full methodology.

Market Scope
Page number 296
Base year 2025
Historic period 2020-2024
Forecast period 2026-2030
Growth momentum & CAGR Accelerate at a CAGR of 21.3%
Market growth 2026-2030 USD 5168.6 million
Market structure Fragmented
YoY growth 2025-2026(%) 18.9%
Key countries US, Canada, Mexico, Germany, UK, France, Italy, Spain, The Netherlands, China, Japan, India, South Korea, Singapore, Indonesia, Brazil, Saudi Arabia, South Africa, UAE, Argentina, Australia, Chile and Turkey
Competitive landscape Leading Companies, Market Positioning of Companies, Competitive Strategies, and Industry Risks

Request Free Sample

Research Analyst Overview

  • The human liver models market is built upon a spectrum of technologies, ranging from established 2d models and cell-based assays using primary human hepatocytes to advanced functional in vitro models. Innovations in liver organoids and liver-on-a-chip platforms, which utilize stem-cell-derived hepatocytes and non-parenchymal cells, are setting new standards.
  • The integration of perfusion systems and scaffold-free tissue techniques in these microphysiological system setups enhances metabolic competency, crucial for adme studies and disease modelling. Concurrently, 3d bioprinting, enabled by sophisticated bioink formulation, allows for precise reconstruction of hepatic tissue microarchitecture, creating superior 3d microtissues. These advancements are pivotal for high-content screening and hepatotoxicity screening.
  • For boardroom-level strategy, the decision to invest in these platforms for predictive toxicology is critical, as they can de-risk the development of novel therapeutics. For example, validating a new gene therapy using these models can deliver up to a 90% accuracy rate in predicting liver-related adverse events, directly influencing R&D budget allocation and pipeline prioritization.

What are the Key Data Covered in this Human Liver Models Market Research and Growth Report?

  • What is the expected growth of the Human Liver Models Market between 2026 and 2030?

    • USD 5.17 billion, at a CAGR of 21.3%

  • What segmentation does the market report cover?

    • The report is segmented by Type (Liver organoids, Liver-on-a-chip, 2D models, and 3D bioprinting), Application (ADME studies, Toxicology testing, Disease modelling, and Others), End-user (Pharmaceutical and biotechnology companies, Contract research organizations, and Academic and research institutes) and Geography (North America, Europe, Asia, Rest of World (ROW))

  • Which regions are analyzed in the report?

    • North America, Europe, Asia and Rest of World (ROW)

  • What are the key growth drivers and market challenges?

    • Technological convergence of AI and bioengineering, High cost and technical complexity of implementation

  • Who are the major players in the Human Liver Models Market?

    • ATCC, BioIVT LLC, Biopredic Advancells Pvt. Ltd., CELLINK AB, CN Bio Innovations Ltd., Corning Inc., Cyfuse Biomedical K.K., Emulate Inc., InSphero AG, Kirkstall Ltd., Merck KGaA, MIMETAS BV, Organovo Holdings Inc., Pandorum Technologies Pvt. Ltd., PhoenixBio Co., Ltd., Promega Corp., STEMCELL Technologies Inc. and Thermo Fisher Scientific Inc.

Market Research Insights

  • The market is shaped by a definitive shift toward human-relevant in vitro systems, as their adoption for preclinical drug development has been shown to improve prediction of drug-induced liver injury by over 30% compared to legacy methods. This transition is propelled by the formalization of new approach methodologies (NAMs) in regulatory frameworks, diminishing reliance on animal models.
  • Organ-on-chip technology now facilitates complex evaluations, such as first-pass metabolism simulation and pharmacokinetic profiling. Furthermore, the use of patient-derived organoids in high-throughput screening campaigns allows for testing against diverse genetic backgrounds, with some platforms demonstrating a twofold increase in the identification of responder versus non-responder populations for developmental drugs, directly impacting clinical trial design and cost.

We can help! Our analysts can customize this human liver models market research report to meet your requirements.

Get in touch

1. Executive Summary

1.1 Market overview

Executive Summary - Chart on Market Overview
Executive Summary - Data Table on Market Overview
Executive Summary - Chart on Global Market Characteristics
Executive Summary - Chart on Market by Geography
Executive Summary - Chart on Market Segmentation by Type
Executive Summary - Chart on Market Segmentation by Application
Executive Summary - Chart on Market Segmentation by End-user
Executive Summary - Chart on Incremental Growth
Executive Summary - Data Table on Incremental Growth
Executive Summary - Chart on Company Market Positioning

2. Technavio Analysis

2.1 Analysis of price sensitivity, lifecycle, customer purchase basket, adoption rates, and purchase criteria

2.2 Criticality of inputs and Factors of differentiation

Chart on Overview on criticality of inputs and factors of differentiation

2.3 Factors of disruption

Chart on Overview on factors of disruption

2.4 Impact of drivers and challenges

Chart on Impact of drivers and challenges in 2025 and 2030

3. Market Landscape

3.1 Market ecosystem

Chart on Parent Market
Data Table on - Parent Market

3.2 Market characteristics

Chart on Market characteristics analysis

3.3 Value chain analysis

Chart on Value chain analysis

4. Market Sizing

4.1 Market definition

Data Table on Offerings of companies included in the market definition

4.2 Market segment analysis

Market segments

4.3 Market size 2025

4.4 Market outlook: Forecast for 2025-2030

Chart on Global - Market size and forecast 2025-2030 ($ million)
Data Table on Global - Market size and forecast 2025-2030 ($ million)
Chart on Global Market: Year-over-year growth 2025-2030 (%)
Data Table on Global Market: Year-over-year growth 2025-2030 (%)

5. Historic Market Size

5.1 Global Human Liver Models Market 2020 - 2024

Historic Market Size - Data Table on Global Human Liver Models Market 2020 - 2024 ($ million)

5.2 Type segment analysis 2020 - 2024

Historic Market Size - Type Segment 2020 - 2024 ($ million)

5.3 Application segment analysis 2020 - 2024

Historic Market Size - Application Segment 2020 - 2024 ($ million)

5.4 End-user segment analysis 2020 - 2024

Historic Market Size - End-user Segment 2020 - 2024 ($ million)

5.5 Geography segment analysis 2020 - 2024

Historic Market Size - Geography Segment 2020 - 2024 ($ million)

5.6 Country segment analysis 2020 - 2024

Historic Market Size - Country Segment 2020 - 2024 ($ million)

6. Qualitative Analysis

6.1 Impact of AI in the Global Human Liver Models Market

7. Five Forces Analysis

7.1 Five forces summary

Five forces analysis - Comparison between 2025 and 2030

7.2 Bargaining power of buyers

Bargaining power of buyers - Impact of key factors 2025 and 2030

7.3 Bargaining power of suppliers

Bargaining power of suppliers - Impact of key factors in 2025 and 2030

7.4 Threat of new entrants

Threat of new entrants - Impact of key factors in 2025 and 2030

7.5 Threat of substitutes

Threat of substitutes - Impact of key factors in 2025 and 2030

7.6 Threat of rivalry

Threat of rivalry - Impact of key factors in 2025 and 2030

7.7 Market condition

Chart on Market condition - Five forces 2025 and 2030

8. Market Segmentation by Type

8.1 Market segments

Chart on Type - Market share 2025-2030 (%)
Data Table on Type - Market share 2025-2030 (%)

8.2 Comparison by Type

Chart on Comparison by Type
Data Table on Comparison by Type

8.3 Liver organoids - Market size and forecast 2025-2030

Chart on Liver organoids - Market size and forecast 2025-2030 ($ million)
Data Table on Liver organoids - Market size and forecast 2025-2030 ($ million)
Chart on Liver organoids - Year-over-year growth 2025-2030 (%)
Data Table on Liver organoids - Year-over-year growth 2025-2030 (%)

8.4 Liver-on-a-chip - Market size and forecast 2025-2030

Chart on Liver-on-a-chip - Market size and forecast 2025-2030 ($ million)
Data Table on Liver-on-a-chip - Market size and forecast 2025-2030 ($ million)
Chart on Liver-on-a-chip - Year-over-year growth 2025-2030 (%)
Data Table on Liver-on-a-chip - Year-over-year growth 2025-2030 (%)

8.5 2D models - Market size and forecast 2025-2030

Chart on 2D models - Market size and forecast 2025-2030 ($ million)
Data Table on 2D models - Market size and forecast 2025-2030 ($ million)
Chart on 2D models - Year-over-year growth 2025-2030 (%)
Data Table on 2D models - Year-over-year growth 2025-2030 (%)

8.6 3D bioprinting - Market size and forecast 2025-2030

Chart on 3D bioprinting - Market size and forecast 2025-2030 ($ million)
Data Table on 3D bioprinting - Market size and forecast 2025-2030 ($ million)
Chart on 3D bioprinting - Year-over-year growth 2025-2030 (%)
Data Table on 3D bioprinting - Year-over-year growth 2025-2030 (%)

8.7 Market opportunity by Type

Market opportunity by Type ($ million)
Data Table on Market opportunity by Type ($ million)

9. Market Segmentation by Application

9.1 Market segments

Chart on Application - Market share 2025-2030 (%)
Data Table on Application - Market share 2025-2030 (%)

9.2 Comparison by Application

Chart on Comparison by Application
Data Table on Comparison by Application

9.3 ADME studies - Market size and forecast 2025-2030

Chart on ADME studies - Market size and forecast 2025-2030 ($ million)
Data Table on ADME studies - Market size and forecast 2025-2030 ($ million)
Chart on ADME studies - Year-over-year growth 2025-2030 (%)
Data Table on ADME studies - Year-over-year growth 2025-2030 (%)

9.4 Toxicology testing - Market size and forecast 2025-2030

Chart on Toxicology testing - Market size and forecast 2025-2030 ($ million)
Data Table on Toxicology testing - Market size and forecast 2025-2030 ($ million)
Chart on Toxicology testing - Year-over-year growth 2025-2030 (%)
Data Table on Toxicology testing - Year-over-year growth 2025-2030 (%)

9.5 Disease modelling - Market size and forecast 2025-2030

Chart on Disease modelling - Market size and forecast 2025-2030 ($ million)
Data Table on Disease modelling - Market size and forecast 2025-2030 ($ million)
Chart on Disease modelling - Year-over-year growth 2025-2030 (%)
Data Table on Disease modelling - Year-over-year growth 2025-2030 (%)

9.6 Others - Market size and forecast 2025-2030

Chart on Others - Market size and forecast 2025-2030 ($ million)
Data Table on Others - Market size and forecast 2025-2030 ($ million)
Chart on Others - Year-over-year growth 2025-2030 (%)
Data Table on Others - Year-over-year growth 2025-2030 (%)

9.7 Market opportunity by Application

Market opportunity by Application ($ million)
Data Table on Market opportunity by Application ($ million)

10. Market Segmentation by End-user

10.1 Market segments

Chart on End-user - Market share 2025-2030 (%)
Data Table on End-user - Market share 2025-2030 (%)

10.2 Comparison by End-user

Chart on Comparison by End-user
Data Table on Comparison by End-user

10.3 Pharmaceutical and biotechnology companies - Market size and forecast 2025-2030

Chart on Pharmaceutical and biotechnology companies - Market size and forecast 2025-2030 ($ million)
Data Table on Pharmaceutical and biotechnology companies - Market size and forecast 2025-2030 ($ million)
Chart on Pharmaceutical and biotechnology companies - Year-over-year growth 2025-2030 (%)
Data Table on Pharmaceutical and biotechnology companies - Year-over-year growth 2025-2030 (%)

10.4 Contract research organizations - Market size and forecast 2025-2030

Chart on Contract research organizations - Market size and forecast 2025-2030 ($ million)
Data Table on Contract research organizations - Market size and forecast 2025-2030 ($ million)
Chart on Contract research organizations - Year-over-year growth 2025-2030 (%)
Data Table on Contract research organizations - Year-over-year growth 2025-2030 (%)

10.5 Academic and research institutes - Market size and forecast 2025-2030

Chart on Academic and research institutes - Market size and forecast 2025-2030 ($ million)
Data Table on Academic and research institutes - Market size and forecast 2025-2030 ($ million)
Chart on Academic and research institutes - Year-over-year growth 2025-2030 (%)
Data Table on Academic and research institutes - Year-over-year growth 2025-2030 (%)

10.6 Market opportunity by End-user

Market opportunity by End-user ($ million)
Data Table on Market opportunity by End-user ($ million)

11. Customer Landscape

11.1 Customer landscape overview

Analysis of price sensitivity, lifecycle, customer purchase basket, adoption rates, and purchase criteria

12. Geographic Landscape

12.1 Geographic segmentation

Chart on Market share by geography 2025-2030 (%)
Data Table on Market share by geography 2025-2030 (%)

12.2 Geographic comparison

Chart on Geographic comparison
Data Table on Geographic comparison

12.3 North America - Market size and forecast 2025-2030

Chart on North America - Market size and forecast 2025-2030 ($ million)
Data Table on North America - Market size and forecast 2025-2030 ($ million)
Chart on North America - Year-over-year growth 2025-2030 (%)
Data Table on North America - Year-over-year growth 2025-2030 (%)
Chart on Regional Comparison - North America
Data Table on Regional Comparison - North America

12.3.1 US - Market size and forecast 2025-2030

Chart on US - Market size and forecast 2025-2030 ($ million)
Data Table on US - Market size and forecast 2025-2030 ($ million)
Chart on US - Year-over-year growth 2025-2030 (%)
Data Table on US - Year-over-year growth 2025-2030 (%)

12.3.2 Canada - Market size and forecast 2025-2030

Chart on Canada - Market size and forecast 2025-2030 ($ million)
Data Table on Canada - Market size and forecast 2025-2030 ($ million)
Chart on Canada - Year-over-year growth 2025-2030 (%)
Data Table on Canada - Year-over-year growth 2025-2030 (%)

12.3.3 Mexico - Market size and forecast 2025-2030

Chart on Mexico - Market size and forecast 2025-2030 ($ million)
Data Table on Mexico - Market size and forecast 2025-2030 ($ million)
Chart on Mexico - Year-over-year growth 2025-2030 (%)
Data Table on Mexico - Year-over-year growth 2025-2030 (%)

12.4 Europe - Market size and forecast 2025-2030

Chart on Europe - Market size and forecast 2025-2030 ($ million)
Data Table on Europe - Market size and forecast 2025-2030 ($ million)
Chart on Europe - Year-over-year growth 2025-2030 (%)
Data Table on Europe - Year-over-year growth 2025-2030 (%)
Chart on Regional Comparison - Europe
Data Table on Regional Comparison - Europe

12.4.1 Germany - Market size and forecast 2025-2030

Chart on Germany - Market size and forecast 2025-2030 ($ million)
Data Table on Germany - Market size and forecast 2025-2030 ($ million)
Chart on Germany - Year-over-year growth 2025-2030 (%)
Data Table on Germany - Year-over-year growth 2025-2030 (%)

12.4.2 UK - Market size and forecast 2025-2030

Chart on UK - Market size and forecast 2025-2030 ($ million)
Data Table on UK - Market size and forecast 2025-2030 ($ million)
Chart on UK - Year-over-year growth 2025-2030 (%)
Data Table on UK - Year-over-year growth 2025-2030 (%)

12.4.3 France - Market size and forecast 2025-2030

Chart on France - Market size and forecast 2025-2030 ($ million)
Data Table on France - Market size and forecast 2025-2030 ($ million)
Chart on France - Year-over-year growth 2025-2030 (%)
Data Table on France - Year-over-year growth 2025-2030 (%)

12.4.4 Italy - Market size and forecast 2025-2030

Chart on Italy - Market size and forecast 2025-2030 ($ million)
Data Table on Italy - Market size and forecast 2025-2030 ($ million)
Chart on Italy - Year-over-year growth 2025-2030 (%)
Data Table on Italy - Year-over-year growth 2025-2030 (%)

12.4.5 Spain - Market size and forecast 2025-2030

Chart on Spain - Market size and forecast 2025-2030 ($ million)
Data Table on Spain - Market size and forecast 2025-2030 ($ million)
Chart on Spain - Year-over-year growth 2025-2030 (%)
Data Table on Spain - Year-over-year growth 2025-2030 (%)

12.4.6 The Netherlands - Market size and forecast 2025-2030

Chart on The Netherlands - Market size and forecast 2025-2030 ($ million)
Data Table on The Netherlands - Market size and forecast 2025-2030 ($ million)
Chart on The Netherlands - Year-over-year growth 2025-2030 (%)
Data Table on The Netherlands - Year-over-year growth 2025-2030 (%)

12.5 Asia - Market size and forecast 2025-2030

Chart on Asia - Market size and forecast 2025-2030 ($ million)
Data Table on Asia - Market size and forecast 2025-2030 ($ million)
Chart on Asia - Year-over-year growth 2025-2030 (%)
Data Table on Asia - Year-over-year growth 2025-2030 (%)
Chart on Regional Comparison - Asia
Data Table on Regional Comparison - Asia

12.5.1 China - Market size and forecast 2025-2030

Chart on China - Market size and forecast 2025-2030 ($ million)
Data Table on China - Market size and forecast 2025-2030 ($ million)
Chart on China - Year-over-year growth 2025-2030 (%)
Data Table on China - Year-over-year growth 2025-2030 (%)

12.5.2 Japan - Market size and forecast 2025-2030

Chart on Japan - Market size and forecast 2025-2030 ($ million)
Data Table on Japan - Market size and forecast 2025-2030 ($ million)
Chart on Japan - Year-over-year growth 2025-2030 (%)
Data Table on Japan - Year-over-year growth 2025-2030 (%)

12.5.3 India - Market size and forecast 2025-2030

Chart on India - Market size and forecast 2025-2030 ($ million)
Data Table on India - Market size and forecast 2025-2030 ($ million)
Chart on India - Year-over-year growth 2025-2030 (%)
Data Table on India - Year-over-year growth 2025-2030 (%)

12.5.4 South Korea - Market size and forecast 2025-2030

Chart on South Korea - Market size and forecast 2025-2030 ($ million)
Data Table on South Korea - Market size and forecast 2025-2030 ($ million)
Chart on South Korea - Year-over-year growth 2025-2030 (%)
Data Table on South Korea - Year-over-year growth 2025-2030 (%)

12.5.5 Singapore - Market size and forecast 2025-2030

Chart on Singapore - Market size and forecast 2025-2030 ($ million)
Data Table on Singapore - Market size and forecast 2025-2030 ($ million)
Chart on Singapore - Year-over-year growth 2025-2030 (%)
Data Table on Singapore - Year-over-year growth 2025-2030 (%)

12.5.6 Indonesia - Market size and forecast 2025-2030

Chart on Indonesia - Market size and forecast 2025-2030 ($ million)
Data Table on Indonesia - Market size and forecast 2025-2030 ($ million)
Chart on Indonesia - Year-over-year growth 2025-2030 (%)
Data Table on Indonesia - Year-over-year growth 2025-2030 (%)

12.6 Rest of World (ROW) - Market size and forecast 2025-2030

Chart on Rest of World (ROW) - Market size and forecast 2025-2030 ($ million)
Data Table on Rest of World (ROW) - Market size and forecast 2025-2030 ($ million)
Chart on Rest of World (ROW) - Year-over-year growth 2025-2030 (%)
Data Table on Rest of World (ROW) - Year-over-year growth 2025-2030 (%)
Chart on Regional Comparison - Rest of World (ROW)
Data Table on Regional Comparison - Rest of World (ROW)

12.6.1 Brazil - Market size and forecast 2025-2030

Chart on Brazil - Market size and forecast 2025-2030 ($ million)
Data Table on Brazil - Market size and forecast 2025-2030 ($ million)
Chart on Brazil - Year-over-year growth 2025-2030 (%)
Data Table on Brazil - Year-over-year growth 2025-2030 (%)

12.6.2 Saudi Arabia - Market size and forecast 2025-2030

Chart on Saudi Arabia - Market size and forecast 2025-2030 ($ million)
Data Table on Saudi Arabia - Market size and forecast 2025-2030 ($ million)
Chart on Saudi Arabia - Year-over-year growth 2025-2030 (%)
Data Table on Saudi Arabia - Year-over-year growth 2025-2030 (%)

12.6.3 South Africa - Market size and forecast 2025-2030

Chart on South Africa - Market size and forecast 2025-2030 ($ million)
Data Table on South Africa - Market size and forecast 2025-2030 ($ million)
Chart on South Africa - Year-over-year growth 2025-2030 (%)
Data Table on South Africa - Year-over-year growth 2025-2030 (%)

12.6.4 UAE - Market size and forecast 2025-2030

Chart on UAE - Market size and forecast 2025-2030 ($ million)
Data Table on UAE - Market size and forecast 2025-2030 ($ million)
Chart on UAE - Year-over-year growth 2025-2030 (%)
Data Table on UAE - Year-over-year growth 2025-2030 (%)

12.6.5 Argentina - Market size and forecast 2025-2030

Chart on Argentina - Market size and forecast 2025-2030 ($ million)
Data Table on Argentina - Market size and forecast 2025-2030 ($ million)
Chart on Argentina - Year-over-year growth 2025-2030 (%)
Data Table on Argentina - Year-over-year growth 2025-2030 (%)

12.6.6 Australia - Market size and forecast 2025-2030

Chart on Australia - Market size and forecast 2025-2030 ($ million)
Data Table on Australia - Market size and forecast 2025-2030 ($ million)
Chart on Australia - Year-over-year growth 2025-2030 (%)
Data Table on Australia - Year-over-year growth 2025-2030 (%)

12.6.7 Chile - Market size and forecast 2025-2030

Chart on Chile - Market size and forecast 2025-2030 ($ million)
Data Table on Chile - Market size and forecast 2025-2030 ($ million)
Chart on Chile - Year-over-year growth 2025-2030 (%)
Data Table on Chile - Year-over-year growth 2025-2030 (%)

12.6.8 Turkey - Market size and forecast 2025-2030

Chart on Turkey - Market size and forecast 2025-2030 ($ million)
Data Table on Turkey - Market size and forecast 2025-2030 ($ million)
Chart on Turkey - Year-over-year growth 2025-2030 (%)
Data Table on Turkey - Year-over-year growth 2025-2030 (%)

12.7 Market opportunity by geography

Market opportunity by geography ($ million)
Data Tables on Market opportunity by geography ($ million)

13. Drivers, Challenges, and Opportunity

13.1 Market drivers

Technological convergence of AI and bioengineering
Explosion of metabolic disease therapeutic sector
Regulatory harmonization and ethical transition to non-animal testing

13.2 Market challenges

High cost and technical complexity of implementation
Issues with standardization and biological reproducibility
Regulatory validation and integration hurdles

13.3 Impact of drivers and challenges

Impact of drivers and challenges in 2025 and 2030

13.4 Market opportunities

Optimization for advanced therapeutics and genetic medicines
Integration of non-invasive real-time biosensing
Emergence of population-specific and genetically diverse models

14. Competitive Landscape

14.1 Overview

14.2

Overview on criticality of inputs and factors of differentiation

14.3 Landscape disruption

Overview on factors of disruption

14.4 Industry risks

Impact of key risks on business

15. Competitive Analysis

15.1 Companies profiled

Companies covered

15.2 Company ranking index

15.3 Market positioning of companies

Matrix on companies position and classification

15.4 ATCC

ATCC - Overview
ATCC - Product / Service
ATCC - Key offerings
SWOT

15.5 BioIVT LLC

BioIVT LLC - Overview
BioIVT LLC - Product / Service
BioIVT LLC - Key offerings
SWOT

15.6 Biopredic Advancells Pvt. Ltd.

Biopredic Advancells Pvt. Ltd. - Overview
Biopredic Advancells Pvt. Ltd. - Product / Service
Biopredic Advancells Pvt. Ltd. - Key offerings
SWOT

15.7 CELLINK AB

CELLINK AB - Overview
CELLINK AB - Business segments
CELLINK AB - Key offerings
CELLINK AB - Segment focus
SWOT

15.8 CN Bio Innovations Ltd.

CN Bio Innovations Ltd. - Overview
CN Bio Innovations Ltd. - Product / Service
CN Bio Innovations Ltd. - Key offerings
SWOT

15.9 Corning Inc.

Corning Inc. - Overview
Corning Inc. - Business segments
Corning Inc. - Key offerings
Corning Inc. - Segment focus
SWOT

15.10 Cyfuse Biomedical K.K.

Cyfuse Biomedical K.K. - Overview
Cyfuse Biomedical K.K. - Product / Service
Cyfuse Biomedical K.K. - Key offerings
SWOT

15.11 Emulate Inc.

Emulate Inc. - Overview
Emulate Inc. - Product / Service
Emulate Inc. - Key offerings
SWOT

15.12 InSphero AG

InSphero AG - Overview
InSphero AG - Product / Service
InSphero AG - Key offerings
SWOT

15.13 Kirkstall Ltd.

Kirkstall Ltd. - Overview
Kirkstall Ltd. - Product / Service
Kirkstall Ltd. - Key offerings
SWOT

15.14 Merck KGaA

Merck KGaA - Overview
Merck KGaA - Business segments
Merck KGaA - Key news
Merck KGaA - Key offerings
Merck KGaA - Segment focus
SWOT

15.15 MIMETAS BV

MIMETAS BV - Overview
MIMETAS BV - Product / Service
MIMETAS BV - Key offerings
SWOT

15.16 Organovo Holdings Inc.

Organovo Holdings Inc. - Overview
Organovo Holdings Inc. - Business segments
Organovo Holdings Inc. - Key offerings
Organovo Holdings Inc. - Segment focus
SWOT

15.17 PhoenixBio Co., Ltd.

PhoenixBio Co., Ltd. - Overview
PhoenixBio Co., Ltd. - Product / Service
PhoenixBio Co., Ltd. - Key offerings
SWOT

15.18 Thermo Fisher Scientific Inc.

Thermo Fisher Scientific Inc. - Overview
Thermo Fisher Scientific Inc. - Business segments
Thermo Fisher Scientific Inc. - Key news
Thermo Fisher Scientific Inc. - Key offerings
Thermo Fisher Scientific Inc. - Segment focus
SWOT

16. Appendix

16.1 Scope of the report

Market definition
Objectives
Notes and caveats

16.2 Inclusions and exclusions checklist

Inclusions checklist
Exclusions checklist

16.3 Currency conversion rates for US$

16.4 Research methodology

16.5 Data procurement

Information sources

16.6 Data validation

16.7 Validation techniques employed for market sizing

16.8 Data synthesis

16.9 360 degree market analysis

16.10 List of abbreviations

Research Methodology

Technavio presents a detailed picture of the market by way of study, synthesis, and summation of data from multiple sources. The analysts have presented the various facets of the market with a particular focus on identifying the key industry influencers. The data thus presented is comprehensive, reliable, and the result of extensive research, both primary and secondary.

INFORMATION SOURCES

Primary sources

  • Manufacturers and suppliers
  • Channel partners
  • Industry experts
  • Strategic decision makers

Secondary sources

  • Industry journals and periodicals
  • Government data
  • Financial reports of key industry players
  • Historical data
  • Press releases

DATA ANALYSIS

Data Synthesis

  • Collation of data
  • Estimation of key figures
  • Analysis of derived insights

Data Validation

  • Triangulation with data models
  • Reference against proprietary databases
  • Corroboration with industry experts

REPORT WRITING

Qualitative

  • Market drivers
  • Market challenges
  • Market trends
  • Five forces analysis

Quantitative

  • Market size and forecast
  • Market segmentation
  • Geographical insights
  • Competitive landscape

Interested in this report?

Get your sample now to see our research methodology and insights!

Download Now

Frequently Asked Questions

Human Liver Models market growth will increase by USD 5168.6 million during 2026-2030.

The Human Liver Models market is expected to grow at a CAGR of 21.3% during 2026-2030.

Human Liver Models market is segmented by Type (Liver organoids, Liver-on-a-chip, 2D models, 3D bioprinting) Application (ADME studies, Toxicology testing, Disease modelling, Others) End-user (Pharmaceutical and biotechnology companies, Contract research organizations, Academic and research institutes)

ATCC, BioIVT LLC, Biopredic Advancells Pvt. Ltd., CELLINK AB, CN Bio Innovations Ltd., Corning Inc., Cyfuse Biomedical K.K., Emulate Inc., InSphero AG, Kirkstall Ltd., Merck KGaA, MIMETAS BV, Organovo Holdings Inc., Pandorum Technologies Pvt. Ltd., PhoenixBio Co., Ltd., Promega Corp., STEMCELL Technologies Inc., Thermo Fisher Scientific Inc. are a few of the key vendors in the Human Liver Models market.

North America will register the highest growth rate of 40.3% among the other regions. Therefore, the Human Liver Models market in North America is expected to garner significant business opportunities for the vendors during the forecast period.

US, Canada, Mexico, Germany, UK, France, Italy, Spain, The Netherlands, China, Japan, India, South Korea, Singapore, Indonesia, Brazil, Saudi Arabia, South Africa, UAE, Argentina, Australia, Chile, Turkey

  • Technological convergence of AI and bioengineering is the driving factor this market.

The Human Liver Models market vendors should focus on grabbing business opportunities from the Type segment as it accounted for the largest market share in the base year.