Hypochlorite Bleaches Market Analysis, Size, and Forecast 2026-2030: APAC (China, India, and Japan), North America (US, Canada, and Mexico), Europe (Germany, France, and UK), Middle East and Africa (Saudi Arabia, UAE, and Turkey), South America (Brazil, Argentina, and Colombia), and Rest of World (ROW)

Hypochlorite Bleaches Market Analysis, Size, and Forecast 2026-2030:
APAC (China, India, and Japan), North America (US, Canada, and Mexico), Europe (Germany, France, and UK), Middle East and Africa (Saudi Arabia, UAE, and Turkey), South America (Brazil, Argentina, and Colombia), and Rest of World (ROW)

Published: Dec 2025 304 Pages SKU: IRTNTR72483

Market Overview at a Glance

$805.2 Mn
Market Opportunity
10.7%
CAGR 2025 - 2030
41.3%
APAC Growth
$718.8 Mn
Sodium hypochlorite segment 2024

Hypochlorite Bleaches Market Size 2026-2030

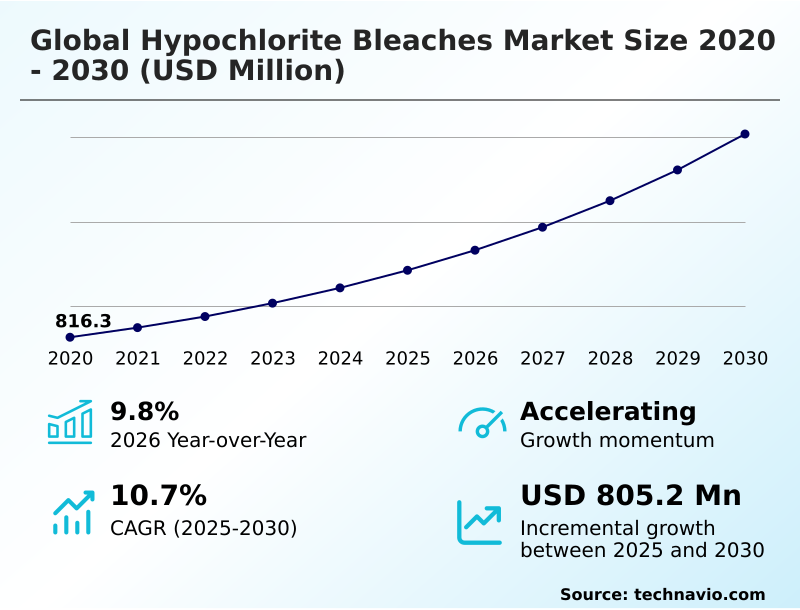
The hypochlorite bleaches market size is valued to increase by USD 805.2 million, at a CAGR of 10.7% from 2025 to 2030. Heightened focus on public health and hygiene will drive the hypochlorite bleaches market.

Major Market Trends & Insights

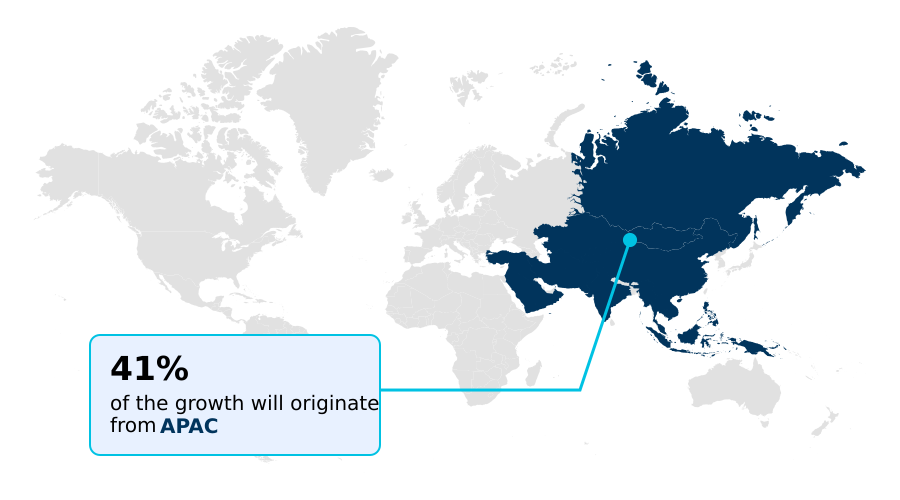
  • APAC dominated the market and accounted for a 41.3% growth during the forecast period.
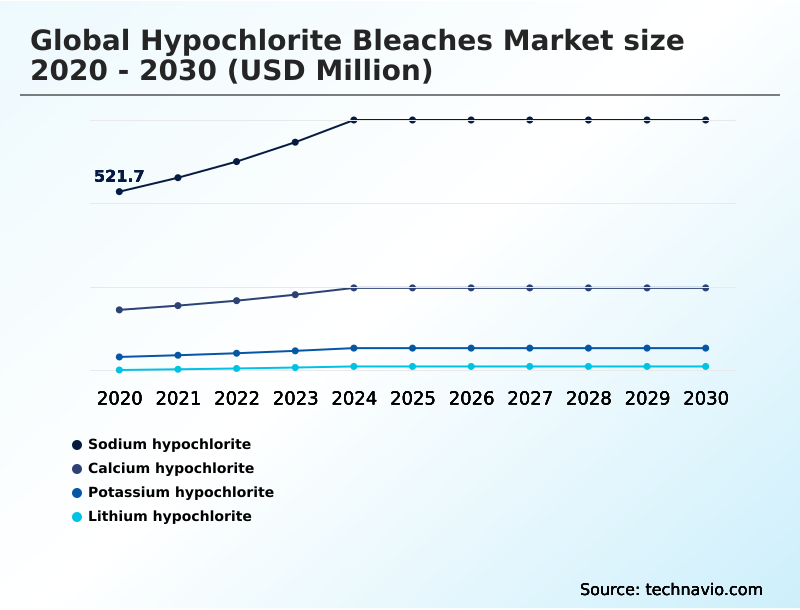
  • By Product - Sodium hypochlorite segment was valued at USD 718.8 million in 2024
  • By Application - Disinfectant segment accounted for the largest market revenue share in 2024

Market Size & Forecast

  • Market Opportunities: USD 1.20 billion
  • Market Future Opportunities: USD 805.2 million
  • CAGR from 2025 to 2030 : 10.7%

Market Summary

  • The hypochlorite bleaches market is characterized by steady demand rooted in global public health and industrial needs. Growth is fundamentally driven by the heightened focus on hygiene and the expanding requirements for water and wastewater treatment. As urbanization accelerates, the need for effective disinfectants in municipal systems becomes paramount.
  • For instance, a city upgrading its water infrastructure must select a reliable disinfectant for wastewater effluent treatment that complies with stringent environmental standards while remaining cost-effective. This scenario highlights the central role of hypochlorite. Key trends include an enduring focus on sanitation practices and growth in the pulp and paper industry. However, the market is not without challenges.
  • Increasing regulatory scrutiny on chemical byproducts and persistent supply chain volatility related to chlor-alkali production can disrupt operations and impact pricing. Furthermore, a growing consumer preference for eco-conscious alternatives is compelling manufacturers to innovate toward more sustainable formulations and processes.

What will be the Size of the Hypochlorite Bleaches Market during the forecast period?

Get Key Insights on Market Forecast (PDF) Request Free Sample

How is the Hypochlorite Bleaches Market Segmented?

The hypochlorite bleaches industry research report provides comprehensive data (region-wise segment analysis), with forecasts and estimates in "USD million" for the period 2026-2030, as well as historical data from 2020-2024 for the following segments.

  • Product
    • Sodium hypochlorite
    • Calcium hypochlorite
    • Potassium hypochlorite
    • Lithium hypochlorite
  • Application
    • Disinfectant
    • Water treatment
    • Paper and pulp
    • Textiles
    • Others
  • Type
    • Liquid
    • Solid
  • Geography
    • APAC
      • China
      • India
      • Japan
    • North America
      • US
      • Canada
      • Mexico
    • Europe
      • Germany
      • France
      • UK
    • Middle East and Africa
      • Saudi Arabia
      • UAE
      • Turkey
    • South America
      • Brazil
      • Argentina
      • Colombia
    • Rest of World (ROW)

By Product Insights

The sodium hypochlorite segment is estimated to witness significant growth during the forecast period.

The sodium hypochlorite solution segment represents the largest portion of the market, underpinned by its cost-effectiveness and broad utility.

Derived from the chlor-alkali process, its primary applications are in municipal water treatment to eliminate waterborne pathogens and as a key ingredient in household disinfectant products.

Its role in industrial settings is equally vital, including pulp and paper bleaching, food processing sanitation, and the textile bleaching process. Growing trends include on-site sodium hypochlorite generation, which mitigates risks associated with the safe handling of bleach.

Advanced chemical dosing systems are optimizing the bleach concentration for disinfection, improving bleach effectiveness against viruses and reducing waste by up to 15%.

This continuous innovation ensures its dominance in applications ranging from hygienic surface cleaning to bleach for mold removal.

Request Free Sample

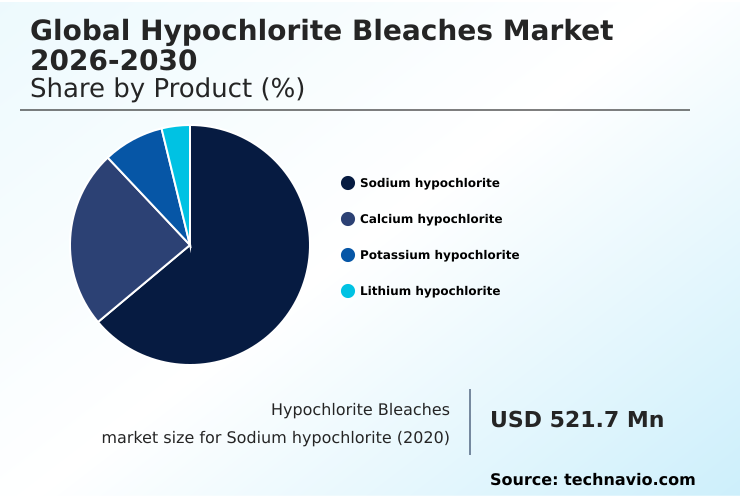
The Sodium hypochlorite segment was valued at USD 718.8 million in 2024 and showed a gradual increase during the forecast period.

Request Free Sample

Regional Analysis

APAC is estimated to contribute 41.3% to the growth of the global market during the forecast period.Technavio’s analysts have elaborately explained the regional trends and drivers that shape the market during the forecast period.

See How Hypochlorite Bleaches Market Demand is Rising in APAC Request Free Sample

The market's geographic landscape is diverse, with APAC poised to contribute over 41% of incremental growth, driven by industrialization and public health initiatives.

In this region, demand for calcium hypochlorite granules and stable bleaching powder for water purification is high due to their superior bleach stability and storage properties compared to liquid bleach.

The discussion of sodium vs calcium hypochlorite is crucial here, as solid forms are often preferred for their ease of transport. North America remains a mature market, focusing on applications like biofouling control and industrial cleaning solutions.

Europe is driven by stringent regulations, pushing for innovations in bleach for surface cleaning.

In all regions, the fundamental oxidizing agent properties of these chemicals are valued for pathogen elimination, from municipal water to residential pool shock treatment and the textile industry.

Market Dynamics

Our researchers analyzed the data with 2025 as the base year, along with the key drivers, trends, and challenges. A holistic analysis of drivers will help companies refine their marketing strategies to gain a competitive advantage.

  • Strategic decision-making in the market requires a deep understanding of specific use cases and economic trade-offs. The cost-effectiveness of sodium hypochlorite in water treatment remains a primary adoption driver for municipalities. In the recreational sector, using calcium hypochlorite for swimming pool sanitation is standard practice due to its convenient form.
  • However, firms must navigate complex environmental regulations for hypochlorite bleach discharge, which are becoming a major compliance concern. In industrial contexts, the role of hypochlorite in pulp and paper bleaching is being re-evaluated against greener alternatives. The consistent demand for hypochlorite bleach for healthcare facility disinfection is a stable market pillar.
  • Many are exploring methods for on-site generation of sodium hypochlorite to mitigate challenges in hypochlorite bleach supply chain logistics. This involves comparing hydrogen peroxide and hypochlorite as disinfectants for specific applications. Advancements in stabilized hypochlorite formulations are crucial for expanding into new areas. The hypochlorite bleach application in food and beverage sanitation is non-negotiable for safety.
  • Key operational concerns include the impact of raw material costs on bleach production and optimizing bleach dosage for wastewater treatment. Stakeholders are closely watching sustainability trends in the hypochlorite market and the rise of hypochlorite alternatives for textile bleaching.
  • Managing disinfection byproducts in water systems is a technical challenge, while point-of-use disinfection with calcium hypochlorite tablets offers a solution for remote areas. Other considerations include bleach stability in high-temperature environments, reducing chlorine odor in cleaning products, and optimizing hypochlorite use in industrial cooling towers. Overall, addressing the compliance burdens for hypochlorite manufacturers is essential for future growth.
  • Supply chains adopting on-site generation report up to 20% fewer disruptions compared to those reliant on long-haul transport.

What are the key market drivers leading to the rise in the adoption of Hypochlorite Bleaches Industry?

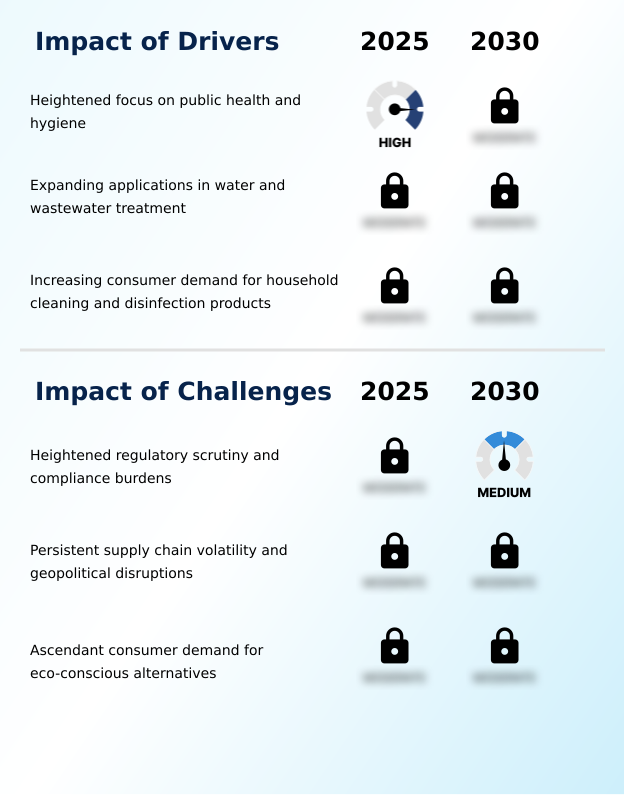
  • A sustained and heightened focus on public health and hygiene, entrenched in both consumer and institutional behaviors, serves as a primary market driver.

  • Expanding applications in water treatment are a critical driver. Significant investments in municipal water disinfection infrastructure and stricter regulatory standards for bleach used in wastewater effluent treatment are creating stable, long-term demand.
  • Upgrades to a chlor-alkali facility infrastructure have improved the hypochlorite production process efficiency by over 10%. However, challenges like supply chain volatility impact raw material sourcing and chemical transport, affecting the chlor-alkali production cycle.
  • Despite this, demand remains strong across industrial cleaning solutions and food processing sanitation, where bleach in food industry applications is non-negotiable for hygiene.
  • The need for disinfection in healthcare also provides a resilient demand floor, with some facilities optimizing usage to cut waste by 15%, ensuring that the market continues its upward trajectory.

What are the market trends shaping the Hypochlorite Bleaches Industry?

  • An enduring and heightened global focus on sanitization and disinfection practices has fundamentally altered behaviors, creating sustained demand for effective disinfecting agents.

  • The heightened focus on public health and hygiene is solidifying demand for hypochlorite-based disinfectants. Consumers are more educated, driving sales of household disinfectant products that offer proven protection. This trend extends to industrial sanitation protocols, where the broad-spectrum antimicrobial properties of a standard sodium hypochlorite solution are essential.
  • Innovations are also shaping the market; for instance, the adoption of electrochlorination systems for on-site hypochlorite generation is growing, reducing reliance on transported water purification chemicals by 20%. Such systems enhance the safety and efficiency of water disinfection chemistry.
  • Furthermore, the need for emergency water disinfection and effective point-of-use water treatment solutions to combat waterborne pathogens has led to the development of improved liquid bleach formulation products, with some showing a 15% increase in stability.

What challenges does the Hypochlorite Bleaches Industry face during its growth?

  • Increasingly stringent environmental and safety regulations, which intensify oversight and compliance burdens, present a significant challenge to market growth.

  • The market faces significant challenges from the growing demand for green cleaning products and eco-conscious alternatives. Concerns over the environmental impact of bleach, particularly the formation of disinfection byproducts and chlorinated organic compounds, are fueling a shift toward alternatives to chlorine bleach like plant-based disinfectants.
  • This trend affects high-volume applications such as the textile bleaching process and use as a pulp bleaching agent. Furthermore, the niche markets for potassium hypochlorite and lithium hypochlorite are pressured by the high cost of raw material sourcing. The move toward sustainable packaging adds another layer of complexity, requiring investments that can increase operational costs by up to 5%.
  • Persistent issues with chemical transport logistics also challenge market stability, even with a 10% increase in regional production.

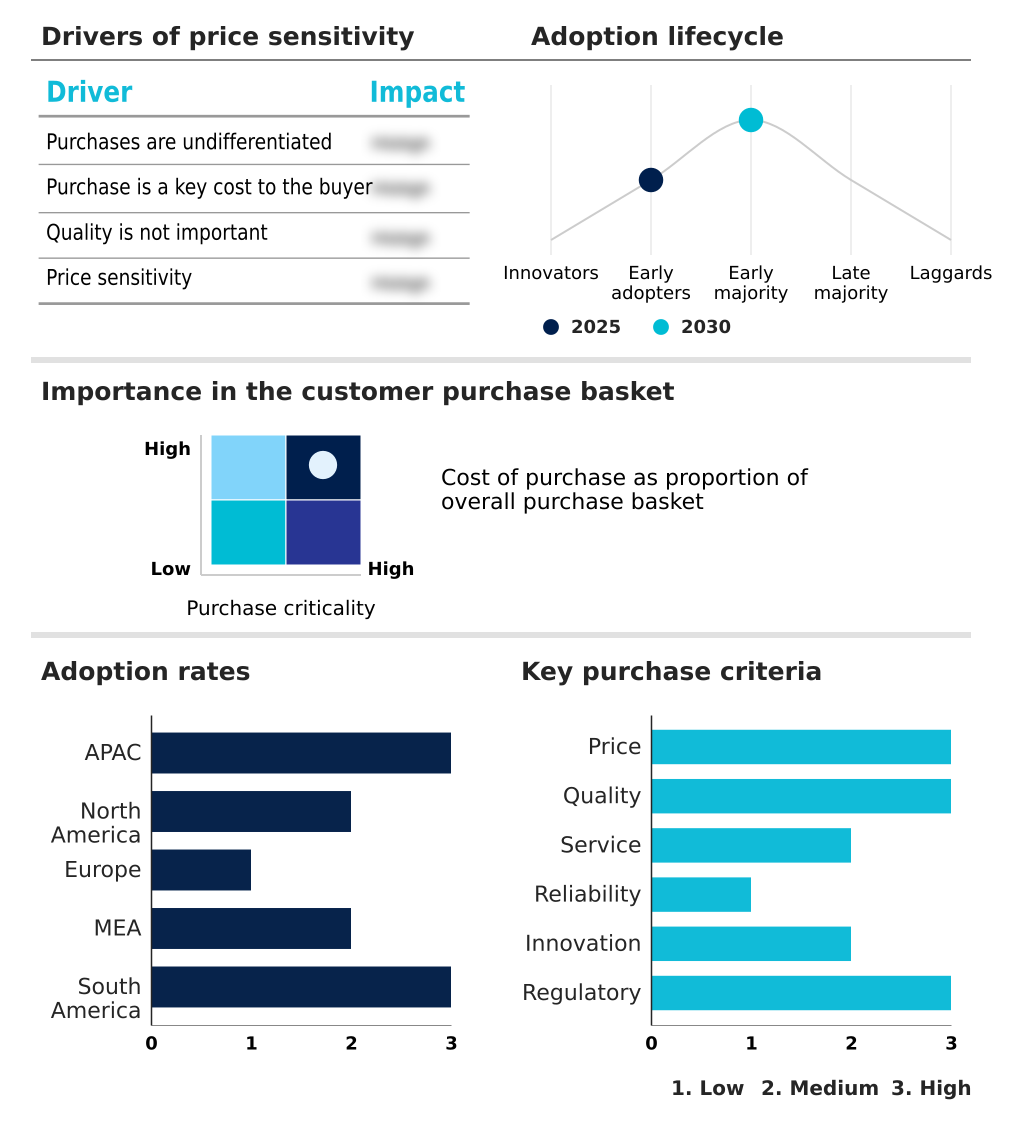
Exclusive Technavio Analysis on Customer Landscape

The hypochlorite bleaches market forecasting report includes the adoption lifecycle of the market, covering from the innovator’s stage to the laggard’s stage. It focuses on adoption rates in different regions based on penetration. Furthermore, the hypochlorite bleaches market report also includes key purchase criteria and drivers of price sensitivity to help companies evaluate and develop their market growth analysis strategies.

Customer Landscape of Hypochlorite Bleaches Industry

Competitive Landscape

Companies are implementing various strategies, such as strategic alliances, hypochlorite bleaches market forecast, partnerships, mergers and acquisitions, geographical expansion, and product/service launches, to enhance their presence in the industry.

Aditya Birla Mgmt. Pvt. Ltd. - Specializes in high-purity calcium hypochlorite formulations engineered for critical water treatment and large-scale sanitation applications, ensuring public health and safety.

The industry research and growth report includes detailed analyses of the competitive landscape of the market and information about key companies, including:

  • Aditya Birla Mgmt. Pvt. Ltd.
  • AGC Inc.
  • American Elements Inc.
  • Arkema Group
  • Hawkins Inc.
  • INEOS Group Holdings S.A.
  • Merck KGaA
  • Nouryon Chemicals Holding
  • Odyssey Manufacturing Co.
  • Olin Corp.
  • PCC SE
  • Shijiazhuang Xinlongwei Chemical Co. Ltd.
  • Somavrac Group
  • Tianjin YuFeng Chemical Co. Ltd.
  • Tosoh Corp.
  • Vynova Beek BV

Qualitative and quantitative analysis of companies has been conducted to help clients understand the wider business environment as well as the strengths and weaknesses of key industry players. Data is qualitatively analyzed to categorize companies as pure play, category-focused, industry-focused, and diversified; it is quantitatively analyzed to categorize companies as dominant, leading, strong, tentative, and weak.

Recent Development and News in Hypochlorite bleaches market

  • In August, 2024, Clorox announced the launch of a new line of eco-conscious surface disinfectant wipes specifically designed for healthcare environments, responding to demand for both potent disinfection and sustainability.
  • In December, 2024, The US Environmental Protection Agency (EPA) finalized amendments to its new chemical regulations under the Toxic Substances Control Act (TSCA), signaling a more rigorous review process for all chemical substances.
  • In January, 2025, Reckitt Benckiser Group expanded its disinfectant spray portfolio in North America with formulations demonstrating improved efficacy against a wider range of household pathogens to drive repeat purchases.
  • In March, 2025, Evoqua Water Technologies introduced an advanced electrochlorination system that generates sodium hypochlorite on-site from seawater, addressing logistical and safety challenges of chemical transport.

Dive into Technavio’s robust research methodology, blending expert interviews, extensive data synthesis, and validated models for unparalleled Hypochlorite Bleaches Market insights. See full methodology.

Market Scope
Page number 304
Base year 2025
Historic period 2020-2024
Forecast period 2026-2030
Growth momentum & CAGR Accelerate at a CAGR of 10.7%
Market growth 2026-2030 USD 805.2 million
Market structure Fragmented
YoY growth 2025-2026(%) 9.8%
Key countries China, India, Japan, Australia, South Korea, Indonesia, US, Canada, Mexico, Germany, France, UK, Italy, Spain, The Netherlands, Saudi Arabia, UAE, Turkey, South Africa, Egypt, Brazil, Argentina and Colombia
Competitive landscape Leading Companies, Market Positioning of Companies, Competitive Strategies, and Industry Risks

Request Free Sample

Research Analyst Overview

  • The market's foundation is built upon the chlor-alkali process, which underpins chlor-alkali production for essential chemicals. The primary output, a sodium hypochlorite solution, is a cornerstone of municipal water disinfection and wastewater effluent treatment. Its broad-spectrum antimicrobial efficacy ensures pathogen elimination, making it vital for sanitation protocols and hygienic surface cleaning.
  • The demand for industrial cleaning solutions and food processing sanitation remains robust. In parallel, calcium hypochlorite granules, often sold as stable bleaching powder, are preferred for pool shock treatment and point-of-use water treatment due to higher chlorine content and better bleach stability. The choice between them often depends on the specific water disinfection chemistry required.
  • Innovations like on-site generation and advanced electrochlorination systems are addressing challenges in raw material sourcing and chemical transport from a central chlor-alkali facility. These systems, combined with precise chemical dosing systems, help manage disinfection byproducts and chlorinated organic compounds from agents used in the textile bleaching process.
  • Even niche products like potassium hypochlorite and lithium hypochlorite are finding use where specific oxidizing agent properties are needed for biofouling control or eliminating waterborne pathogens. Facilities adopting on-site sodium hypochlorite generation have reported a 15% reduction in logistical costs.

What are the Key Data Covered in this Hypochlorite Bleaches Market Research and Growth Report?

  • What is the expected growth of the Hypochlorite Bleaches Market between 2026 and 2030?

    • USD 805.2 million, at a CAGR of 10.7%

  • What segmentation does the market report cover?

    • The report is segmented by Product (Sodium hypochlorite, Calcium hypochlorite, Potassium hypochlorite, and Lithium hypochlorite), Application (Disinfectant, Water treatment, Paper and pulp, and Textiles, and Others), Type (Liquid, and Solid) and Geography (APAC, North America, Europe, Middle East and Africa, South America)

  • Which regions are analyzed in the report?

    • APAC, North America, Europe, Middle East and Africa and South America

  • What are the key growth drivers and market challenges?

    • Heightened focus on public health and hygiene, Heightened regulatory scrutiny and compliance burdens

  • Who are the major players in the Hypochlorite Bleaches Market?

    • Aditya Birla Mgmt. Pvt. Ltd., AGC Inc., American Elements Inc., Arkema Group, Hawkins Inc., INEOS Group Holdings S.A., Merck KGaA, Nouryon Chemicals Holding, Odyssey Manufacturing Co., Olin Corp., PCC SE, Shijiazhuang Xinlongwei Chemical Co. Ltd., Somavrac Group, Tianjin YuFeng Chemical Co. Ltd., Tosoh Corp. and Vynova Beek BV

Market Research Insights

  • Market dynamics are shaped by a complex interplay between established applications and evolving demands for sustainability. While hypochlorite-based disinfectants remain critical for public health and hygiene, particularly for disinfection in healthcare and as essential water purification chemicals, there is a clear shift toward eco-conscious alternatives.
  • This trend influences the development of household disinfectant products and industrial bleaching chemicals, with a focus on reducing the environmental impact of bleach. Regulatory standards for bleach in wastewater treatment are becoming stricter, driving innovations in both liquid vs solid bleach formulations.
  • This has intensified the debate on sodium vs calcium hypochlorite for applications like swimming pool chemicals and pulp and paper bleaching. Manufacturers adopting sustainable packaging have seen a 5% improvement in brand perception, while innovations in formulations that are alternatives to chlorine bleach have helped some firms reduce compliance costs by up to 10%.

We can help! Our analysts can customize this hypochlorite bleaches market research report to meet your requirements.

Get in touch

1. Executive Summary

1.1 Market overview

Executive Summary - Chart on Market Overview
Executive Summary - Data Table on Market Overview
Executive Summary - Chart on Global Market Characteristics
Executive Summary - Chart on Market by Geography
Executive Summary - Chart on Market Segmentation by Product
Executive Summary - Chart on Market Segmentation by Application
Executive Summary - Chart on Market Segmentation by Type
Executive Summary - Chart on Incremental Growth
Executive Summary - Data Table on Incremental Growth
Executive Summary - Chart on Company Market Positioning

2. Technavio Analysis

2.1 Analysis of price sensitivity, lifecycle, customer purchase basket, adoption rates, and purchase criteria

2.2 Criticality of inputs and Factors of differentiation

Chart on Overview on criticality of inputs and factors of differentiation

2.3 Factors of disruption

Chart on Overview on factors of disruption

2.4 Impact of drivers and challenges

Chart on Impact of drivers and challenges in 2025 and 2030

3. Market Landscape

3.1 Market ecosystem

Chart on Parent Market
Data Table on - Parent Market

3.2 Market characteristics

Chart on Market characteristics analysis

3.3 Value chain analysis

Chart on Value chain analysis

4. Market Sizing

4.1 Market definition

Data Table on Offerings of companies included in the market definition

4.2 Market segment analysis

Market segments

4.3 Market size 2025

4.4 Market outlook: Forecast for 2025-2030

Chart on Global - Market size and forecast 2025-2030 ($ million)
Data Table on Global - Market size and forecast 2025-2030 ($ million)
Chart on Global Market: Year-over-year growth 2025-2030 (%)
Data Table on Global Market: Year-over-year growth 2025-2030 (%)

5. Historic Market Size

5.1 Global Hypochlorite Bleaches Market 2020 - 2024

Historic Market Size - Data Table on Global Hypochlorite Bleaches Market 2020 - 2024 ($ million)

5.2 Product segment analysis 2020 - 2024

Historic Market Size - Product Segment 2020 - 2024 ($ million)

5.3 Application segment analysis 2020 - 2024

Historic Market Size - Application Segment 2020 - 2024 ($ million)

5.4 Type segment analysis 2020 - 2024

Historic Market Size - Type Segment 2020 - 2024 ($ million)

5.5 Geography segment analysis 2020 - 2024

Historic Market Size - Geography Segment 2020 - 2024 ($ million)

5.6 Country segment analysis 2020 - 2024

Historic Market Size - Country Segment 2020 - 2024 ($ million)

6. Qualitative Analysis

6.1 Impact of AI on Global Hypochlorite Bleaches Market

7. Five Forces Analysis

7.1 Five forces summary

Five forces analysis - Comparison between 2025 and 2030

7.2 Bargaining power of buyers

Bargaining power of buyers - Impact of key factors 2025 and 2030

7.3 Bargaining power of suppliers

Bargaining power of suppliers - Impact of key factors in 2025 and 2030

7.4 Threat of new entrants

Threat of new entrants - Impact of key factors in 2025 and 2030

7.5 Threat of substitutes

Threat of substitutes - Impact of key factors in 2025 and 2030

7.6 Threat of rivalry

Threat of rivalry - Impact of key factors in 2025 and 2030

7.7 Market condition

Chart on Market condition - Five forces 2025 and 2030

8. Market Segmentation by Product

8.1 Market segments

Chart on Product - Market share 2025-2030 (%)
Data Table on Product - Market share 2025-2030 (%)

8.2 Comparison by Product

Chart on Comparison by Product
Data Table on Comparison by Product

8.3 Sodium hypochlorite - Market size and forecast 2025-2030

Chart on Sodium hypochlorite - Market size and forecast 2025-2030 ($ million)
Data Table on Sodium hypochlorite - Market size and forecast 2025-2030 ($ million)
Chart on Sodium hypochlorite - Year-over-year growth 2025-2030 (%)
Data Table on Sodium hypochlorite - Year-over-year growth 2025-2030 (%)

8.4 Calcium hypochlorite - Market size and forecast 2025-2030

Chart on Calcium hypochlorite - Market size and forecast 2025-2030 ($ million)
Data Table on Calcium hypochlorite - Market size and forecast 2025-2030 ($ million)
Chart on Calcium hypochlorite - Year-over-year growth 2025-2030 (%)
Data Table on Calcium hypochlorite - Year-over-year growth 2025-2030 (%)

8.5 Potassium hypochlorite - Market size and forecast 2025-2030

Chart on Potassium hypochlorite - Market size and forecast 2025-2030 ($ million)
Data Table on Potassium hypochlorite - Market size and forecast 2025-2030 ($ million)
Chart on Potassium hypochlorite - Year-over-year growth 2025-2030 (%)
Data Table on Potassium hypochlorite - Year-over-year growth 2025-2030 (%)

8.6 Lithium hypochlorite - Market size and forecast 2025-2030

Chart on Lithium hypochlorite - Market size and forecast 2025-2030 ($ million)
Data Table on Lithium hypochlorite - Market size and forecast 2025-2030 ($ million)
Chart on Lithium hypochlorite - Year-over-year growth 2025-2030 (%)
Data Table on Lithium hypochlorite - Year-over-year growth 2025-2030 (%)

8.7 Market opportunity by Product

Market opportunity by Product ($ million)
Data Table on Market opportunity by Product ($ million)

9. Market Segmentation by Application

9.1 Market segments

Chart on Application - Market share 2025-2030 (%)
Data Table on Application - Market share 2025-2030 (%)

9.2 Comparison by Application

Chart on Comparison by Application
Data Table on Comparison by Application

9.3 Disinfectant - Market size and forecast 2025-2030

Chart on Disinfectant - Market size and forecast 2025-2030 ($ million)
Data Table on Disinfectant - Market size and forecast 2025-2030 ($ million)
Chart on Disinfectant - Year-over-year growth 2025-2030 (%)
Data Table on Disinfectant - Year-over-year growth 2025-2030 (%)

9.4 Water treatment - Market size and forecast 2025-2030

Chart on Water treatment - Market size and forecast 2025-2030 ($ million)
Data Table on Water treatment - Market size and forecast 2025-2030 ($ million)
Chart on Water treatment - Year-over-year growth 2025-2030 (%)
Data Table on Water treatment - Year-over-year growth 2025-2030 (%)

9.5 Paper and pulp - Market size and forecast 2025-2030

Chart on Paper and pulp - Market size and forecast 2025-2030 ($ million)
Data Table on Paper and pulp - Market size and forecast 2025-2030 ($ million)
Chart on Paper and pulp - Year-over-year growth 2025-2030 (%)
Data Table on Paper and pulp - Year-over-year growth 2025-2030 (%)

9.6 Textiles - Market size and forecast 2025-2030

Chart on Textiles - Market size and forecast 2025-2030 ($ million)
Data Table on Textiles - Market size and forecast 2025-2030 ($ million)
Chart on Textiles - Year-over-year growth 2025-2030 (%)
Data Table on Textiles - Year-over-year growth 2025-2030 (%)

9.7 Others - Market size and forecast 2025-2030

Chart on Others - Market size and forecast 2025-2030 ($ million)
Data Table on Others - Market size and forecast 2025-2030 ($ million)
Chart on Others - Year-over-year growth 2025-2030 (%)
Data Table on Others - Year-over-year growth 2025-2030 (%)

9.8 Market opportunity by Application

Market opportunity by Application ($ million)
Data Table on Market opportunity by Application ($ million)

10. Market Segmentation by Type

10.1 Market segments

Chart on Type - Market share 2025-2030 (%)
Data Table on Type - Market share 2025-2030 (%)

10.2 Comparison by Type

Chart on Comparison by Type
Data Table on Comparison by Type

10.3 Liquid - Market size and forecast 2025-2030

Chart on Liquid - Market size and forecast 2025-2030 ($ million)
Data Table on Liquid - Market size and forecast 2025-2030 ($ million)
Chart on Liquid - Year-over-year growth 2025-2030 (%)
Data Table on Liquid - Year-over-year growth 2025-2030 (%)

10.4 Solid - Market size and forecast 2025-2030

Chart on Solid - Market size and forecast 2025-2030 ($ million)
Data Table on Solid - Market size and forecast 2025-2030 ($ million)
Chart on Solid - Year-over-year growth 2025-2030 (%)
Data Table on Solid - Year-over-year growth 2025-2030 (%)

10.5 Market opportunity by Type

Market opportunity by Type ($ million)
Data Table on Market opportunity by Type ($ million)

11. Customer Landscape

11.1 Customer landscape overview

Analysis of price sensitivity, lifecycle, customer purchase basket, adoption rates, and purchase criteria

12. Geographic Landscape

12.1 Geographic segmentation

Chart on Market share by geography 2025-2030 (%)
Data Table on Market share by geography 2025-2030 (%)

12.2 Geographic comparison

Chart on Geographic comparison
Data Table on Geographic comparison

12.3 APAC - Market size and forecast 2025-2030

Chart on APAC - Market size and forecast 2025-2030 ($ million)
Data Table on APAC - Market size and forecast 2025-2030 ($ million)
Chart on APAC - Year-over-year growth 2025-2030 (%)
Data Table on APAC - Year-over-year growth 2025-2030 (%)
Chart on Regional Comparison - APAC
Data Table on Regional Comparison - APAC

12.3.1 China - Market size and forecast 2025-2030

Chart on China - Market size and forecast 2025-2030 ($ million)
Data Table on China - Market size and forecast 2025-2030 ($ million)
Chart on China - Year-over-year growth 2025-2030 (%)
Data Table on China - Year-over-year growth 2025-2030 (%)

12.3.2 India - Market size and forecast 2025-2030

Chart on India - Market size and forecast 2025-2030 ($ million)
Data Table on India - Market size and forecast 2025-2030 ($ million)
Chart on India - Year-over-year growth 2025-2030 (%)
Data Table on India - Year-over-year growth 2025-2030 (%)

12.3.3 Japan - Market size and forecast 2025-2030

Chart on Japan - Market size and forecast 2025-2030 ($ million)
Data Table on Japan - Market size and forecast 2025-2030 ($ million)
Chart on Japan - Year-over-year growth 2025-2030 (%)
Data Table on Japan - Year-over-year growth 2025-2030 (%)

12.3.4 Australia - Market size and forecast 2025-2030

Chart on Australia - Market size and forecast 2025-2030 ($ million)
Data Table on Australia - Market size and forecast 2025-2030 ($ million)
Chart on Australia - Year-over-year growth 2025-2030 (%)
Data Table on Australia - Year-over-year growth 2025-2030 (%)

12.3.5 South Korea - Market size and forecast 2025-2030

Chart on South Korea - Market size and forecast 2025-2030 ($ million)
Data Table on South Korea - Market size and forecast 2025-2030 ($ million)
Chart on South Korea - Year-over-year growth 2025-2030 (%)
Data Table on South Korea - Year-over-year growth 2025-2030 (%)

12.3.6 Indonesia - Market size and forecast 2025-2030

Chart on Indonesia - Market size and forecast 2025-2030 ($ million)
Data Table on Indonesia - Market size and forecast 2025-2030 ($ million)
Chart on Indonesia - Year-over-year growth 2025-2030 (%)
Data Table on Indonesia - Year-over-year growth 2025-2030 (%)

12.4 North America - Market size and forecast 2025-2030

Chart on North America - Market size and forecast 2025-2030 ($ million)
Data Table on North America - Market size and forecast 2025-2030 ($ million)
Chart on North America - Year-over-year growth 2025-2030 (%)
Data Table on North America - Year-over-year growth 2025-2030 (%)
Chart on Regional Comparison - North America
Data Table on Regional Comparison - North America

12.4.1 US - Market size and forecast 2025-2030

Chart on US - Market size and forecast 2025-2030 ($ million)
Data Table on US - Market size and forecast 2025-2030 ($ million)
Chart on US - Year-over-year growth 2025-2030 (%)
Data Table on US - Year-over-year growth 2025-2030 (%)

12.4.2 Canada - Market size and forecast 2025-2030

Chart on Canada - Market size and forecast 2025-2030 ($ million)
Data Table on Canada - Market size and forecast 2025-2030 ($ million)
Chart on Canada - Year-over-year growth 2025-2030 (%)
Data Table on Canada - Year-over-year growth 2025-2030 (%)

12.4.3 Mexico - Market size and forecast 2025-2030

Chart on Mexico - Market size and forecast 2025-2030 ($ million)
Data Table on Mexico - Market size and forecast 2025-2030 ($ million)
Chart on Mexico - Year-over-year growth 2025-2030 (%)
Data Table on Mexico - Year-over-year growth 2025-2030 (%)

12.5 Europe - Market size and forecast 2025-2030

Chart on Europe - Market size and forecast 2025-2030 ($ million)
Data Table on Europe - Market size and forecast 2025-2030 ($ million)
Chart on Europe - Year-over-year growth 2025-2030 (%)
Data Table on Europe - Year-over-year growth 2025-2030 (%)
Chart on Regional Comparison - Europe
Data Table on Regional Comparison - Europe

12.5.1 Germany - Market size and forecast 2025-2030

Chart on Germany - Market size and forecast 2025-2030 ($ million)
Data Table on Germany - Market size and forecast 2025-2030 ($ million)
Chart on Germany - Year-over-year growth 2025-2030 (%)
Data Table on Germany - Year-over-year growth 2025-2030 (%)

12.5.2 France - Market size and forecast 2025-2030

Chart on France - Market size and forecast 2025-2030 ($ million)
Data Table on France - Market size and forecast 2025-2030 ($ million)
Chart on France - Year-over-year growth 2025-2030 (%)
Data Table on France - Year-over-year growth 2025-2030 (%)

12.5.3 UK - Market size and forecast 2025-2030

Chart on UK - Market size and forecast 2025-2030 ($ million)
Data Table on UK - Market size and forecast 2025-2030 ($ million)
Chart on UK - Year-over-year growth 2025-2030 (%)
Data Table on UK - Year-over-year growth 2025-2030 (%)

12.5.4 Italy - Market size and forecast 2025-2030

Chart on Italy - Market size and forecast 2025-2030 ($ million)
Data Table on Italy - Market size and forecast 2025-2030 ($ million)
Chart on Italy - Year-over-year growth 2025-2030 (%)
Data Table on Italy - Year-over-year growth 2025-2030 (%)

12.5.5 Spain - Market size and forecast 2025-2030

Chart on Spain - Market size and forecast 2025-2030 ($ million)
Data Table on Spain - Market size and forecast 2025-2030 ($ million)
Chart on Spain - Year-over-year growth 2025-2030 (%)
Data Table on Spain - Year-over-year growth 2025-2030 (%)

12.5.6 The Netherlands - Market size and forecast 2025-2030

Chart on The Netherlands - Market size and forecast 2025-2030 ($ million)
Data Table on The Netherlands - Market size and forecast 2025-2030 ($ million)
Chart on The Netherlands - Year-over-year growth 2025-2030 (%)
Data Table on The Netherlands - Year-over-year growth 2025-2030 (%)

12.6 Middle East and Africa - Market size and forecast 2025-2030

Chart on Middle East and Africa - Market size and forecast 2025-2030 ($ million)
Data Table on Middle East and Africa - Market size and forecast 2025-2030 ($ million)
Chart on Middle East and Africa - Year-over-year growth 2025-2030 (%)
Data Table on Middle East and Africa - Year-over-year growth 2025-2030 (%)
Chart on Regional Comparison - Middle East and Africa
Data Table on Regional Comparison - Middle East and Africa

12.6.1 Saudi Arabia - Market size and forecast 2025-2030

Chart on Saudi Arabia - Market size and forecast 2025-2030 ($ million)
Data Table on Saudi Arabia - Market size and forecast 2025-2030 ($ million)
Chart on Saudi Arabia - Year-over-year growth 2025-2030 (%)
Data Table on Saudi Arabia - Year-over-year growth 2025-2030 (%)

12.6.2 UAE - Market size and forecast 2025-2030

Chart on UAE - Market size and forecast 2025-2030 ($ million)
Data Table on UAE - Market size and forecast 2025-2030 ($ million)
Chart on UAE - Year-over-year growth 2025-2030 (%)
Data Table on UAE - Year-over-year growth 2025-2030 (%)

12.6.3 Turkey - Market size and forecast 2025-2030

Chart on Turkey - Market size and forecast 2025-2030 ($ million)
Data Table on Turkey - Market size and forecast 2025-2030 ($ million)
Chart on Turkey - Year-over-year growth 2025-2030 (%)
Data Table on Turkey - Year-over-year growth 2025-2030 (%)

12.6.4 South Africa - Market size and forecast 2025-2030

Chart on South Africa - Market size and forecast 2025-2030 ($ million)
Data Table on South Africa - Market size and forecast 2025-2030 ($ million)
Chart on South Africa - Year-over-year growth 2025-2030 (%)
Data Table on South Africa - Year-over-year growth 2025-2030 (%)

12.6.5 Egypt - Market size and forecast 2025-2030

Chart on Egypt - Market size and forecast 2025-2030 ($ million)
Data Table on Egypt - Market size and forecast 2025-2030 ($ million)
Chart on Egypt - Year-over-year growth 2025-2030 (%)
Data Table on Egypt - Year-over-year growth 2025-2030 (%)

12.7 South America - Market size and forecast 2025-2030

Chart on South America - Market size and forecast 2025-2030 ($ million)
Data Table on South America - Market size and forecast 2025-2030 ($ million)
Chart on South America - Year-over-year growth 2025-2030 (%)
Data Table on South America - Year-over-year growth 2025-2030 (%)
Chart on Regional Comparison - South America
Data Table on Regional Comparison - South America

12.7.1 Brazil - Market size and forecast 2025-2030

Chart on Brazil - Market size and forecast 2025-2030 ($ million)
Data Table on Brazil - Market size and forecast 2025-2030 ($ million)
Chart on Brazil - Year-over-year growth 2025-2030 (%)
Data Table on Brazil - Year-over-year growth 2025-2030 (%)

12.7.2 Argentina - Market size and forecast 2025-2030

Chart on Argentina - Market size and forecast 2025-2030 ($ million)
Data Table on Argentina - Market size and forecast 2025-2030 ($ million)
Chart on Argentina - Year-over-year growth 2025-2030 (%)
Data Table on Argentina - Year-over-year growth 2025-2030 (%)

12.7.3 Colombia - Market size and forecast 2025-2030

Chart on Colombia - Market size and forecast 2025-2030 ($ million)
Data Table on Colombia - Market size and forecast 2025-2030 ($ million)
Chart on Colombia - Year-over-year growth 2025-2030 (%)
Data Table on Colombia - Year-over-year growth 2025-2030 (%)

12.8 Market opportunity by geography

Market opportunity by geography ($ million)
Data Tables on Market opportunity by geography ($ million)

13. Drivers, Challenges, and Opportunity

13.1 Market drivers

Heightened focus on public health and hygiene
Expanding applications in water and wastewater treatment
Increasing consumer demand for household cleaning and disinfection products

13.2 Market challenges

Heightened regulatory scrutiny and compliance burdens
Persistent supply chain volatility and geopolitical disruptions
Ascendant consumer demand for eco-conscious alternatives

13.3 Impact of drivers and challenges

Impact of drivers and challenges in 2025 and 2030

13.4 Market opportunities

Heightened focus on sanitization and disinfection practices
Escalating demand for water and wastewater treatment
Robust growth in pulp and paper industry

14. Competitive Landscape

14.1 Overview

14.2

Overview on criticality of inputs and factors of differentiation

14.3 Landscape disruption

Overview on factors of disruption

14.4 Industry risks

Impact of key risks on business

15. Competitive Analysis

15.1 Companies profiled

Companies covered

15.2 Company ranking index

15.3 Market positioning of companies

Matrix on companies position and classification

15.4 Aditya Birla Mgmt. Pvt. Ltd.

Aditya Birla Mgmt. Pvt. Ltd. - Overview
Aditya Birla Mgmt. Pvt. Ltd. - Product / Service
Aditya Birla Mgmt. Pvt. Ltd. - Key offerings
SWOT

15.5 AGC Inc.

AGC Inc. - Overview
AGC Inc. - Business segments
AGC Inc. - Key news
AGC Inc. - Key offerings
AGC Inc. - Segment focus
SWOT

15.6 American Elements Inc.

American Elements Inc. - Overview
American Elements Inc. - Product / Service
American Elements Inc. - Key offerings
SWOT

15.7 Arkema Group

Arkema Group - Overview
Arkema Group - Business segments
Arkema Group - Key news
Arkema Group - Key offerings
Arkema Group - Segment focus
SWOT

15.8 Hawkins Inc.

Hawkins Inc. - Overview
Hawkins Inc. - Business segments
Hawkins Inc. - Key offerings
Hawkins Inc. - Segment focus
SWOT

15.9 INEOS Group Holdings S.A.

INEOS Group Holdings S.A. - Overview
INEOS Group Holdings S.A. - Product / Service
INEOS Group Holdings S.A. - Key news
INEOS Group Holdings S.A. - Key offerings
SWOT

15.10 Merck KGaA

Merck KGaA - Overview
Merck KGaA - Business segments
Merck KGaA - Key news
Merck KGaA - Key offerings
Merck KGaA - Segment focus
SWOT

15.11 Nouryon Chemicals Holding

Nouryon Chemicals Holding - Overview
Nouryon Chemicals Holding - Product / Service
Nouryon Chemicals Holding - Key offerings
SWOT

15.12 Odyssey Manufacturing Co.

Odyssey Manufacturing Co. - Overview
Odyssey Manufacturing Co. - Product / Service
Odyssey Manufacturing Co. - Key offerings
SWOT

15.13 Olin Corp.

Olin Corp. - Overview
Olin Corp. - Business segments
Olin Corp. - Key offerings
Olin Corp. - Segment focus
SWOT

15.14 PCC SE

PCC SE - Overview
PCC SE - Product / Service
PCC SE - Key offerings
SWOT

15.15 Shijiazhuang Xinlongwei Chemical Co. Ltd.

Shijiazhuang Xinlongwei Chemical Co. Ltd. - Overview
Shijiazhuang Xinlongwei Chemical Co. Ltd. - Product / Service
Shijiazhuang Xinlongwei Chemical Co. Ltd. - Key offerings
SWOT

15.16 Somavrac Group

Somavrac Group - Overview
Somavrac Group - Product / Service
Somavrac Group - Key offerings
SWOT

15.17 Tianjin YuFeng Chemical Co. Ltd.

Tianjin YuFeng Chemical Co. Ltd. - Overview
Tianjin YuFeng Chemical Co. Ltd. - Product / Service
Tianjin YuFeng Chemical Co. Ltd. - Key offerings
SWOT

15.18 Tosoh Corp.

Tosoh Corp. - Overview
Tosoh Corp. - Business segments
Tosoh Corp. - Key offerings
Tosoh Corp. - Segment focus
SWOT

16. Appendix

16.1 Scope of the report

Market definition
Objectives
Notes and caveats

16.2 Inclusions and exclusions checklist

Inclusions checklist
Exclusions checklist

16.3 Currency conversion rates for US$

16.4 Research methodology

16.5 Data procurement

Information sources

16.6 Data validation

16.7 Validation techniques employed for market sizing

16.8 Data synthesis

16.9 360 degree market analysis

16.10 List of abbreviations

Research Methodology

Technavio presents a detailed picture of the market by way of study, synthesis, and summation of data from multiple sources. The analysts have presented the various facets of the market with a particular focus on identifying the key industry influencers. The data thus presented is comprehensive, reliable, and the result of extensive research, both primary and secondary.

INFORMATION SOURCES

Primary sources

  • Manufacturers and suppliers
  • Channel partners
  • Industry experts
  • Strategic decision makers

Secondary sources

  • Industry journals and periodicals
  • Government data
  • Financial reports of key industry players
  • Historical data
  • Press releases

DATA ANALYSIS

Data Synthesis

  • Collation of data
  • Estimation of key figures
  • Analysis of derived insights

Data Validation

  • Triangulation with data models
  • Reference against proprietary databases
  • Corroboration with industry experts

REPORT WRITING

Qualitative

  • Market drivers
  • Market challenges
  • Market trends
  • Five forces analysis

Quantitative

  • Market size and forecast
  • Market segmentation
  • Geographical insights
  • Competitive landscape

Interested in this report?

Get your sample now to see our research methodology and insights!

Download Now

Frequently Asked Questions

Hypochlorite Bleaches market growth will increase by USD 805.2 million during 2026-2030 .

The Hypochlorite Bleaches market is expected to grow at a CAGR of 10.7% during 2026-2030 .

Hypochlorite Bleaches market is segmented by Product (Sodium hypochlorite, Calcium hypochlorite, Potassium hypochlorite, Lithium hypochlorite) Application (Disinfectant, Water treatment, Paper and pulp, Textiles, Others) Type (Liquid, Solid)

Aditya Birla Mgmt. Pvt. Ltd., AGC Inc., American Elements Inc., Arkema Group, Hawkins Inc., INEOS Group Holdings S.A., Merck KGaA, Nouryon Chemicals Holding, Odyssey Manufacturing Co., Olin Corp., PCC SE, Shijiazhuang Xinlongwei Chemical Co. Ltd., Somavrac Group, Tianjin YuFeng Chemical Co. Ltd., Tosoh Corp., Vynova Beek BV are a few of the key vendors in the Hypochlorite Bleaches market.

APAC will register the highest growth rate of 41.3% among the other regions. Therefore, the Hypochlorite Bleaches market in APAC is expected to garner significant business opportunities for the vendors during the forecast period.

China, India, Japan, Australia, South Korea, Indonesia, US, Canada, Mexico, Germany, France, UK, Italy, Spain, The Netherlands, Saudi Arabia, UAE, Turkey, South Africa, Egypt, Brazil, Argentina, Colombia

  • Heightened focus on public health and hygiene is the driving factor this market.

The Hypochlorite Bleaches market vendors should focus on grabbing business opportunities from the Product segment as it accounted for the largest market share in the base year.