In-Building Wireless Market Analysis North America, APAC, Europe, South America, Middle East and Africa - US, China, Japan, South Korea, UK - Size and Forecast 2024-2028

In-Building Wireless Market Analysis North America, APAC, Europe, South America, Middle East and Africa - US, China, Japan, South Korea, UK - Size and Forecast 2024-2028

Published: Apr 2024 186 Pages SKU: IRTNTR77866

Market Overview at a Glance

$7.40 B
Market Opportunity
8.8%
CAGR
7.9
YoY growth 2023-2024(%)

In Building Wireless Market Size 2024-2028 

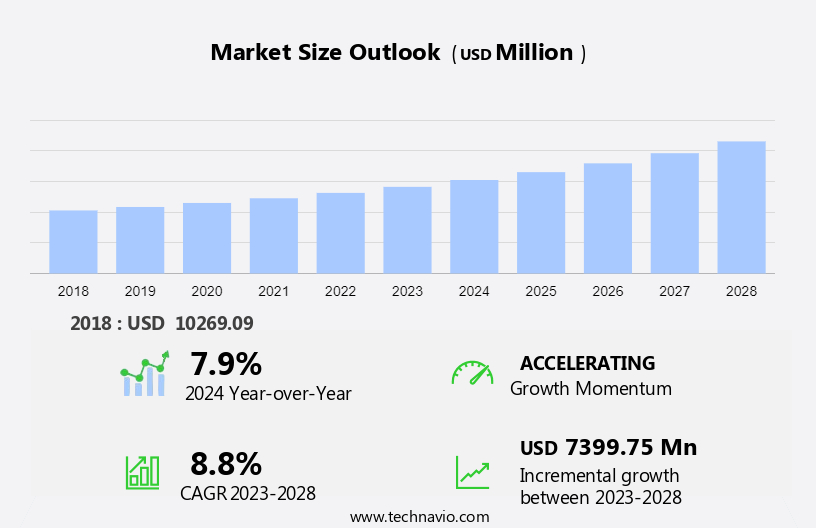
The in building wireless market size is forecast to increase by USD 7.40 billion at a CAGR of 8.8% between 2023 and 2028. The in-building wireless market is experiencing significant growth in the US, driven by the increasing demand for LTE/5G wireless connectivity in smart cities and the proliferation of intelligent and smart devices used by smartphone users. The number of mobile internet users and smartphone subscriptions continues to rise, leading to a growth in demand for reliable in-building wireless coverage. However, this growth comes with challenges, including the threat of cyberattacks targeting RAN users and the need to upgrade infrastructure components, such as base stations, to support the demands of 5G networks. Similarly, the in-building wireless market is witnessing the expansion of radio spectrum to accommodate the growing demand for wireless connectivity. IoT-focused Wi-Fi standards, such as 802.11ax, are being adopted to improve network performance and capacity. In conclusion, the in-building wireless market is an essential component of the digital transformation landscape. Companies like ExteNet Systems are at the forefront of addressing these challenges, providing innovative solutions to ensure seamless and secure wireless connectivity in various industries and commercial properties, including MGM properties and other high-traffic venues. The intelligent integration of these in-building wireless systems is crucial to support the increasing number of connected devices and ensure optimal network performance.

What will be the Size of the Market During the Forecast Period?

In Building Wireless Market Size

 Request Free Sample

In-building wireless connectivity has emerged as a crucial element in the digital transformation of businesses and public institutions. As the reliance on mobile devices and smart technologies continues to grow, ensuring reliable network coverage within buildings is no longer an option but a necessity. Network coverage is essential for various mission-critical applications, including public safety measures, business assurance, and smart devices. With the increasing popularity of mobile internet and smartphone subscriptions, in-building wireless solutions have become indispensable. The digital change has led to a wave in the number of intelligent devices and smartphone users, resulting in a higher demand for in-building wireless connectivity.

In response, the market for in-building wireless solutions has witnessed significant growth. 5G network is poised to revolutionize the in-building wireless market by offering faster data transfer rates, lower latency, and higher bandwidth. This technology will enable seamless connectivity for a multitude of devices and applications, enhancing productivity and efficiency. However, with the increasing adoption of in-building wireless solutions comes the risk of cyberattacks. Ensuring the security of these networks is vital to protect sensitive data and maintain business continuity. The infrastructure components of in-building wireless systems include Wi-Fi, Bluetooth, Zigbee, LPWANs, and cellular networks. Cloud-managed Wi-Fi and RFID are also gaining popularity due to their ease of deployment and management.  Providing reliable and secure wireless connectivity is crucial for businesses and institutions to remain competitive and efficient. As the number of connected devices continues to grow, the demand for in-building wireless solutions will only increase.

Market Segmentation

The market research report provides comprehensive data (region-wise segment analysis), with forecasts and estimates in "USD billion" for the period 2024-2028, as well as historical data from 2018-2022 for the following segments.
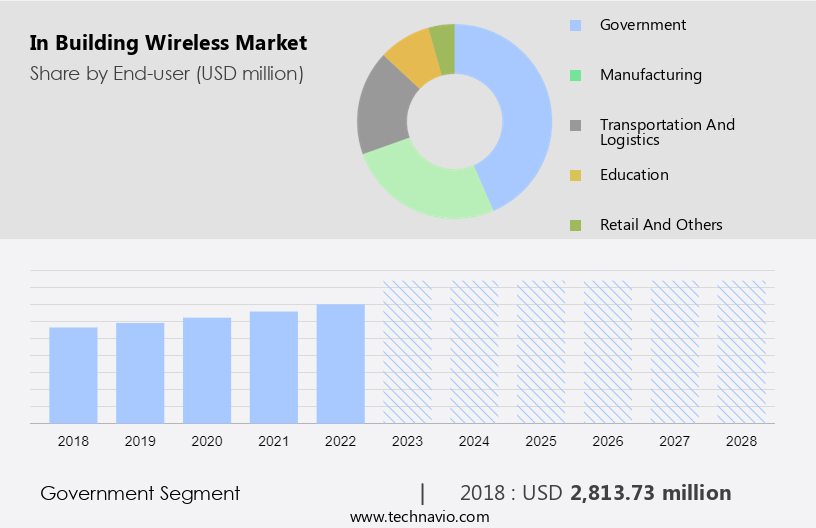
  • End-user
    • Government
    • Manufacturing
    • Transportation and logistics
    • Education
    • Retail and others
  • Type
    • Infrastructure
    • Services
  • Geography
    • North America
      • US
    • APAC
      • China
      • Japan
      • South Korea
    • Europe
      • UK
    • South America
    • Middle East and Africa

By End-user Insights

The government segment is estimated to witness significant growth during the forecast period. The market is experiencing significant growth, particularly within the government sector. Governments worldwide are investing in small cell infrastructure, including picocells, to improve cellular connectivity for all devices inside buildings. companies in this market catering to the government segment offer specialized in-building wireless solutions. These solutions are designed for various government entities such as local municipalities, cities, counties, state, and federal agencies. In-building wireless systems are deployed to boost indoor radio frequency and cellular signals in large government structures and sprawling campus environments. Public safety solutions are a growing focus, and there is an increasing emphasis on adhering to building codes and fire safety protocols.

Similarly, the National Fire Protection Agency (NFPA) and the International Fire Code (IFC) set strict requirements for emergency communication signal strength, coverage, and capacity. These regulations ensure effective communication during emergencies. Telecom equipment producers are developing Wi-Fi solutions, LPWANs, and IoT-focused Wi-Fi standards, such as Bluetooth, Zigbee, and Wi-Fi, to cater to the unique needs of the government sector. Cloud-managed Wi-Fi is also gaining popularity due to its ease of management and scalability. The government sector's demand for reliable, high-speed data throughput and secure communication networks is driving the growth of the in-building wireless market.

In Building Wireless Market Size

Get a glance at the market share of various segments Request Free Sample

The government segment was valued at USD 2.81 billion in 2018 and showed a gradual increase during the forecast period.

Regional Insights

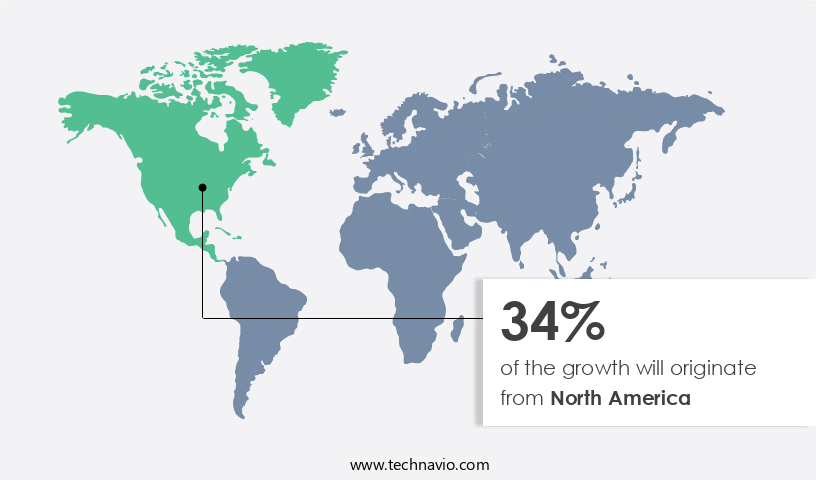
North America is estimated to contribute 34% to the growth of the global market during the forecast period. Technavio's analysts have elaborately explained the regional trends and drivers that shape the market during the forecast period.

In Building Wireless Market Share by Geography

For more insights on the market share of various regions Request Free Sample

The proliferation of Internet-connected devices and the adoption of automation technologies are fueling the expansion of the in-building wireless market in the US. With the increasing number of smart homes and smart city initiatives, there is a growing need for reliable in-building connectivity, particularly in areas where cellular connectivity may be weak or nonexistent. These advanced technologies not only enhance network coverage but also support mission-critical applications and public safety measures, making them indispensable in various industries, including healthcare, education, and manufacturing. In summary, the US in-building wireless market is poised for significant growth due to the digital transformation, increasing investment in 5G, and the need for reliable in-building connectivity.

Our researchers analyzed the data with 2023 as the base year, along with the key drivers, trends, and challenges. A holistic analysis of drivers will help companies refine their marketing strategies to gain a competitive advantage.

Market Driver

An increase in demand for in building wireless due to growth of smart cities is the key driver of the market. In the realm of modern urban development, the concept of smart cities has gained significant traction. A smart city is an initiative to integrate various information and communication technologies into a city's infrastructure. This includes local government departments, educational institutions, transportation systems, power plants, water supply networks, and waste management facilities. The integration of these systems leads to enhanced connectivity and improved efficiency. One essential aspect of a smart city is the availability of reliable wireless coverage, particularly inside buildings. This need is met through the implementation of MulteFire bands, which provide cellular coverage within buildings, ensuring a seamless wireless experience for occupants.

Similarly, these inside-building projects require network management and the installation of third-party networking infrastructure, which may involve obtaining building permits. The adoption of in-building wireless solutions is not limited to new residential construction but extends to existing real estate assets, such as multi-tenant housing and residential communities. The integration of these technologies enhances the value of these properties by providing tenants with superior connectivity. In conclusion, the development of smart cities is a priority for many countries, and the integration of in-building wireless solutions is a crucial component. The use of MulteFire bands and third-party networking infrastructure enables reliable cellular coverage, enhancing the overall wireless experience for occupants of various facilities. This investment not only improves the functionality of buildings but also adds value to real estate assets.

Market Trends

Rising adoption of BYOD in enterprise is the upcoming trend in the market. The in-building wireless market in the US is poised for significant growth due to the increasing adoption of LTE/5G wireless technology and the proliferation of intelligent and smart devices among mobile internet users. According to recent studies, smartphone subscriptions in the country are on the rise, with a large portion of the workforce utilizing bring-your-own-device (BYOD) policies. MGM properties and other large enterprises are investing in advanced communication solutions to cater to the connectivity needs of their employees and customers. In response, infrastructure providers like ExteNet Systems are expanding their offerings to include distributed antenna systems (DAS) and small cell base stations. These infrastructure components are essential for enhancing indoor coverage and capacity for mobile networks, particularly in high-density areas such as offices, malls, and stadiums.

However, the increasing use of in-building wireless solutions also brings cybersecurity concerns, as these networks can be vulnerable to cyberattacks. As such, it is crucial for RAN users to prioritize network security and implement strong infrastructure and protocols to mitigate risks. In conclusion, the in-building wireless market in the US is expected to experience substantial growth due to the rising demand for enhanced connectivity and the increasing adoption of smart devices. By investing in advanced communication solutions, businesses can improve productivity, enhance the customer experience, and stay competitive in today's digital landscape.

Market Challenge

The threat of cybersecurity breaches is a key challenge affecting market growth. In Building Wireless solutions are gaining traction in the US market, particularly in smart cities and automated buildings, to ensure seamless communication among connected devices. Electronics and Telecommunications companies, such as Comba Network and Comba Telecom, are at the forefront of this development, introducing 5G extended picocells to enhance connectivity. Telecom operators are increasingly investing in these networks to cater to the growing demand for high-speed internet.

However, the integration of 5G networks brings new security challenges. Cyber-attacks on these networks can lead to data breaches or Distributed Denial of Service (DDoS) attacks. As the use of wireless technology continues to evolve, it is crucial for organizations to prioritize cybersecurity measures to safeguard their networks and consumer data. Wireless router technology plays a significant role in securing these networks, with advanced features like encryption and firewalls becoming essential. The future of in-building wireless networks lies in continued innovation and collaboration between technology providers and telecom operators to address the evolving needs of businesses and consumers.

Exclusive Customer Landscape

The market forecasting report includes the adoption lifecycle of the market, covering from the innovator's stage to the laggard's stage. It focuses on adoption rates in different regions based on penetration. Furthermore, the report also includes key purchase criteria and drivers of price sensitivity to help companies evaluate and develop their market growth analysis strategies.

In Building Wireless Market Share by Geography

 Customer Landscape

Key Companies & Market Insights

Companies are implementing various strategies, such as strategic alliances, partnerships, mergers and acquisitions, geographical expansion, and product/service launches, to enhance their presence in the market.

Airspan Networks Holdings Inc: The company offers in-building wireless solutions such as Neutral Host Networks, which optimize shared infrastructure and are perfect for small and medium-sized buildings with lower densities.

The market research and growth report includes detailed analyses of the competitive landscape of the market and information about key companies, including:

  • Advanced RF Technologies Inc.
  • Airspan Networks Holdings Inc.
  • American Tower Corp.
  • AT and T Inc.
  • BTI wireless
  • Cellnex Telecom SA
  • CommScope Holding Co. Inc.
  • Corning Inc.
  • Dali Wireless
  • Huawei Technologies Co. Ltd.
  • LBA Group Inc.
  • MILLER ELECTRIC CO.
  • NEC Corporation
  • PBE Group
  • Samsung Electronics Co. Ltd.
  • SOLiD
  • Telefonaktiebolaget LM Ericsson
  • Uniinfo Telecom Services Ltd.
  • Verizon Communications Inc.
  • WESCO International Inc.
  • Wilson Electronics

Qualitative and quantitative analysis of companies has been conducted to help clients understand the wider business environment as well as the strengths and weaknesses of key market players. Data is qualitatively analyzed to categorize companies as pure play, category-focused, industry-focused, and diversified; it is quantitatively analyzed to categorize companies as dominant, leading, strong, tentative, and weak.

Research Analyst Overview

In-building wireless solutions have gained significant attention in the worldwide market due to the increasing demand for reliable network coverage in various facilities. With the digital change, mission-critical applications and smart devices have become an integral part of our daily lives, leading to a growth in mobile internet usage and smartphone subscriptions. In-building wireless solutions provide uninterrupted cellular connectivity, ensuring business assurance and public safety measures in buildings and rural areas. The use of smart technologies such as 5G extended picocells, routers, and antennas has revolutionized in-building wireless technology. Telecom operators are investing in small cell infrastructure, including picocells and small cells, to expand their network coverage and enhance data throughput.

Additionally, unlicensed spectrum, such as CBRS and MulteFire bands, is being utilized to provide in-building wireless connectivity without the need for building permits or third-party networking infrastructure. Real estate assets, including multi-tenant housing, residential communities, and commercial facilities, are increasingly adopting in-building wireless solutions to meet the growing demand for reliable connectivity. In-building wireless market is witnessing significant growth due to the increasing penetration of digital technologies and the increasing use of intelligent devices and smartphones. Cyberattacks and RAN users are driving the need for advanced infrastructure components, including base stations, small cells, and repeaters. The development of wireless technology, including router technology and Wi-Fi solutions, is a key factor in the growth of the in-building wireless market.

In conclusion, the in-building wireless market is witnessing significant growth due to the increasing demand for reliable network coverage, the adoption of smart technologies, and digital transformation. The use of various wireless technologies, including LTE/5G wireless, Wi-Fi, Bluetooth, Zigbee, and Li-Fi, is driving the growth of the market. The market is expected to continue growing due to the increasing penetration of digital technologies, the increasing use of intelligent devices, and the expanding use cases for in-building wireless solutions.

Market Scope

Report Coverage

Details

Page number

186

Base year

2023

Historic period

2018-2022

Forecast period

2024-2028

Growth momentum & CAGR

Accelerate at a CAGR of 8.8%

Market growth 2024-2028

USD 7.40 billion

Market structure

Fragmented

YoY growth 2023-2024(%)

7.9

Regional analysis

North America, APAC, Europe, South America, and Middle East and Africa

Performing market contribution

North America at 34%

Key countries

US, China, Japan, South Korea, and UK

Competitive landscape

Leading Companies, Market Positioning of Companies, Competitive Strategies, and Industry Risks

Key companies profiled

Advanced RF Technologies Inc., Airspan Networks Holdings Inc., American Tower Corp., AT and T Inc., BTI wireless, Cellnex Telecom SA, CommScope Holding Co. Inc., Corning Inc., Dali Wireless, Huawei Technologies Co. Ltd., LBA Group Inc., MILLER ELECTRIC CO., NEC Corporation, PBE Group, Samsung Electronics Co. Ltd., SOLiD, Telefonaktiebolaget LM Ericsson, Uniinfo Telecom Services Ltd., Verizon Communications Inc., WESCO International Inc., and Wilson Electronics

Market dynamics

Parent market analysis, market growth inducers and obstacles, market forecast, fast-growing and slow-growing segment analysis, COVID-19 impact and recovery analysis and future consumer dynamics, market condition analysis for the forecast period

Customization purview

If our market report has not included the data that you are looking for, you can reach out to our analysts and get segments customized.

Request Free Sample

What are the Key Data Covered in this Market Research and Growth Report?

  • CAGR of the market during the forecast period
  • Detailed information on factors that will drive the market growth and forecasting between 2024 and 2028
  • Precise estimation of the size of the market  and its contribution of the market in focus to the parent market
  • Accurate predictions about upcoming market growth and trends and changes in consumer behaviour
  • Growth of the market across North America, APAC, Europe, South America, and Middle East and Africa
  • Thorough analysis of the market's competitive landscape and detailed information about companies
  • Comprehensive analysis of factors that will challenge the growth of market companies

We can help! Our analysts can customize this market research report to meet your requirements. Get in touch

1 Executive Summary

  • 1.1 Market overview
    • Exhibit 01: Executive Summary – Chart on Market Overview
    • Exhibit 02: Executive Summary – Data Table on Market Overview
    • Exhibit 03: Executive Summary – Chart on Global Market Characteristics
    • Exhibit 04: Executive Summary – Chart on Market by Geography
    • Exhibit 05: Executive Summary – Chart on Market Segmentation by End-user
    • Exhibit 06: Executive Summary – Chart on Market Segmentation by Type
    • Exhibit 07: Executive Summary – Chart on Incremental Growth
    • Exhibit 08: Executive Summary – Data Table on Incremental Growth
    • Exhibit 09: Executive Summary – Chart on Vendor Market Positioning

2 Market Landscape

  • 2.1 Market ecosystem
    • Exhibit 10: Parent market
    • Exhibit 11: Market Characteristics

3 Market Sizing

  • 3.1 Market definition
    • Exhibit 12: Offerings of vendors included in the market definition
  • 3.2 Market segment analysis
    • Exhibit 13: Market segments
  • 3.3 Market size 2023
    • 3.4 Market outlook: Forecast for 2023-2028
      • Exhibit 14: Chart on Global - Market size and forecast 2023-2028 ($ million)
      • Exhibit 15: Data Table on Global - Market size and forecast 2023-2028 ($ million)
      • Exhibit 16: Chart on Global Market: Year-over-year growth 2023-2028 (%)
      • Exhibit 17: Data Table on Global Market: Year-over-year growth 2023-2028 (%)

    4 Historic Market Size

    • 4.1 Global in building wireless market 2018 - 2022
      • Exhibit 18: Historic Market Size – Data Table on global in building wireless market 2018 - 2022 ($ million)
    • 4.2 End-user Segment Analysis 2018 - 2022
      • Exhibit 19: Historic Market Size – End-user Segment 2018 - 2022 ($ million)
    • 4.3 Type Segment Analysis 2018 - 2022
      • Exhibit 20: Historic Market Size – Type Segment 2018 - 2022 ($ million)
    • 4.4 Geography Segment Analysis 2018 - 2022
      • Exhibit 21: Historic Market Size – Geography Segment 2018 - 2022 ($ million)
    • 4.5 Country Segment Analysis 2018 - 2022
      • Exhibit 22: Historic Market Size – Country Segment 2018 - 2022 ($ million)

    5 Five Forces Analysis

    • 5.1 Five forces summary
      • Exhibit 23: Five forces analysis - Comparison between 2023 and 2028
    • 5.2 Bargaining power of buyers
      • Exhibit 24: Chart on Bargaining power of buyers – Impact of key factors 2023 and 2028
    • 5.3 Bargaining power of suppliers
      • Exhibit 25: Bargaining power of suppliers – Impact of key factors in 2023 and 2028
    • 5.4 Threat of new entrants
      • Exhibit 26: Threat of new entrants – Impact of key factors in 2023 and 2028
    • 5.5 Threat of substitutes
      • Exhibit 27: Threat of substitutes – Impact of key factors in 2023 and 2028
    • 5.6 Threat of rivalry
      • Exhibit 28: Threat of rivalry – Impact of key factors in 2023 and 2028
    • 5.7 Market condition
      • Exhibit 29: Chart on Market condition - Five forces 2023 and 2028

    6 Market Segmentation by End-user

    • 6.1 Market segments
      • Exhibit 30: Chart on End-user - Market share 2023-2028 (%)
      • Exhibit 31: Data Table on End-user - Market share 2023-2028 (%)
    • 6.2 Comparison by End-user
      • Exhibit 32: Chart on Comparison by End-user
      • Exhibit 33: Data Table on Comparison by End-user
    • 6.3 Government - Market size and forecast 2023-2028
      • Exhibit 34: Chart on Government - Market size and forecast 2023-2028 ($ million)
      • Exhibit 35: Data Table on Government - Market size and forecast 2023-2028 ($ million)
      • Exhibit 36: Chart on Government - Year-over-year growth 2023-2028 (%)
      • Exhibit 37: Data Table on Government - Year-over-year growth 2023-2028 (%)
    • 6.4 Manufacturing - Market size and forecast 2023-2028
      • Exhibit 38: Chart on Manufacturing - Market size and forecast 2023-2028 ($ million)
      • Exhibit 39: Data Table on Manufacturing - Market size and forecast 2023-2028 ($ million)
      • Exhibit 40: Chart on Manufacturing - Year-over-year growth 2023-2028 (%)
      • Exhibit 41: Data Table on Manufacturing - Year-over-year growth 2023-2028 (%)
    • 6.5 Transportation and logistics - Market size and forecast 2023-2028
      • Exhibit 42: Chart on Transportation and logistics - Market size and forecast 2023-2028 ($ million)
      • Exhibit 43: Data Table on Transportation and logistics - Market size and forecast 2023-2028 ($ million)
      • Exhibit 44: Chart on Transportation and logistics - Year-over-year growth 2023-2028 (%)
      • Exhibit 45: Data Table on Transportation and logistics - Year-over-year growth 2023-2028 (%)
    • 6.6 Education - Market size and forecast 2023-2028
      • Exhibit 46: Chart on Education - Market size and forecast 2023-2028 ($ million)
      • Exhibit 47: Data Table on Education - Market size and forecast 2023-2028 ($ million)
      • Exhibit 48: Chart on Education - Year-over-year growth 2023-2028 (%)
      • Exhibit 49: Data Table on Education - Year-over-year growth 2023-2028 (%)
    • 6.7 Retail and others - Market size and forecast 2023-2028
      • Exhibit 50: Chart on Retail and others - Market size and forecast 2023-2028 ($ million)
      • Exhibit 51: Data Table on Retail and others - Market size and forecast 2023-2028 ($ million)
      • Exhibit 52: Chart on Retail and others - Year-over-year growth 2023-2028 (%)
      • Exhibit 53: Data Table on Retail and others - Year-over-year growth 2023-2028 (%)
    • 6.8 Market opportunity by End-user
      • Exhibit 54: Market opportunity by End-user ($ million)
      • Exhibit 55: Data Table on Market opportunity by End-user ($ million)

    7 Market Segmentation by Type

    • 7.1 Market segments
      • Exhibit 56: Chart on Type - Market share 2023-2028 (%)
      • Exhibit 57: Data Table on Type - Market share 2023-2028 (%)
    • 7.2 Comparison by Type
      • Exhibit 58: Chart on Comparison by Type
      • Exhibit 59: Data Table on Comparison by Type
    • 7.3 Infrastructure - Market size and forecast 2023-2028
      • Exhibit 60: Chart on Infrastructure - Market size and forecast 2023-2028 ($ million)
      • Exhibit 61: Data Table on Infrastructure - Market size and forecast 2023-2028 ($ million)
      • Exhibit 62: Chart on Infrastructure - Year-over-year growth 2023-2028 (%)
      • Exhibit 63: Data Table on Infrastructure - Year-over-year growth 2023-2028 (%)
    • 7.4 Services - Market size and forecast 2023-2028
      • Exhibit 64: Chart on Services - Market size and forecast 2023-2028 ($ million)
      • Exhibit 65: Data Table on Services - Market size and forecast 2023-2028 ($ million)
      • Exhibit 66: Chart on Services - Year-over-year growth 2023-2028 (%)
      • Exhibit 67: Data Table on Services - Year-over-year growth 2023-2028 (%)
    • 7.5 Market opportunity by Type
      • Exhibit 68: Market opportunity by Type ($ million)
      • Exhibit 69: Data Table on Market opportunity by Type ($ million)

    8 Customer Landscape

    • 8.1 Customer landscape overview
      • Exhibit 70: Analysis of price sensitivity, lifecycle, customer purchase basket, adoption rates, and purchase criteria

    9 Geographic Landscape

    • 9.1 Geographic segmentation
      • Exhibit 71: Chart on Market share by geography 2023-2028 (%)
      • Exhibit 72: Data Table on Market share by geography 2023-2028 (%)
    • 9.2 Geographic comparison
      • Exhibit 73: Chart on Geographic comparison
      • Exhibit 74: Data Table on Geographic comparison
    • 9.3 North America - Market size and forecast 2023-2028
      • Exhibit 75: Chart on North America - Market size and forecast 2023-2028 ($ million)
      • Exhibit 76: Data Table on North America - Market size and forecast 2023-2028 ($ million)
      • Exhibit 77: Chart on North America - Year-over-year growth 2023-2028 (%)
      • Exhibit 78: Data Table on North America - Year-over-year growth 2023-2028 (%)
    • 9.4 APAC - Market size and forecast 2023-2028
      • Exhibit 79: Chart on APAC - Market size and forecast 2023-2028 ($ million)
      • Exhibit 80: Data Table on APAC - Market size and forecast 2023-2028 ($ million)
      • Exhibit 81: Chart on APAC - Year-over-year growth 2023-2028 (%)
      • Exhibit 82: Data Table on APAC - Year-over-year growth 2023-2028 (%)
    • 9.5 Europe - Market size and forecast 2023-2028
      • Exhibit 83: Chart on Europe - Market size and forecast 2023-2028 ($ million)
      • Exhibit 84: Data Table on Europe - Market size and forecast 2023-2028 ($ million)
      • Exhibit 85: Chart on Europe - Year-over-year growth 2023-2028 (%)
      • Exhibit 86: Data Table on Europe - Year-over-year growth 2023-2028 (%)
    • 9.6 South America - Market size and forecast 2023-2028
      • Exhibit 87: Chart on South America - Market size and forecast 2023-2028 ($ million)
      • Exhibit 88: Data Table on South America - Market size and forecast 2023-2028 ($ million)
      • Exhibit 89: Chart on South America - Year-over-year growth 2023-2028 (%)
      • Exhibit 90: Data Table on South America - Year-over-year growth 2023-2028 (%)
    • 9.7 Middle East and Africa - Market size and forecast 2023-2028
      • Exhibit 91: Chart on Middle East and Africa - Market size and forecast 2023-2028 ($ million)
      • Exhibit 92: Data Table on Middle East and Africa - Market size and forecast 2023-2028 ($ million)
      • Exhibit 93: Chart on Middle East and Africa - Year-over-year growth 2023-2028 (%)
      • Exhibit 94: Data Table on Middle East and Africa - Year-over-year growth 2023-2028 (%)
    • 9.8 US - Market size and forecast 2023-2028
      • Exhibit 95: Chart on US - Market size and forecast 2023-2028 ($ million)
      • Exhibit 96: Data Table on US - Market size and forecast 2023-2028 ($ million)
      • Exhibit 97: Chart on US - Year-over-year growth 2023-2028 (%)
      • Exhibit 98: Data Table on US - Year-over-year growth 2023-2028 (%)
    • 9.9 China - Market size and forecast 2023-2028
      • Exhibit 99: Chart on China - Market size and forecast 2023-2028 ($ million)
      • Exhibit 100: Data Table on China - Market size and forecast 2023-2028 ($ million)
      • Exhibit 101: Chart on China - Year-over-year growth 2023-2028 (%)
      • Exhibit 102: Data Table on China - Year-over-year growth 2023-2028 (%)
    • 9.10 UK - Market size and forecast 2023-2028
      • Exhibit 103: Chart on UK - Market size and forecast 2023-2028 ($ million)
      • Exhibit 104: Data Table on UK - Market size and forecast 2023-2028 ($ million)
      • Exhibit 105: Chart on UK - Year-over-year growth 2023-2028 (%)
      • Exhibit 106: Data Table on UK - Year-over-year growth 2023-2028 (%)
    • 9.11 Japan - Market size and forecast 2023-2028
      • Exhibit 107: Chart on Japan - Market size and forecast 2023-2028 ($ million)
      • Exhibit 108: Data Table on Japan - Market size and forecast 2023-2028 ($ million)
      • Exhibit 109: Chart on Japan - Year-over-year growth 2023-2028 (%)
      • Exhibit 110: Data Table on Japan - Year-over-year growth 2023-2028 (%)
    • 9.12 South Korea - Market size and forecast 2023-2028
      • Exhibit 111: Chart on South Korea - Market size and forecast 2023-2028 ($ million)
      • Exhibit 112: Data Table on South Korea - Market size and forecast 2023-2028 ($ million)
      • Exhibit 113: Chart on South Korea - Year-over-year growth 2023-2028 (%)
      • Exhibit 114: Data Table on South Korea - Year-over-year growth 2023-2028 (%)
    • 9.13 Market opportunity by geography
      • Exhibit 115: Market opportunity by geography ($ million)
      • Exhibit 116: Data Tables on Market opportunity by geography ($ million)

    10 Drivers, Challenges, and Trends

    • 10.1 Market drivers
      • 10.2 Market challenges
        • 10.3 Impact of drivers and challenges
          • Exhibit 117: Impact of drivers and challenges in 2023 and 2028
        • 10.4 Market trends

          11 Vendor Landscape

          • 11.1 Overview
            • 11.2 Vendor landscape
              • Exhibit 118: Overview on Criticality of inputs and Factors of differentiation
            • 11.3 Landscape disruption
              • Exhibit 119: Overview on factors of disruption
            • 11.4 Industry risks
              • Exhibit 120: Impact of key risks on business

            12 Vendor Analysis

            • 12.1 Vendors covered
              • Exhibit 121: Vendors covered
            • 12.2 Market positioning of vendors
              • Exhibit 122: Matrix on vendor position and classification
            • 12.3 Advanced RF Technologies Inc.
              • Exhibit 123: Advanced RF Technologies Inc. - Overview
              • Exhibit 124: Advanced RF Technologies Inc. - Product / Service
              • Exhibit 125: Advanced RF Technologies Inc. - Key offerings
            • 12.4 Airspan Networks Holdings Inc.
              • Exhibit 126: Airspan Networks Holdings Inc. - Overview
              • Exhibit 127: Airspan Networks Holdings Inc. - Product / Service
              • Exhibit 128: Airspan Networks Holdings Inc. - Key news
              • Exhibit 129: Airspan Networks Holdings Inc. - Key offerings
            • 12.5 American Tower Corp.
              • Exhibit 130: American Tower Corp. - Overview
              • Exhibit 131: American Tower Corp. - Business segments
              • Exhibit 132: American Tower Corp. - Key offerings
              • Exhibit 133: American Tower Corp. - Segment focus
            • 12.6 AT and T Inc.
              • Exhibit 134: AT and T Inc. - Overview
              • Exhibit 135: AT and T Inc. - Business segments
              • Exhibit 136: AT and T Inc. - Key news
              • Exhibit 137: AT and T Inc. - Key offerings
              • Exhibit 138: AT and T Inc. - Segment focus
            • 12.7 BTI wireless
              • Exhibit 139: BTI wireless - Overview
              • Exhibit 140: BTI wireless - Product / Service
              • Exhibit 141: BTI wireless - Key offerings
            • 12.8 CommScope Holding Co. Inc.
              • Exhibit 142: CommScope Holding Co. Inc. - Overview
              • Exhibit 143: CommScope Holding Co. Inc. - Business segments
              • Exhibit 144: CommScope Holding Co. Inc. - Key news
              • Exhibit 145: CommScope Holding Co. Inc. - Key offerings
              • Exhibit 146: CommScope Holding Co. Inc. - Segment focus
            • 12.9 Corning Inc.
              • Exhibit 147: Corning Inc. - Overview
              • Exhibit 148: Corning Inc. - Business segments
              • Exhibit 149: Corning Inc. - Key news
              • Exhibit 150: Corning Inc. - Key offerings
              • Exhibit 151: Corning Inc. - Segment focus
            • 12.10 Dali Wireless
              • Exhibit 152: Dali Wireless - Overview
              • Exhibit 153: Dali Wireless - Product / Service
              • Exhibit 154: Dali Wireless - Key offerings
            • 12.11 Huawei Technologies Co. Ltd.
              • Exhibit 155: Huawei Technologies Co. Ltd. - Overview
              • Exhibit 156: Huawei Technologies Co. Ltd. - Business segments
              • Exhibit 157: Huawei Technologies Co. Ltd. - Key news
              • Exhibit 158: Huawei Technologies Co. Ltd. - Key offerings
              • Exhibit 159: Huawei Technologies Co. Ltd. - Segment focus
            • 12.12 NEC Corporation
              • Exhibit 160: NEC Corporation - Overview
              • Exhibit 161: NEC Corporation - Business segments
              • Exhibit 162: NEC Corporation - Key news
              • Exhibit 163: NEC Corporation - Key offerings
              • Exhibit 164: NEC Corporation - Segment focus
            • 12.13 PBE Group
              • Exhibit 165: PBE Group - Overview
              • Exhibit 166: PBE Group - Product / Service
              • Exhibit 167: PBE Group - Key offerings
            • 12.14 Samsung Electronics Co. Ltd.
              • Exhibit 168: Samsung Electronics Co. Ltd. - Overview
              • Exhibit 169: Samsung Electronics Co. Ltd. - Business segments
              • Exhibit 170: Samsung Electronics Co. Ltd. - Key news
              • Exhibit 171: Samsung Electronics Co. Ltd. - Key offerings
              • Exhibit 172: Samsung Electronics Co. Ltd. - Segment focus
            • 12.15 SOLiD
              • Exhibit 173: SOLiD - Overview
              • Exhibit 174: SOLiD - Product / Service
              • Exhibit 175: SOLiD - Key offerings
            • 12.16 Telefonaktiebolaget LM Ericsson
              • Exhibit 176: Telefonaktiebolaget LM Ericsson - Overview
              • Exhibit 177: Telefonaktiebolaget LM Ericsson - Business segments
              • Exhibit 178: Telefonaktiebolaget LM Ericsson - Key news
              • Exhibit 179: Telefonaktiebolaget LM Ericsson - Key offerings
              • Exhibit 180: Telefonaktiebolaget LM Ericsson - Segment focus
            • 12.17 Wilson Electronics
              • Exhibit 181: Wilson Electronics - Overview
              • Exhibit 182: Wilson Electronics - Product / Service
              • Exhibit 183: Wilson Electronics - Key news
              • Exhibit 184: Wilson Electronics - Key offerings

            13 Appendix

            • 13.1 Scope of the report
              • 13.2 Inclusions and exclusions checklist
                • Exhibit 185: Inclusions checklist
                • Exhibit 186: Exclusions checklist
              • 13.3 Currency conversion rates for US$
                • Exhibit 187: Currency conversion rates for US$
              • 13.4 Research methodology
                • Exhibit 188: Research methodology
                • Exhibit 189: Validation techniques employed for market sizing
                • Exhibit 190: Information sources
              • 13.5 List of abbreviations
                • Exhibit 191: List of abbreviations

              Research Methodology

              Technavio presents a detailed picture of the market by way of study, synthesis, and summation of data from multiple sources. The analysts have presented the various facets of the market with a particular focus on identifying the key industry influencers. The data thus presented is comprehensive, reliable, and the result of extensive research, both primary and secondary.

              INFORMATION SOURCES

              Primary sources

              • Manufacturers and suppliers
              • Channel partners
              • Industry experts
              • Strategic decision makers

              Secondary sources

              • Industry journals and periodicals
              • Government data
              • Financial reports of key industry players
              • Historical data
              • Press releases

              DATA ANALYSIS

              Data Synthesis

              • Collation of data
              • Estimation of key figures
              • Analysis of derived insights

              Data Validation

              • Triangulation with data models
              • Reference against proprietary databases
              • Corroboration with industry experts

              REPORT WRITING

              Qualitative

              • Market drivers
              • Market challenges
              • Market trends
              • Five forces analysis

              Quantitative

              • Market size and forecast
              • Market segmentation
              • Geographical insights
              • Competitive landscape

              Interested in this report?

              Get your sample now to see our research methodology and insights!

              Download Now

              Frequently Asked Questions

              In Building Wireless market growth will increase by $ 7399.75 mn during 2024-2028.

              The In Building Wireless market is expected to grow at a CAGR of 8.8% during 2024-2028.

              In Building Wireless market is segmented by End-user( Government, Manufacturing, Transportation and logistics, Education, Retail and others) Type( Infrastructure, Services)

              Advanced RF Technologies Inc., Airspan Networks Holdings Inc., American Tower Corp., AT and T Inc., BTI wireless, Cellnex Telecom SA, CommScope Holding Co. Inc., Corning Inc., Dali Wireless, Huawei Technologies Co. Ltd., LBA Group Inc., MILLER ELECTRIC CO., NEC Corporation, PBE Group, Samsung Electronics Co. Ltd., SOLiD, Telefonaktiebolaget LM Ericsson, Uniinfo Telecom Services Ltd., Verizon Communications Inc., WESCO International Inc., Wilson Electronics are a few of the key vendors in the In Building Wireless market.

              North America will register the highest growth rate of 34% among the other regions. Therefore, the In Building Wireless market in North America is expected to garner significant business opportunities for the vendors during the forecast period.

              US, China, Japan, South Korea, UK

              • Increase in demand for in building wireless due to growth of smart citiesMany countries have started focusing on the development of smart cities. A smart city is an urban development plan in which a citys infrastructure has been equipped with various information and communication technologies. The stakeholders in a city is the driving factor this market.
              • including local departments information systems is the driving factor this market.
              • libraries is the driving factor this market.
              • schools is the driving factor this market.
              • transportation systems is the driving factor this market.
              • power plants is the driving factor this market.
              • transportation systems is the driving factor this market.
              • water supply networks is the driving factor this market.
              • and waste management is the driving factor this market.
              • are integrated with multiple information and technology solutions. Several factors is the driving factor this market.
              • such as the adoption of smart grid technologies is the driving factor this market.
              • the use of IT to improve traffic is the driving factor this market.
              • the number of Wi-Fi points enabled is the driving factor this market.
              • and even the mobile application landscape is the driving factor this market.
              • are considered to designate a city as a smart city. These applications include traffic and city information apps. Communication is the central focus of a smart city. The development of IT and related infrastructure forms the backbone of this digital ecosystem. Communications include internet services is the driving factor this market.
              • landline services is the driving factor this market.
              • and wireless services is the driving factor this market.
              • which are available for commercial use. These smart cities are also adopting the use of distributed antenna systems to provide effective and enhanced communication even to isolated spots or bad coverage areas. A distributed antenna system is a part of in building wireless solutions that help to counter certain issues is the driving factor this market.
              • such as low signal coverage or congestion arising when the number of users exceeds the bandwidth of a single cellular system. Distributed antenna systems are connected through fiber-optic cables. With the emergence of smart cities is the driving factor this market.
              • the adoption of in building wireless solutions is increasing owing to the need for advanced connected infrastructure is the driving factor this market.
              • which is expected to increase and hence drive the growth of the global in building wireless market during the forecast period. is the driving factor this market.

              The In Building Wireless market vendors should focus on grabbing business opportunities from the Government segment as it accounted for the largest market share in the base year.
              RIA - Research AI Assistant
              Ask RIA