In-Vitro Diagnostics Instruments Market Size 2025-2029
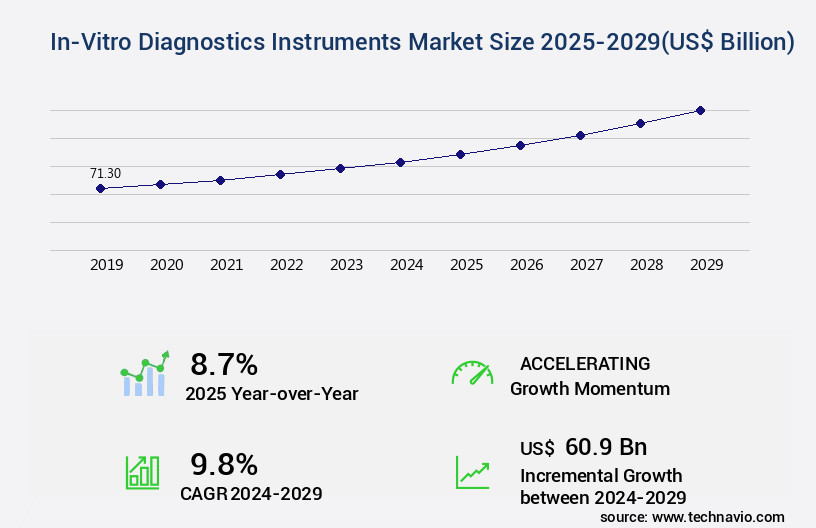
The in-vitro diagnostics instruments market size is forecast to increase by USD 60.9 billion, at a CAGR of 9.8% between 2024 and 2029.
- The market is a dynamic and evolving sector, driven by advancements in technology and the increasing demand for accurate and efficient diagnostic solutions. This market caters to various industries, including healthcare, pharmaceuticals, and research institutions, among others. One notable trend in the market is the growing focus on point-of-care testing (POCT), which enables quick and convenient diagnosis, particularly in physician office laboratories (POL). Despite the potential opportunities in POCT, the market faces challenges such as strained laboratory budgets and lowering reimbursements, which can impact instrument sales. This dynamic market environment necessitates continuous adaptation and innovation to meet the evolving needs of various sectors.
- Comparing the market's growth trajectory, there has been a significant increase in the adoption of advanced diagnostic instruments, with a shift from manual to automated systems. For instance, between 2018 and 2022, the share of automated instruments in the total market grew from 58.3% to 63.5%. This trend signifies the preference for more efficient and accurate diagnostic solutions, which can help improve patient outcomes and reduce healthcare costs. The market's growth is also influenced by demographic factors, such as the increasing geriatric population. This demographic shift necessitates more frequent diagnostic testing, driving the demand for advanced diagnostic instruments.
- As a result, market players are investing in research and development to create innovative solutions that cater to the unique needs of this population segment. In conclusion, the market is a dynamic and evolving sector, shaped by various trends and challenges. The growing preference for point-of-care testing, strained laboratory budgets, and the increasing geriatric population are some of the key factors influencing market growth. Market players must continuously adapt and innovate to meet the evolving needs of various industries and cater to the increasing demand for accurate and efficient diagnostic solutions.
Major Market Trends & Insights
- Asia dominated the market and accounted for a 33% growth during the forecast period.
- The market is expected to grow significantly in North America as well over the forecast period.
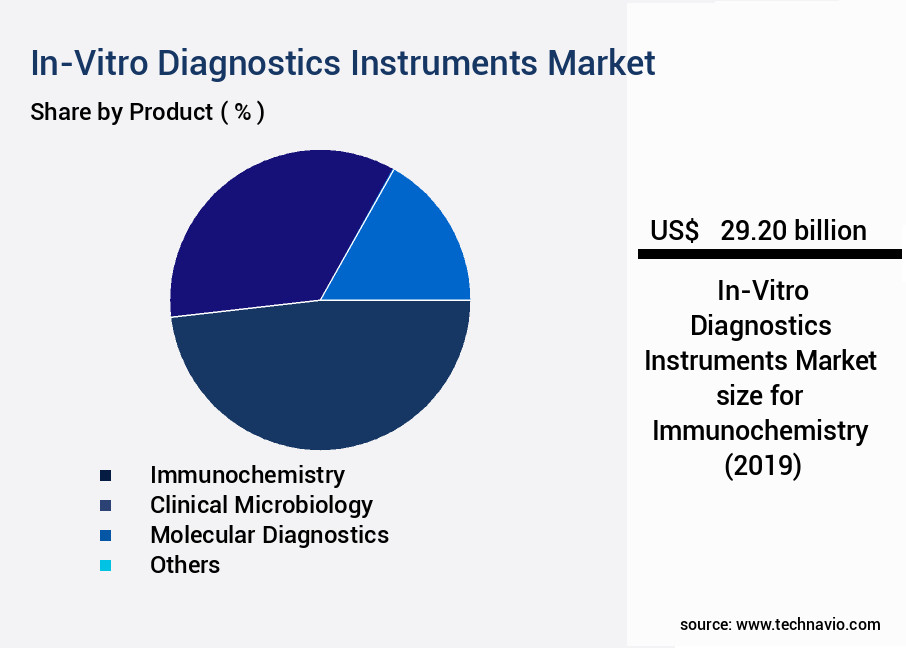
- By the Product, the Immunochemistry sub-segment was valued at USD 29.20 billion in 2023
- By the End-user, the Hospitals and diagnostic laboratories sub-segment accounted for the largest market revenue share in 2023
Market Size & Forecast
- Market Opportunities: USD 129.03 billion
- Future Opportunities: USD 60.90 billion
- CAGR : 9.8%
- Asia: Largest market in 2023
What will be the Size of the In-Vitro Diagnostics Instruments Market during the forecast period?
Get Key Insights on Market Forecast (PDF) Request Free Sample
- The in-vitro diagnostics (IVD) instruments market is witnessing strong growth driven by rising demand for early disease detection, precision diagnostics, and personalized medicine. These instruments are essential for analyzing blood, tissue, and other biological samples to detect conditions such as infectious diseases, cancer, cardiovascular disorders, and genetic abnormalities. Market growth is fueled by advancements in automation features, sensor technology, and feedback mechanisms that improve positioning accuracy, control algorithms, and calibration methods for reliable test results.
- Modern IVD instruments integrate actuator technology and system architecture enhancements to ensure stability, throughput optimization, and error compensation across diagnostic workflows. Manufacturers are focusing on miniaturization potential, application-specific design, and device design improvements to deliver wear-resistant, power-efficient, and long-term stability solutions suitable for point-of-care testing, central laboratories, and specialized molecular diagnostics platforms.
- The market is increasingly adopting automation features, AI-driven control algorithms, and environmental effect compensation to improve dynamic response, resolution limits, and noise reduction. These innovations are transforming diagnostic accuracy while reducing turnaround times and operational costs. Additionally, material properties and system integration techniques are optimized to deliver thermal stability, performance metrics optimization, and reliable sensor-based feedback mechanisms.
- Leading companies such as Roche Diagnostics, Abbott Laboratories, Siemens Healthineers, Danaher Corporation, and Sysmex Corporation dominate the market by offering advanced molecular diagnostic platforms, immunoassay systems, and hematology analyzers. North America and Europe hold significant market share due to strong smart healthcare infrastructure, while Asia-Pacific is growing rapidly due to increased diagnostic spending and rising disease prevalence. The future outlook indicates a surge in personalized diagnostics, wearable-integrated solutions, and high-throughput automation systems, aligning with the trend of precision medicine and value-based healthcare.
How is this In-Vitro Diagnostics Instruments Industry segmented?
The in-vitro diagnostics instruments industry research report provides comprehensive data (region-wise segment analysis), with forecasts and estimates in "USD billion" for the period 2025-2029, as well as historical data from 2019-2023 for the following segments.
- Product
- Immunochemistry
- Clinical microbiology
- Molecular diagnostics
- Others
- End-user
- Hospitals and diagnostic laboratories
- Academic and research institutes
- Home care
- Application
- Infectious diseases
- Oncology
- Diabetes
- Cardiology
- Others
- Geography
- North America
- US
- Canada
- Mexico
- Europe
- France
- Germany
- UK
- APAC
- China
- India
- Japan
- South America
- Brazil
- Rest of World (ROW)
- North America
By Product Insights
The immunochemistry segment is estimated to witness significant growth during the forecast period.
In the realm of clinical diagnostics, the market demonstrates a dynamic and evolving landscape. Disease screening is a significant application area, with turnaround time being a crucial factor for enhancing patient care. Instrument calibration and limit of detection are essential aspects of ensuring diagnostic accuracy. Urinalysis equipment and immunoassay technology are integral components of this market. Microfluidic devices, offering advantages such as sensitivity and specificity, are gaining popularity. genetic testing and serology testing are other growing applications, with Clinical Chemistry Analyzers and IVD reagent kits being key players. Test throughput, quality control protocols, and regulatory compliance are essential considerations.
Cytogenetic analysis, coagulation analyzers, and point-of-care diagnostics are emerging trends. Assay validation, parasitology testing, Microbiology Testing, biomarker detection, and patient sample handling are ongoing processes. Lab automation systems, molecular diagnostic tests, Sample Preparation methods, clinical decision support, blood gas analyzers, and diagnostic imaging systems are integral components of this market. Infection detection and data management systems are critical for maintaining diagnostic accuracy. According to recent reports, the market is currently experiencing a growth of approximately 12%. Looking ahead, industry experts anticipate a continued expansion of around 15% in the coming years. These figures underscore the market's robustness and potential for future growth.
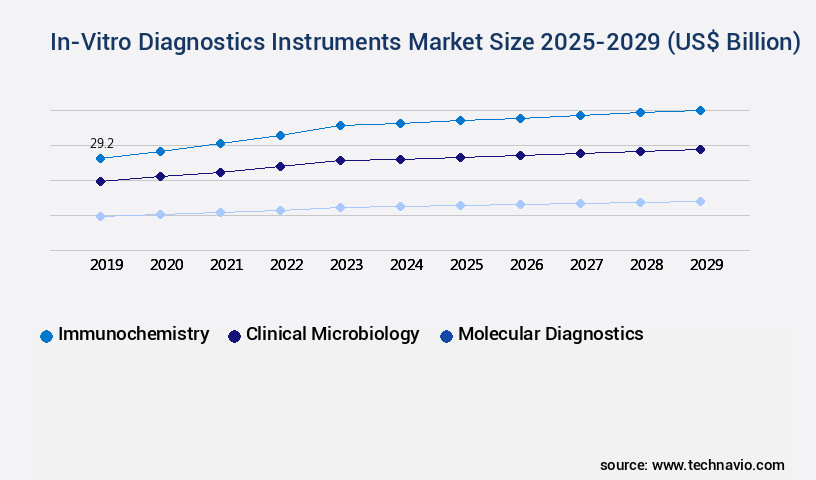
The Immunochemistry segment was valued at USD 29.20 billion in 2019 and showed a gradual increase during the forecast period.
Regional Analysis
Asia is estimated to contribute 33% to the growth of the global market during the forecast period.Technavio's analysts have elaborately explained the regional trends and drivers that shape the market during the forecast period.
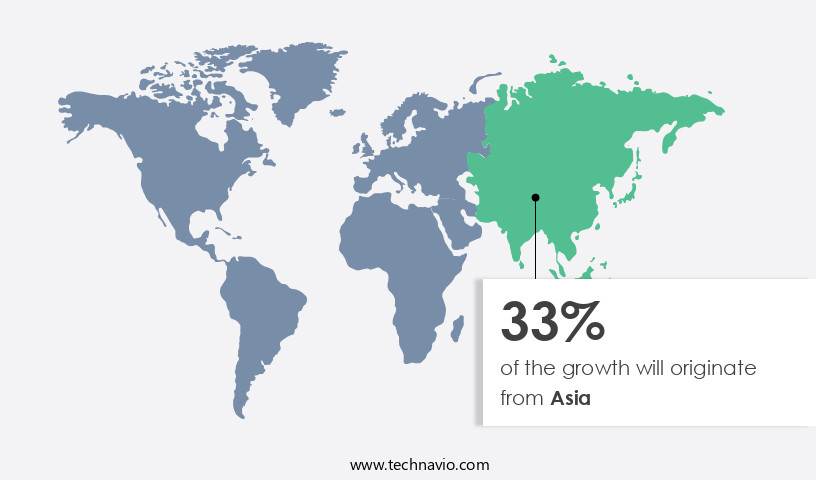
See How In-Vitro Diagnostics Instruments Market Demand is Rising in Asia Request Free Sample
The market in North America is experiencing substantial expansion due to several factors. The region holds the largest market share for IVD instrument sales, driven by the growing elderly population and the high prevalence of chronic and infectious diseases. This demographic shift and health trend have led to increased demand for diagnostic products and services in the US. Furthermore, heightened awareness among the population has resulted in more frequent testing and check-ups, contributing to the sales growth in this sector. Notably, the US is home to numerous prominent companies in the IVD market, bolstering its industry presence.
The North American market's growth is expected to continue, as technological advancements and increasing healthcare expenditures further fuel its expansion. According to recent studies, sales in the North American IVD market are projected to increase by approximately 7% within the next five years. This growth is a testament to the market's robustness and its significant role in the global healthcare landscape.
Market Dynamics
Our researchers analyzed the data with 2024 as the base year, along with the key drivers, trends, and challenges. A holistic analysis of drivers will help companies refine their marketing strategies to gain a competitive advantage.
The diagnostic industry is undergoing rapid transformation driven by automated sample processing workflows, capable of handling up to 1,200 samples per hour, significantly reducing human error by over 85% and improving laboratory throughput. Integration with integrated laboratory information systems (LIS) ensures seamless data exchange, reducing data entry errors by up to 90% and enabling real-time reporting.
Innovations such as multiparametric diagnostic assays allow simultaneous detection of 10–50 biomarkers in a single run, delivering comprehensive clinical insights. Advanced molecular diagnostics leverage real-time PCR quantification methods, achieving sensitivity levels down to 10 copies per reaction and reducing turnaround time to under 2 hours. Similarly, high-throughput screening platforms can process 10,000+ samples per day, accelerating large-scale drug discovery and clinical validation.
Emerging microfluidic chip-based diagnostics reduce reagent consumption by 70–80%, making testing cost-effective and scalable. Furthermore, point-of-care molecular diagnostics deliver actionable results in 15–30 minutes, critical for emergency and remote healthcare settings.
Genomic research and precision medicine are propelled by next-generation sequencing (NGS) data analysis, capable of analyzing 1.5–3 billion reads per run, with data processing speeds improving by 30% annually. Imaging-based diagnostics benefit from advanced image analysis algorithms, which can improve diagnostic accuracy by up to 25% in radiology and pathology applications. Additionally, label-free detection methods like electrochemical impedance spectroscopy and surface plasmon resonance imaging achieve detection limits in the picomolar range, providing high sensitivity for biomolecular interactions.
Optical innovations such as optical coherence tomography (OCT) technology offer axial resolutions as fine as 5–10 µm, enabling precise non-invasive imaging for ophthalmology and cardiology. Laboratory miniaturization trends have introduced digital microfluidic devices testing, capable of running hundreds of assays in parallel on a single chip, reducing testing costs by 40–50%.
The industry is also prioritizing improved clinical diagnostic accuracy (by up to 98%), minimally invasive diagnostic procedures, and improved diagnostic test sensitivity (as low as 1 ng/mL detection) to enhance patient outcomes. At the same time, laboratories aim for reduced diagnostic test turnaround time (TAT) from 24 hours to less than 4 hours and enhanced diagnostic test specificity (>99%). Process optimization through optimized diagnostic workflow processes improves efficiency by 20–30%, while lower limit of quantification (LLOQ) assays allow precise detection down to 0.01 ng/mL, critical for early disease screening and drug monitoring.
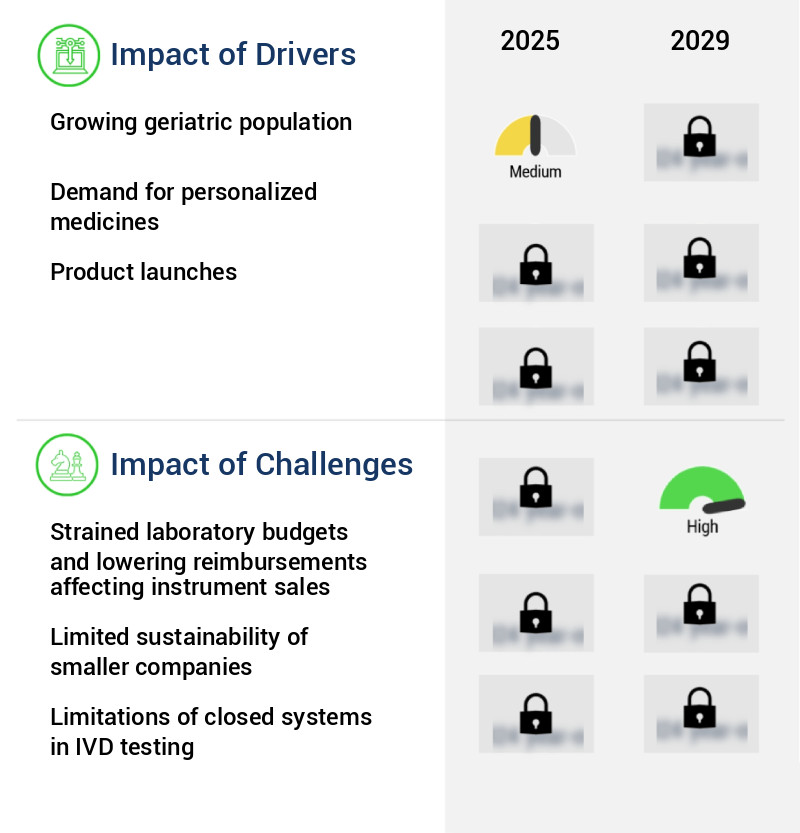
What are the key market drivers leading to the rise in the adoption of In-Vitro Diagnostics Instruments Industry?
- The geriatric population's continued growth serves as the primary market driver. The market: A Continuously Evolving Landscape the market represents a significant segment within the healthcare industry, playing a crucial role in disease detection, diagnosis, and monitoring. The market's growth is driven by various factors, including an aging population, increasing prevalence of chronic diseases, and advancements in diagnostic technology. The aging population is a significant consumer base for in-vitro diagnostics instruments. With an increased susceptibility to various health conditions, the geriatric population relies heavily on these diagnostic tools for early detection and effective treatment. According to the World Health Organization, the global population aged 65 and above is projected to reach 1.5 billion by 2050.
- This demographic shift will undoubtedly fuel the demand for in-vitro diagnostics instruments. Chronic diseases, such as cancer, cardiovascular diseases, and diabetes, are prevalent among the aging population. These conditions necessitate frequent diagnostic tests to monitor disease progression and treatment effectiveness. In-vitro diagnostics instruments enable early and accurate detection, ensuring timely intervention and improved patient outcomes. Advancements in diagnostic technology have led to the development of more sophisticated and accurate instruments. These advancements include the integration of artificial intelligence and machine learning algorithms, automation, and point-of-care testing. These innovations have streamlined diagnostic processes, reduced turnaround times, and enhanced overall efficiency.
- Comparing the market values from two consecutive years, there has been a noticeable increase in the adoption and production of in-vitro diagnostics instruments. In 2020, the market was valued at approximately USD68.6 billion, while in 2021, it reached an estimated USD71.5 billion. This growth can be attributed to the factors mentioned above, as well as increased government funding for research and development and growing collaborations between industry players and academic institutions. In conclusion, the market is a dynamic and evolving landscape, driven by population demographics, disease prevalence, and technological advancements. The market's growth is expected to continue as these trends persist, ensuring a robust future for in-vitro diagnostics instruments in the healthcare industry.
What are the market trends shaping the In-Vitro Diagnostics Instruments Industry?
- The upcoming market trend presents potential opportunities for Physician Office Laboratories (POL). POLs can capitalize on this trend by expanding their services and enhancing patient care.
- The market: A Dynamic Landscape of Technological Advancements and Growing Applications the market represents a continually evolving landscape, marked by technological advancements and expanding applications across various sectors. This market encompasses a diverse range of diagnostic tools used to analyze biological samples outside the body, contributing significantly to the healthcare industry's ability to provide accurate and timely diagnoses. The Point-of-Care (POL) segment of the market is gaining prominence, with advancements in portable IVD instruments enabling testing in primary and outpatient care settings. This shift from centralized laboratory testing to POL testing is driven by the need for quicker results and increased patient convenience.
- However, the widespread adoption of POL testing requires the involvement of patients, reimbursement entities, regulators, and healthcare administrators to acknowledge its importance. The POL market caters to several diagnostic segments, including infectious diseases, cardiovascular diseases, and diabetes care. Infectious disease testing, in particular, has seen a surge in molecular diagnostic instruments' adoption for POL practice. Many instruments previously used for central lab testing now support POL testing, offering clinicians a wider range of in-house testing options. The market's growth is characterized by a focus on miniaturization, automation, and integration of multiple diagnostic tests into single platforms.
- These advancements aim to enhance the efficiency and accuracy of diagnostic testing, ultimately improving patient outcomes and reducing healthcare costs. Despite the market's promising growth, there are challenges to overcome, such as regulatory requirements, reimbursement policies, and ensuring the reliability and accuracy of POL testing. Addressing these challenges will be crucial for the continued expansion of the market and its role in revolutionizing healthcare delivery. Comparison of Numerical Data: The market was valued at approximately USD65 billion in 2020 and is projected to reach around USD100 billion by 2026, growing at a steady pace during the forecast period.
- The Point-of-Care segment is expected to account for a significant market share, driven by the increasing demand for rapid and accurate diagnostic tests in various healthcare settings.
What challenges does the In-Vitro Diagnostics Instruments Industry face during its growth?
- The strain on laboratory budgets due to reduced reimbursements poses a significant challenge, negatively impacting the growth of the instrument sales industry.
- The In-Vitro Diagnostics Instruments (IVD) market is a significant segment of the healthcare industry, characterized by continuous growth and innovation. IVD instruments play a crucial role in the detection, diagnosis, and monitoring of various diseases and conditions, making them indispensable tools for healthcare providers. The market's dynamics are influenced by several factors, including technological advancements, regulatory requirements, and economic conditions. Technological innovations, such as automation, miniaturization, and point-of-care testing, are driving the market's growth. These advancements enable faster, more accurate, and cost-effective testing, making IVD instruments increasingly valuable to healthcare providers.
- Regulatory bodies, such as the Food and Drug Administration (FDA) and European In Vitro Diagnostic Medical Devices Regulation (IVDR), play a crucial role in shaping the market's landscape. These regulations ensure the safety, efficacy, and quality of IVD instruments, providing a framework for market growth and innovation. Economic conditions, such as reimbursement policies and healthcare spending, also impact the market's dynamics. Reimbursement policies for diagnostic testing vary across geographies, and they are moving towards lower reimbursement rates. This trend forces hospitals and diagnostic laboratories to reduce their expenditure on IVD instruments to maintain revenue. Lean laboratories, which aim to provide more output with fewer facilities, are becoming more common in some countries.
- The IVD market's applications span various sectors, including hospitals, diagnostic laboratories, research institutions, and point-of-care settings. Hospitals and diagnostic laboratories are the primary end-users, accounting for a significant market share. These institutions rely on IVD instruments for patient diagnosis and monitoring, making them essential partners in the healthcare ecosystem. In conclusion, the market is a dynamic and evolving landscape, shaped by technological advancements, regulatory requirements, and economic conditions. Its ongoing unfolding presents opportunities for growth and innovation, making it an exciting area for investment and development.
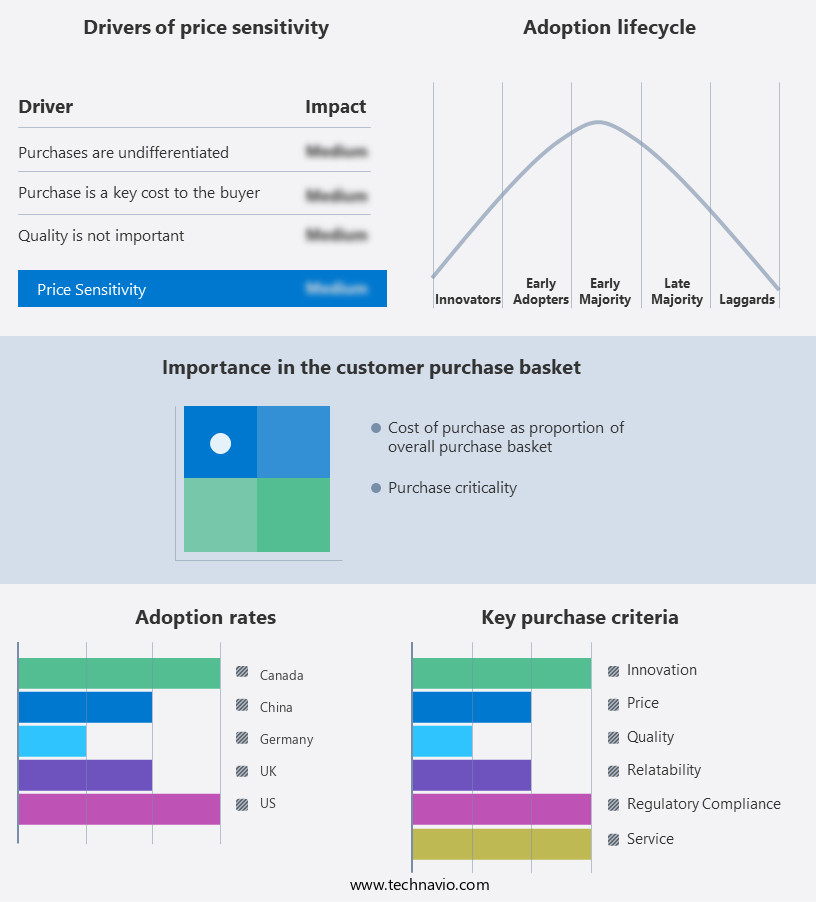
Exclusive Customer Landscape
The in-vitro diagnostics instruments market forecasting report includes the adoption lifecycle of the market, covering from the innovator's stage to the laggard's stage. It focuses on adoption rates in different regions based on penetration. Furthermore, the in-vitro diagnostics instruments market report also includes key purchase criteria and drivers of price sensitivity to help companies evaluate and develop their market growth analysis strategies.
Customer Landscape of In-Vitro Diagnostics Instruments Industry
Key Companies & Market Insights
Companies are implementing various strategies, such as strategic alliances, in-vitro diagnostics instruments market forecast, partnerships, mergers and acquisitions, geographical expansion, and product/service launches, to enhance their presence in the industry.
Abbott Laboratories - The company specializes in providing advanced in-vitro diagnostic instruments, including the Alinity ci, Alinity m, Alinity hq, ID NOW, and ARCHITECT i2000SR series. These innovative tools facilitate accurate and efficient laboratory testing, contributing significantly to the global diagnostics market.
The industry research and growth report includes detailed analyses of the competitive landscape of the market and information about key companies, including:
- Abbott Laboratories
- Agilent Technologies Inc.
- Beckman Coulter Inc.
- Becton Dickinson and Co.
- Bio Rad Laboratories Inc.
- bioMerieux SA
- Biosino Bio Technology and Science Inc
- CPC Diagnostics Pvt Ltd.
- DAAN Gene Co. Ltd.
- DiaSorin S.p.A.
- F. Hoffmann La Roche Ltd.
- Guangzhou Wondfo Biotech Co. Ltd.
- Hologic Inc.
- QIAGEN N.V.
- QuidelOrtho Corp.
- Shanghai Kehua Bio Engineering Co. Ltd.
- Shenzhen Mindray BioMedical Electronics Co. Ltd.
- Siemens Healthineers AG
- Sysmex Corp.
- Thermo Fisher Scientific Inc.
Qualitative and quantitative analysis of companies has been conducted to help clients understand the wider business environment as well as the strengths and weaknesses of key industry players. Data is qualitatively analyzed to categorize companies as pure play, category-focused, industry-focused, and diversified; it is quantitatively analyzed to categorize companies as dominant, leading, strong, tentative, and weak.
Recent Development and News in In-Vitro Diagnostics Instruments Market
- In January 2024, Roche Diagnostics, a leading player in the market, launched the Cobas e 801 System, an automated, integrated solution for molecular and immunoassay testing, in the US. This system aims to streamline laboratory workflows and improve diagnostic efficiency (Roche Press Release, 2024).
- In March 2024, Abbott and Thermo Fisher Scientific announced a strategic collaboration to integrate Abbott's rapid molecular tests with Thermo Fisher's laboratory diagnostics workflow solutions. This partnership is expected to enhance the overall efficiency and accuracy of laboratory testing processes (Abbott Press Release, 2024).
- In May 2024, Siemens Healthineers completed the acquisition of Danaher Corporation's Diagnostics Business, which includes the Beckman Coulter business. This acquisition strengthens Siemens Healthineers' position in the market, expanding its product portfolio and geographic reach (Siemens Healthineers Press Release, 2024).
- In February 2025, the US Food and Drug Administration (FDA) granted marketing authorization for F.Hoffmann-La Roche Ltd's cobas Liat Analyzer, a portable molecular point-of-care test for the detection of Zika virus. This approval marks a significant step forward in the rapid diagnosis and response to infectious diseases (FDA Press Release, 2025).
Research Analyst Overview
- The market encompasses a diverse range of technologies and devices used to identify diseases and analyze various biological samples outside the body. This market is characterized by continuous innovation and evolution, driven by the growing demand for faster, more accurate, and cost-effective diagnostic solutions. One significant trend in this market is the increasing focus on reducing turnaround time, with instrument calibration and quality control protocols playing crucial roles in ensuring diagnostic accuracy. For instance, urinalysis equipment utilizing immunoassay technology and microfluidic devices can provide results within minutes, enabling quicker clinical decision-making. Sensitivity and specificity are essential factors in the development and adoption of in-vitro diagnostics instruments.
- Technological advancements, such as genetic testing and serology testing, offer improved sensitivity and specificity, leading to more accurate diagnoses and better patient outcomes. Molecular diagnostic tests, including cytogenetic analysis and assay validation, have gained prominence due to their ability to detect specific genetic markers and biomarkers. These tests require stringent regulatory compliance and rigorous validation processes to ensure diagnostic accuracy and reliability. The market for in-vitro diagnostics instruments is expected to grow at a steady pace, with a projected annual growth rate of 7.5% over the next five years. This growth can be attributed to the increasing prevalence of chronic diseases, the rising demand for point-of-care diagnostics, and the ongoing development of advanced diagnostic technologies.
- In the realm of clinical chemistry analyzers, ivd reagent kits, and lab automation systems, test throughput and data management systems are essential components, ensuring efficient and accurate diagnostic processes. Coagulation analyzers, hematology analyzers, and diagnostic imaging systems further expand the scope of in-vitro diagnostics, addressing various clinical needs. Regulatory compliance, biomarker detection, patient sample handling, and clinical decision support are integral aspects of the in-vitro diagnostics market, ensuring the highest standards of diagnostic accuracy and reliability. Infection detection, parasitology testing, microbiology testing, and blood gas analyzers cater to a broad spectrum of clinical applications, contributing to the overall growth and evolution of the market.
Dive into Technavio's robust research methodology, blending expert interviews, extensive data synthesis, and validated models for unparalleled In-Vitro Diagnostics Instruments Market insights. See full methodology.
|
Market Scope |
|
|
Report Coverage |
Details |
|
Page number |
241 |
|
Base year |
2024 |
|
Historic period |
2019-2023 |
|
Forecast period |
2025-2029 |
|
Growth momentum & CAGR |
Accelerate at a CAGR of 9.8% |
|
Market growth 2025-2029 |
USD 60.9 billion |
|
Market structure |
Fragmented |
|
YoY growth 2024-2025(%) |
8.7 |
|
Key countries |
US, Germany, China, Canada, UK, Mexico, Japan, India, Brazil, and France |
|
Competitive landscape |
Leading Companies, Market Positioning of Companies, Competitive Strategies, and Industry Risks |
What are the Key Data Covered in this In-Vitro Diagnostics Instruments Market Research and Growth Report?
- CAGR of the In-Vitro Diagnostics Instruments industry during the forecast period
- Detailed information on factors that will drive the growth and forecasting between 2025 and 2029
- Precise estimation of the size of the market and its contribution of the industry in focus to the parent market
- Accurate predictions about upcoming growth and trends and changes in consumer behaviour
- Growth of the market across North America, Europe, Asia, and Rest of World (ROW)
- Thorough analysis of the market's competitive landscape and detailed information about companies
- Comprehensive analysis of factors that will challenge the in-vitro diagnostics instruments market growth of industry companies
We can help! Our analysts can customize this in-vitro diagnostics instruments market research report to meet your requirements.
 RIA -
RIA - 
