
Industrial Anti-Scaling Chemicals Market Size 2025-2029
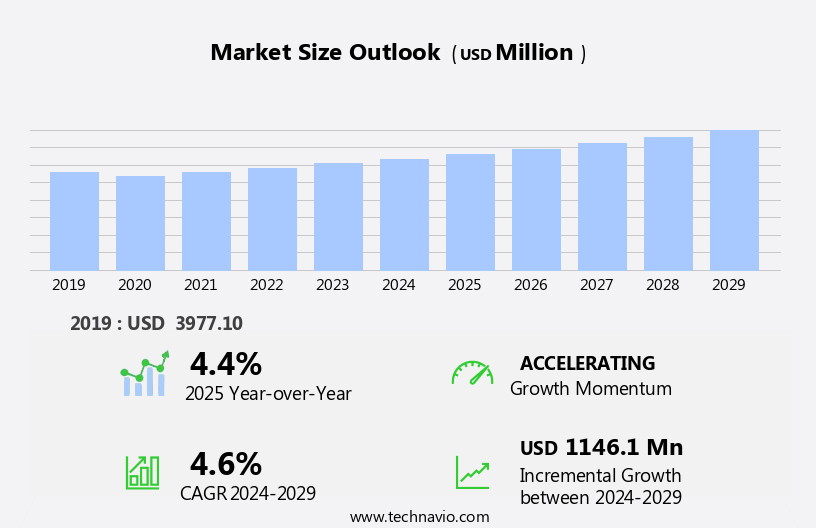
The industrial anti-scaling chemicals market size is forecast to increase by USD 1.15 billion, at a CAGR of 4.6% between 2024 and 2029.
- The market is driven by the surging demand from the energy and water treatment industries, where the need to prevent mineral build-up and maintain optimal operational efficiency is paramount. The global industrialization trend further fuels market growth, as expanding manufacturing sectors in developing economies increase their reliance on these chemicals for production processes. Additionally, advancements in the utilization of coal tar for chemical production are becoming noteworthy, with efforts focused on extracting value from this resource in more environmentally friendly ways. However, the market faces challenges due to regulatory issues surrounding the use of industrial anti-scaling chemicals. Strict regulations and compliance requirements can pose significant hurdles for market participants, necessitating investments in research and development to ensure adherence and maintain a competitive edge. Companies must navigate these challenges while also addressing the evolving needs of the energy and water treatment industries, which are continuously seeking more effective and eco-friendly anti-scaling solutions.
- By staying informed of regulatory changes and investing in innovative technologies, market players can capitalize on opportunities and effectively mitigate challenges, ultimately shaping the strategic landscape of the market. The use of advanced analytics is driving efficiency in water treatment processes, enabling companies to optimize their operations and reduce costs.
What will be the Size of the Industrial Anti-Scaling Chemicals Market during the forecast period?
Explore in-depth regional segment analysis with market size data - historical 2019-2023 and forecasts 2025-2029 - in the full report.
Request Free Sample
- The market encompasses a range of solutions designed to mitigate the negative effects of scaling and corrosion in industrial processes. One significant trend shaping this market is the adoption of Green Chemistry principles, which prioritize the use of biodegradable chemicals and minimize waste generation. Employee training is crucial in ensuring effective use of these chemicals, as improper handling can lead to risks for both public health and occupational safety. Water quality standards continue to evolve, driving the demand for advanced water treatment technologies. Electrochemical methods and chelant technology are increasingly being employed to maintain water quality and prevent biofouling. Thus, such benefits will increase the demand for municipal water and wastewater treatment chemicals, which are crucial for enhancing water quality and ensuring efficient wastewater management processes.
- Water conservation is another critical concern, with sustainable water management practices gaining traction. Water security is a pressing issue, with water scarcity posing a significant challenge for industries. Remote monitoring and online analyzers enable real-time tracking of water quality indices, including turbidity, conductivity, total dissolved solids, and corrosion levels. Automatic control systems and process optimization further enhance water management efficiency. Chemical risk assessment is essential in ensuring the safe use of anti-scaling chemicals. Data analytics plays a pivotal role in identifying potential risks and optimizing processes. Emergency response plans are also crucial in mitigating the impact of any incidents.
- Industrial hygiene and water safety are interconnected, with proper handling and disposal of chemicals essential to maintaining a safe working environment. Water footprint reduction is a growing priority, with industries seeking to minimize their water usage and improve water security. The market is dynamic, with ongoing advancements in technology and evolving regulations shaping market trends. Companies must remain agile and responsive to these changes to remain competitive.
How is this Industrial Anti-Scaling Chemicals Industry segmented?
The industrial anti-scaling chemicals industry research report provides comprehensive data (region-wise segment analysis), with forecasts and estimates in "USD million" for the period 2025-2029, as well as historical data from 2019-2023 for the following segments.
- End-user
- Oil gas and mining
- Wastewater treatment
- Food and beverage
- Pulp and paper
- Others
- Type
- Polymer-based
- Phosphonate-based
- Application
- Cooling water systems
- Boiler systems
- Heat exchangers
- Membrane processes
- Others
- Geography
- North America
- US
- Canada
- Europe
- France
- Germany
- UK
- APAC
- Australia
- China
- India
- Japan
- South Korea
- Rest of World (ROW)
- North America
By End-user Insights
The oil gas and mining segment is estimated to witness significant growth during the forecast period. In industrial water systems, scaling is a persistent issue that negatively impacts various sectors, particularly oil, gas, and mining. Scale formation in these processes can lead to decreased production efficiency, restricted flow rates, and equipment failure. To mitigate these challenges, anti-scaling chemicals have gained significant importance. These chemicals prevent the accumulation and deposition of scales, ensuring smooth transportation of hydrocarbons. In power generation, boiler water treatment is crucial to maintain heat transfer efficiency and prevent corrosion. Anti-scaling agents are essential components of boiler water treatment, as they inhibit the formation of scales caused by mineral deposits. Water reuse in industries, such as food & beverage and pulp & paper, requires stringent water quality standards.
Membrane technology and ion exchange are common methods used to achieve these standards. However, scaling can affect the performance of these systems, necessitating the use of anti-scaling chemicals. Water chemistry monitoring is vital in various industrial applications, including cooling water treatment and wastewater treatment. Calcium carbonate scaling is a common issue in cooling water systems, which can be prevented using anti-scaling chemicals. In wastewater treatment, phosphate treatment and alkalinity control are essential processes. However, scaling can hinder the effectiveness of these treatments, necessitating the use of anti-scaling agents. Regulatory standards, such as EPA regulations, dictate the use of chemical feed systems and chemical handling practices in industries.
Safety data sheets are essential in ensuring the safe use and storage of water treatment chemicals. Corrosion inhibitors and magnesium salts are commonly used in various industrial applications, but their effectiveness can be compromised by scaling. Anti-scaling chemicals are also crucial in industrial water systems for cost optimization and operational efficiency. Fouling prevention, heat transfer efficiency, and water quality analysis are all factors that can be significantly impacted by scaling. Dosing pumps and injection systems are used to deliver anti-scaling chemicals, ensuring the continued smooth operation of industrial water systems.
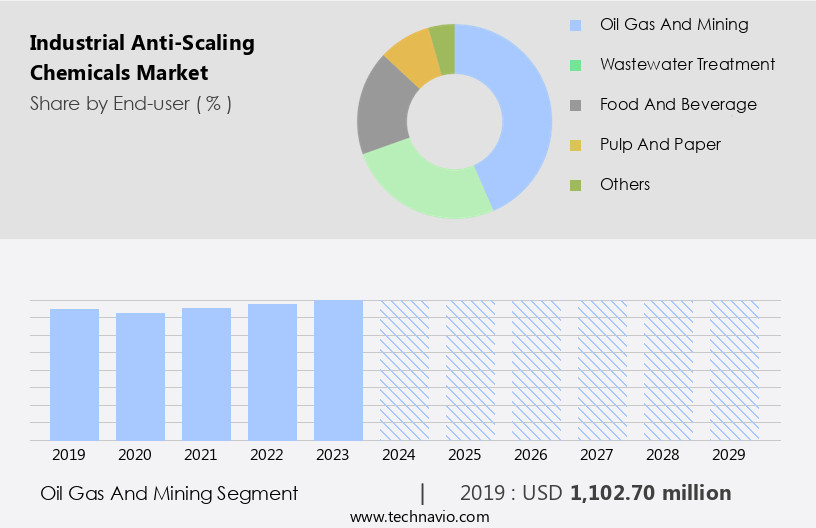
The oil and gas mining segment was valued at USD 1.1 billion in 2019 and showed a gradual increase during the forecast period.
Regional Analysis
APAC is estimated to contribute 39% to the growth of the global market during the forecast period. Technavio's analysts have elaborately explained the regional trends and drivers that shape the market during the forecast period.
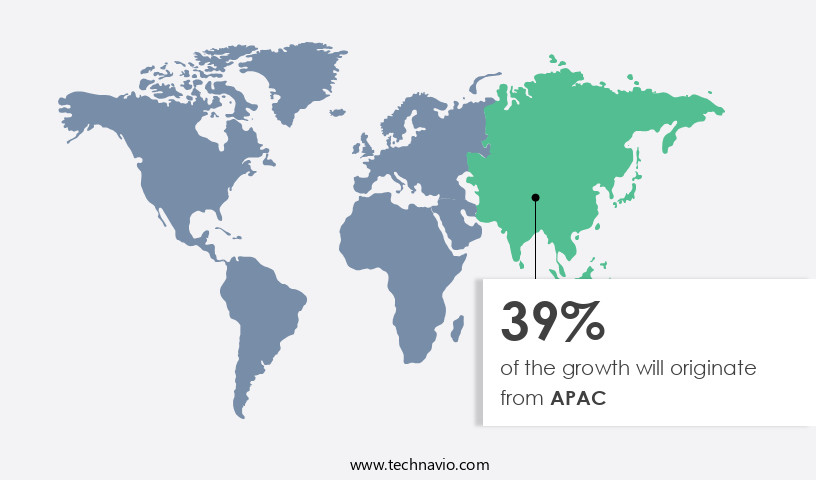
The industrial ant-scaling chemicals market is experiencing significant growth, particularly in the Asia Pacific (APAC) region. APAC is currently the largest geographical segment, accounting for a substantial market share in 2024. This trend is expected to continue due to the increased consumption of industrial ant-scaling chemicals in emerging economies, such as China and India, where rapid industrialization is underway. Industries like power generation, metal and mineral mining, paper and pulp, and food and beverages are driving the demand for purified or processed water, thereby fueling the market's expansion. In APAC, water softening, boiler water treatment, and water chemistry monitoring are crucial applications for industrial ant-scaling chemicals.
Membrane technology, such as reverse osmosis, plays a vital role in water reuse, while calcium carbonate and phosphate treatment are essential for wastewater treatment. Power generation relies on anti-scaling agents to maintain heat transfer efficiency and prevent scale formation. Safety data sheets are crucial for handling water treatment chemicals, ensuring operational efficiency and environmental compliance. Corrosion inhibitors and magnesium salts are vital for asset management and preventing corrosion in industrial water systems. Alkalinity control and pH adjustment are essential for maintaining water quality in various industries, including pulp and paper and food and beverage. Regulatory standards, such as EPA regulations, dictate the use of chemical feed systems and dosing pumps for accurate and efficient chemical injection. Ion exchange and oil & gas industries also utilize industrial ant-scaling chemicals for cost optimization and fouling prevention.
Market Dynamics
Our researchers analyzed the data with 2024 as the base year, along with the key drivers, trends, and challenges. A holistic analysis of drivers will help companies refine their marketing strategies to gain a competitive advantage.
What are the Industrial Anti-Scaling Chemicals market drivers leading to the rise in the adoption of Industry?
- The energy and water treatment industry's increasing demand for antiscalants serves as the primary market driver. The market caters to the demand for sustainable water treatment solutions in various industries. These chemicals are essential for water treatment plants, where they are employed in boiler water treatment, cooling water treatment, wastewater treatment, and reverse osmosis (RO) membrane systems. By using anti-scaling chemicals, water treatment facilities can improve their performance and safeguard their high-value infrastructure from the damaging effects of scale formation and biofouling. Anti-scaling chemicals are eutrophication-free, making them an environmentally friendly choice. They are also compatible with all major RO systems used in water treatment processes. These chemicals offer chemical pre-treatment that mitigates the scaling and fouling tendencies of inorganic salts, metal hydroxides, and colloids in water treatment systems.
- Water chemistry monitoring is crucial in ensuring the effectiveness of anti-scaling chemicals. Safety data sheets are essential resources for handling these chemicals, providing essential information on their safe use, storage, and disposal. Companies in the market offer a range of anti-scaling chemicals, including water softening agents, organic polymers, and calcium carbonate-based products. By providing effective solutions for scale and fouling control, these chemicals ensure the optimal performance of water treatment facilities and contribute to the sustainable management of water resources.
What are the Industrial Anti-Scaling Chemicals market trends shaping the Industry?
- Global industrialization is undergoing significant growth, making it a prominent market trend in the professional business world. The increasing automation and production efficiency brought about by this trend are shaping the global economy. The market is experiencing significant growth due to the expansion of various industries worldwide. Countries like China, India, Mexico, the UAE, Malaysia, Saudi Arabia, and Thailand are investing in and growing their manufacturing and industrial sectors, leading to an increased demand for industrial anti-scaling chemicals. These chemicals are essential for mitigating scaling issues in water-intensive industrial processes, ensuring operational efficiency and asset management. Power generation, food & beverage, and pharmaceuticals are major industries that rely heavily on water and require effective anti-scaling solutions. EPA regulations mandate the use of these chemicals to prevent corrosion and maintain water quality.
- Industrial anti-scaling chemicals come in various forms, including phosphate treatment, chemical feed systems, and corrosion inhibitors. They help control water hardness and microbiological growth, ensuring the smooth operation of industrial facilities. The use of industrial anti-scaling chemicals is not limited to industrial applications alone. They are also employed in chemical storage tanks to prevent corrosion and ensure the longevity of the tanks. The market is poised for growth due to the increasing demand for efficient and effective water management solutions in various industries. The market dynamics are driven by the expansion of industries, regulatory requirements, and the need for asset management and operational efficiency.
How does Industrial Anti-Scaling Chemicals market face challenges during its growth?
- The growth of the industry is significantly impacted by the regulatory challenges surrounding the use of industrial anti-scaling chemicals due to associated issues. Industrial anti-scaling chemicals play a crucial role in various industries, particularly in pulp and paper, chemical handling, and industrial water systems. These chemicals help prevent scale formation, ensuring heat transfer efficiency and maintaining alkalinity control. However, their use comes with regulatory considerations due to potential health, safety, and environmental impacts. Government agencies and regulatory bodies enforce regulations to ensure safe handling, storage, and disposal of industrial anti-scaling chemicals. For instance, the Environmental Protection Agency (EPA) regulates the discharge of industrial chemicals into water bodies, enforcing effluent limits and other requirements to minimize environmental impact. Additionally, the Stockholm Convention on Persistent Organic Pollutants (POPs) restricts the production and use of certain chemicals, including some anti-scaling agents containing POPs.
- These regulations aim to eliminate or reduce the release of chemicals that pose serious threats to human health and the environment. Compliance with these regulations is essential for industrial facilities using anti-scaling chemicals. Injection systems are commonly used for chemical application, ensuring precise dosing and efficient use. Proper implementation of these systems and adherence to regulatory standards contribute to improved operational efficiency, cost savings, and a reduced environmental footprint. The use of industrial anti-scaling chemicals necessitates a thorough understanding of regulatory requirements and best practices for chemical handling. Adherence to these standards not only ensures workplace safety and environmental responsibility but also contributes to overall operational efficiency and cost savings.
Exclusive Customer Landscape
The industrial anti-scaling chemicals market forecasting report includes the adoption lifecycle of the market, covering from the innovator's stage to the laggard's stage. It focuses on adoption rates in different regions based on penetration. Furthermore, the industrial anti-scaling chemicals market report also includes key purchase criteria and drivers of price sensitivity to help companies evaluate and develop their market growth analysis strategies.
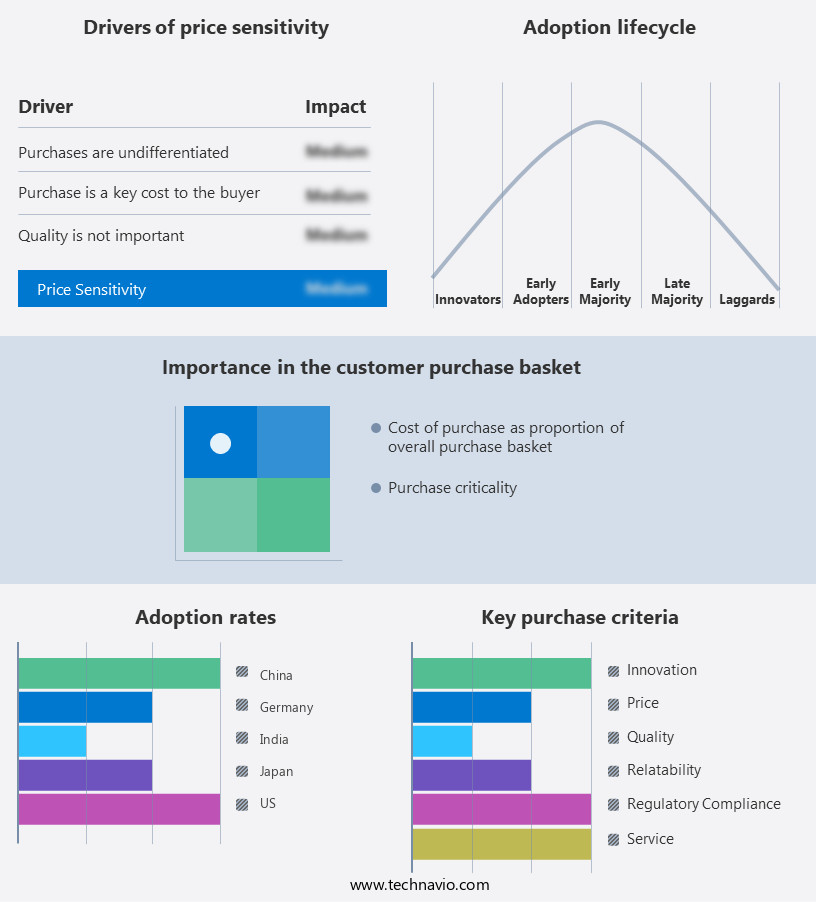
Customer Landscape
Key Companies & Market Insights
Companies are implementing various strategies, such as strategic alliances, industrial anti-scaling chemicals market forecast, partnerships, mergers and acquisitions, geographical expansion, and product/service launches, to enhance their presence in the industry.
Accepta Ltd. - The company specializes in providing industrial-grade descaling and cleaning solutions, encompassing Sulphamic Acid Descaler and Cleaner with Filming Inhibitor, Hydrochloric Acid Descaler with Film Forming Inhibitor and Indicator.
The industry research and growth report includes detailed analyses of the competitive landscape of the market and information about key companies, including:
- Accepta Ltd.
- Akzo Nobel NV
- American Water Chemicals Inc.
- Ashland Inc.
- BASF SE
- Chemtex Speciality Ltd.
- Clariant International Ltd.
- DuPont de Nemours Inc.
- Ecolab Inc.
- H2O Innovation Inc.
- Innovative Chemical Technologies Inc.
- Italmatch Chemicals Spa
- Kemira Oyj
- Kurita Water Industries Ltd.
- L K CHEMICALS
- Solenis
- Solvay SA
- The Dow Chemical Co.
- Toray Industries Inc.
- Water Treatment Products Ltd.
Qualitative and quantitative analysis of companies has been conducted to help clients understand the wider business environment as well as the strengths and weaknesses of key industry players. Data is qualitatively analyzed to categorize companies as pure play, category-focused, industry-focused, and diversified; it is quantitatively analyzed to categorize companies as dominant, leading, strong, tentative, and weak.
Recent Development and News in Industrial Anti-Scaling Chemicals Market
- In February 2024, DuPont Water Solutions, a leading provider of water treatment chemicals, announced the launch of its new line of industrial anti-scaling chemicals, known as Invista ScaleGuard. This innovative product line is designed to prevent the formation of mineral scales in industrial water systems, thereby improving operational efficiency and reducing downtime for customers (DuPont Press Release, 2024).
- In May 2024, BASF Corporation and Lanxess AG, two major players in the chemical industry, entered into a strategic partnership to jointly develop and market anti-scaling chemicals. This collaboration aims to leverage their combined expertise and resources to offer more comprehensive solutions to customers in various industries (BASF Press Release, 2024).
- In January 2025, Nalco Company, an Ecolab business, announced a significant investment of USD 100 million in its manufacturing facility in Texas, USA, to expand its production capacity for industrial water treatment chemicals, including anti-scaling agents. This expansion is expected to strengthen Nalco's market position and better serve its growing customer base (Ecolab Press Release, 2025).
- In March 2025, the European Chemicals Agency (ECHA) approved the use of a new anti-scaling agent, 3-Methyl-2-oxazolidinone, for industrial applications. This approval marks a significant milestone in the development of more sustainable and eco-friendly anti-scaling chemicals, as this agent has a lower environmental impact compared to traditional alternatives (ECHA Press Release, 2025).
Research Analyst Overview
The market continues to evolve, driven by the dynamic nature of water chemistry and the diverse requirements of various sectors. Asset management and EPA regulations play a significant role in shaping market trends, with chemical feed systems and power generation being key applications. Anti-scaling agents, such as phosphates and organic polymers, are essential for preventing calcium carbonate and magnesium salt deposits in industrial water systems. Power generation relies on efficient heat transfer and the prevention of fouling, which necessitates the use of corrosion inhibitors and alkalinity control. In the food & beverage sector, water hardness and microbiological control are crucial, while in water reuse applications, membrane technology and reverse osmosis systems require specialized chemical treatments.
Chemical storage tanks and dosing pumps are integral components of the industrial water treatment landscape, ensuring cost optimization and regulatory compliance. Safety data sheets and environmental considerations are increasingly important, with a focus on operational efficiency and reducing waste. The pulp & paper industry, oil & gas sector, and cooling water treatment all present unique challenges and opportunities for anti-scaling chemical solutions. Regulatory standards and cost optimization continue to shape market dynamics, with ongoing research and development in ion exchange and scale prevention technologies. In the evolving landscape of industrial water treatment, the continuous optimization of water quality analysis and the integration of advanced technologies will remain key drivers for market growth.
Dive into Technavio's strong research methodology, blending expert interviews, extensive data synthesis, and validated models for unparalleled Industrial Anti-Scaling Chemicals Market insights. See full methodology.
|
Market Scope |
|
|
Report Coverage |
Details |
|
Page number |
237 |
|
Base year |
2024 |
|
Historic period |
2019-2023 |
|
Forecast period |
2025-2029 |
|
Growth momentum & CAGR |
Accelerate at a CAGR of 4.6% |
|
Market growth 2025-2029 |
USD 1.15 billion |
|
Market structure |
Fragmented |
|
YoY growth 2024-2025(%) |
4.4 |
|
Key countries |
US, China, Japan, India, Germany, Canada, UK, South Korea, Australia, and France |
|
Competitive landscape |
Leading Companies, Market Positioning of Companies, Competitive Strategies, and Industry Risks |
What are the Key Data Covered in this Industrial Anti-Scaling Chemicals Market Research and Growth Report?
- CAGR of the Industrial Anti-Scaling Chemicals industry during the forecast period
- Detailed information on factors that will drive the growth and forecasting between 2025 and 2029
- Precise estimation of the size of the market and its contribution of the industry in focus to the parent market
- Accurate predictions about upcoming growth and trends and changes in consumer behaviour
- Growth of the market across APAC, North America, Europe, Middle East and Africa, and South America
- Thorough analysis of the market's competitive landscape and detailed information about companies
- Comprehensive analysis of factors that will challenge the industrial anti-scaling chemicals market growth of industry companies
We can help! Our analysts can customize this industrial anti-scaling chemicals market research report to meet your requirements.
 RIA -
RIA - 
