Industrial Digital Twin For Heavy Industries Market Analysis, Size, and Forecast 2026-2030: North America (US, Canada, and Mexico), Europe (Germany, UK, and France), APAC (China, Japan, and India), Middle East and Africa (Saudi Arabia, UAE, and South Africa), South America (Brazil and Argentina), and Rest of World (ROW)

Industrial Digital Twin For Heavy Industries Market Analysis, Size, and Forecast 2026-2030:
North America (US, Canada, and Mexico), Europe (Germany, UK, and France), APAC (China, Japan, and India), Middle East and Africa (Saudi Arabia, UAE, and South Africa), South America (Brazil and Argentina), and Rest of World (ROW)

Published: Apr 2026 310 Pages SKU: IRTNTR81392

Market Overview at a Glance

$2.84 B
Market Opportunity
18.2%
CAGR 2025 - 2030
29.8%
North America Growth
$984.2 Mn
Software segment 2024

Industrial Digital Twin For Heavy Industries Market Size 2026-2030

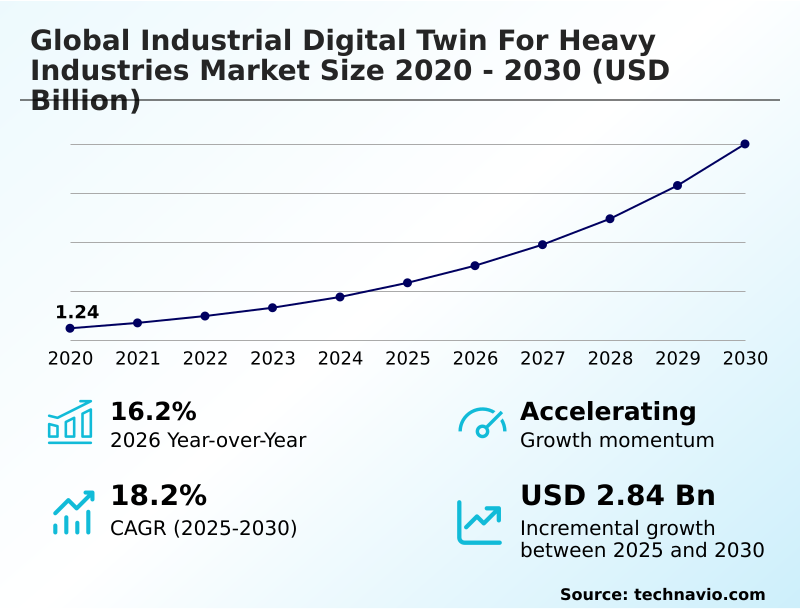
The industrial digital twin for heavy industries market size is valued to increase by USD 2.84 billion, at a CAGR of 18.2% from 2025 to 2030. Optimization of asset lifecycle and predictive maintenance will drive the industrial digital twin for heavy industries market.

Major Market Trends & Insights

  • North America dominated the market and accounted for a 29.8% growth during the forecast period.
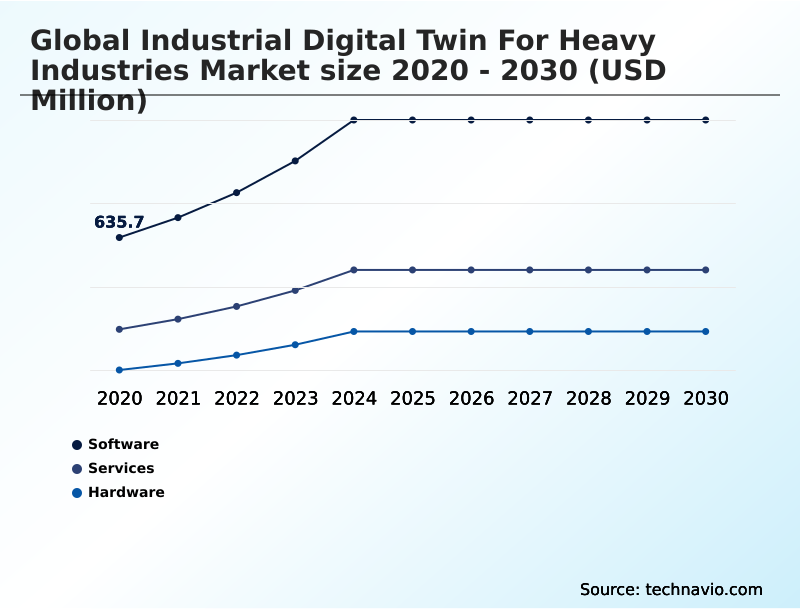
  • By Component - Software segment was valued at USD 984.2 million in 2024
  • By Deployment - Cloud segment accounted for the largest market revenue share in 2024

Market Size & Forecast

  • Market Opportunities: USD 3.77 billion
  • Market Future Opportunities: USD 2.84 billion
  • CAGR from 2025 to 2030 : 18.2%

Market Summary

  • The industrial digital twin for heavy industries market is defined by the convergence of advanced simulation, real-time data analytics, and the industrial internet of things (iiot). This technology enables the creation of a high-fidelity virtual replica of physical assets and processes, facilitating asset lifecycle optimization and a shift toward predictive maintenance models.
  • Key drivers include the need for enhanced operational efficiency and sustainability, with physics-based simulation allowing for heavy machinery simulation and virtual testing that minimizes physical prototyping. For instance, a heavy equipment manufacturer can simulate wear and tear under various operational scenarios to refine designs using generative design algorithms before production, improving durability and reducing material waste.
  • digital thread integration connects disparate data from plm and erp systems, providing a holistic view of operations. However, the market faces challenges related to data interoperability standards and the high cost of retrofitting legacy equipment with high-precision sensors.
  • The integration of machine learning algorithms is also pivotal, enabling predictive and prescriptive analytics that transform factory floor data collection from a monitoring activity into a strategic asset for manufacturing process optimization and informed decision-making across the enterprise.

What will be the Size of the Industrial Digital Twin For Heavy Industries Market during the forecast period?

Get Key Insights on Market Forecast (PDF) Request Free Sample

How is the Industrial Digital Twin For Heavy Industries Market Segmented?

The industrial digital twin for heavy industries industry research report provides comprehensive data (region-wise segment analysis), with forecasts and estimates in "USD million" for the period 2026-2030, as well as historical data from 2020-2024 for the following segments.

  • Component
    • Software
    • Services
    • Hardware
  • Deployment
    • Cloud
    • On-premises
    • Hybrid
  • Sector
    • Downstream
    • Upstream
    • Midstream
  • Geography
    • North America
      • US
      • Canada
      • Mexico
    • Europe
      • Germany
      • UK
      • France
    • APAC
      • China
      • Japan
      • India
    • Middle East and Africa
      • Saudi Arabia
      • UAE
      • South Africa
    • South America
      • Brazil
      • Argentina
    • Rest of World (ROW)

By Component Insights

The software segment is estimated to witness significant growth during the forecast period.

The software segment is the core of the market, providing the architecture for creating a high-fidelity virtual replica of physical assets. This involves physics-based simulation for industrial equipment virtual testing and heavy machinery simulation.

Through real-time data synchronization from factory floor data collection, these platforms enable advanced predictive and prescriptive analytics and robust asset performance management (apm).

The integration of generative design algorithms drives manufacturing process optimization and informs predictive maintenance models across the entire asset lifecycle optimization.

The industrial internet of things (iiot) underpins this ecosystem, with some platforms demonstrating over 20% improvement in fault detection accuracy, shifting maintenance from scheduled intervals to condition-based interventions.

Request Free Sample

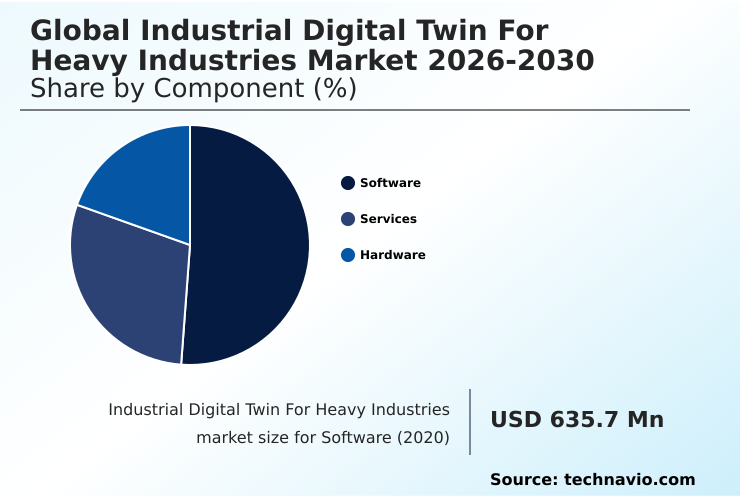
The Software segment was valued at USD 984.2 million in 2024 and showed a gradual increase during the forecast period.

Request Free Sample

Regional Analysis

North America is estimated to contribute 29.8% to the growth of the global market during the forecast period.Technavio’s analysts have elaborately explained the regional trends and drivers that shape the market during the forecast period.

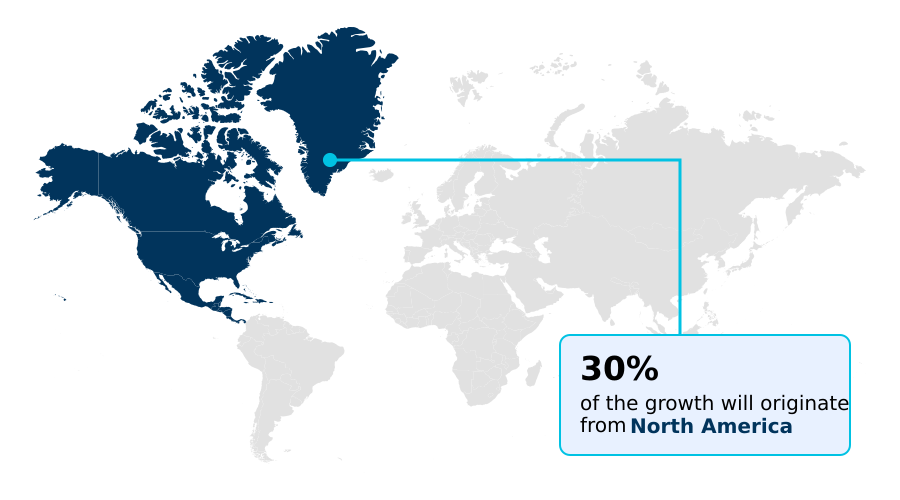
See How Industrial Digital Twin For Heavy Industries Market Demand is Rising in North America Request Free Sample

Regional adoption patterns vary, with APAC demonstrating the most rapid expansion, outpacing North America by nearly two percentage points. In regions with significant natural resource sectors, the focus is on raw material extraction simulation and midstream asset management.

Technologies enabling subsea wellhead monitoring and the analysis of geological surveys and high-frequency vibration data are critical. These specialized applications support heavy equipment remanufacturing and facilitate remote expert assistance, driving the creation of autonomous industrial environments.

A key goal is achieving a holistic industrial ecosystem view with cross-platform interoperability, supported by digital product passports for blast furnace optimization and sustainability tracking. Enhanced virtual reality training simulations are also being deployed to improve safety.
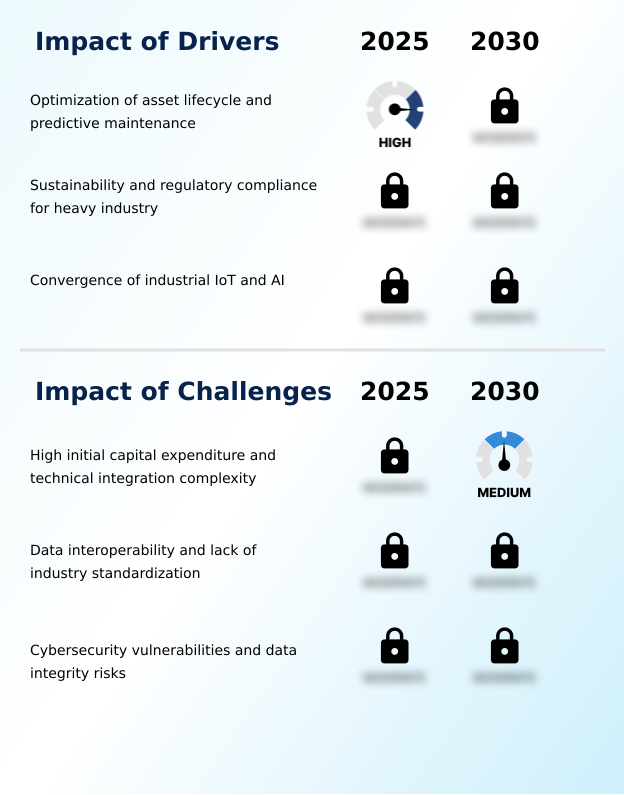
Market Dynamics

Our researchers analyzed the data with 2025 as the base year, along with the key drivers, trends, and challenges. A holistic analysis of drivers will help companies refine their marketing strategies to gain a competitive advantage.

  • The strategic implementation of digital twin technology is becoming a competitive differentiator in heavy industries. Digital twin for predictive maintenance in mining is a prime example, where real-time asset health monitoring significantly reduces costly equipment failures. Similarly, manufacturers are using virtual commissioning to reduce factory downtime, validating production line changes in a virtual space before physical implementation.
  • The role of generative ai in industrial design and simulation is expanding, enabling engineers to rapidly iterate and optimize complex components. However, addressing cybersecurity risks in ot and it convergence remains a critical priority for maintaining operational integrity. The industrial metaverse for remote collaboration and training is another key area, allowing global teams to interact with virtual assets.
  • The benefits of 5g for real-time digital twins are substantial, providing the low latency needed for precise control loops. The extension of the digital thread for sustainability and circular economy is now essential for ESG reporting, supported by digital product passports that track embodied carbon.
  • Overcoming interoperability challenges in multi-vendor digital twin ecosystems is vital for creating a unified operational view. Enterprises are focusing on optimizing asset lifecycle with digital twin technology, leveraging edge computing applications for heavy manufacturing twins to process data locally. The decision between cloud vs on-premise digital twin deployment models often depends on security and latency needs.
  • These systems are also crucial for improving supply chain visibility with digital twins and demonstrating the role of digital twins in achieving esg goals, which now influences investment decisions more than ever. Digital twin applications in aerospace manufacturing continue to set industry benchmarks.
  • Overall, the market is focused on real-time monitoring of heavy industrial assets, leveraging physics-based simulation for structural integrity testing, and exploring natural language interfaces for digital twin interaction to democratize data access. How digital twins enhance worker safety training in virtual environments is also a major focus, demonstrating benefits that extend beyond pure operational efficiency.

What are the key market drivers leading to the rise in the adoption of Industrial Digital Twin For Heavy Industries Industry?

  • The need to optimize asset lifecycles and implement predictive maintenance models is a primary driver for market growth in heavy industries.

  • Market expansion is driven by the need for low-latency data transmission, supported by 5g-enabled digital platforms that enable real-time asset monitoring. The installation of high-precision sensors is fundamental, yet achieving data integrity and governance requires overcoming legacy system integration challenges.
  • A major driver is the integration of product lifecycle management (plm) and enterprise resource planning (erp) systems to create a unified data model. This enhances industrial control systems security and supports initiatives like circular economy tracking.
  • Adherence to data interoperability standards is crucial, as it allows for precise energy consumption modeling and helps reduce operational risks by up to 25% through better system-wide visibility.

What are the market trends shaping the Industrial Digital Twin For Heavy Industries Industry?

  • The integration of generative AI and natural language interfaces is emerging as a significant trend. This transforms digital twins from passive monitors into active advisory systems.

  • A key trend is the convergence of operational technology (ot) and information technology (it), enabled by edge computing hardware for remote operational intelligence. This facilitates digital thread integration across the value chain, improving supply chain visibility enhancement.
  • The rise of industrial metaverse environments and immersive collaborative design using augmented reality headsets allows for virtual commissioning, which can reduce project validation times by up to 30%. This trend also supports sustainable manufacturing solutions through better carbon footprint reporting, with some systems achieving regulatory compliance automation for over 95% of reporting requirements.
  • These advancements are redefining how manufacturers design, build, and operate heavy industrial assets.

What challenges does the Industrial Digital Twin For Heavy Industries Industry face during its growth?

  • High initial capital expenditure and the technical complexity of integrating with legacy systems present a key challenge to market adoption.

  • Significant challenges persist, primarily from the use of proprietary communication protocols that hinder the creation of unified open-source data lakes. The effective use of machine learning algorithms and natural language processing is constrained without standardized data. Industrial automation systems and real-time robotic coordination depend on closed-loop feedback systems and synchronous operational environments, which are difficult to achieve across disparate platforms.
  • While virtual prototyping for heavy industry and structural integrity analysis show promise, their accuracy is limited by inconsistent data inputs. Improving resource utilization analysis requires better sensor integration, including specialized tools like downhole sensors, to move past the current fragmented data landscape, where integration failures can increase project costs by 15%.

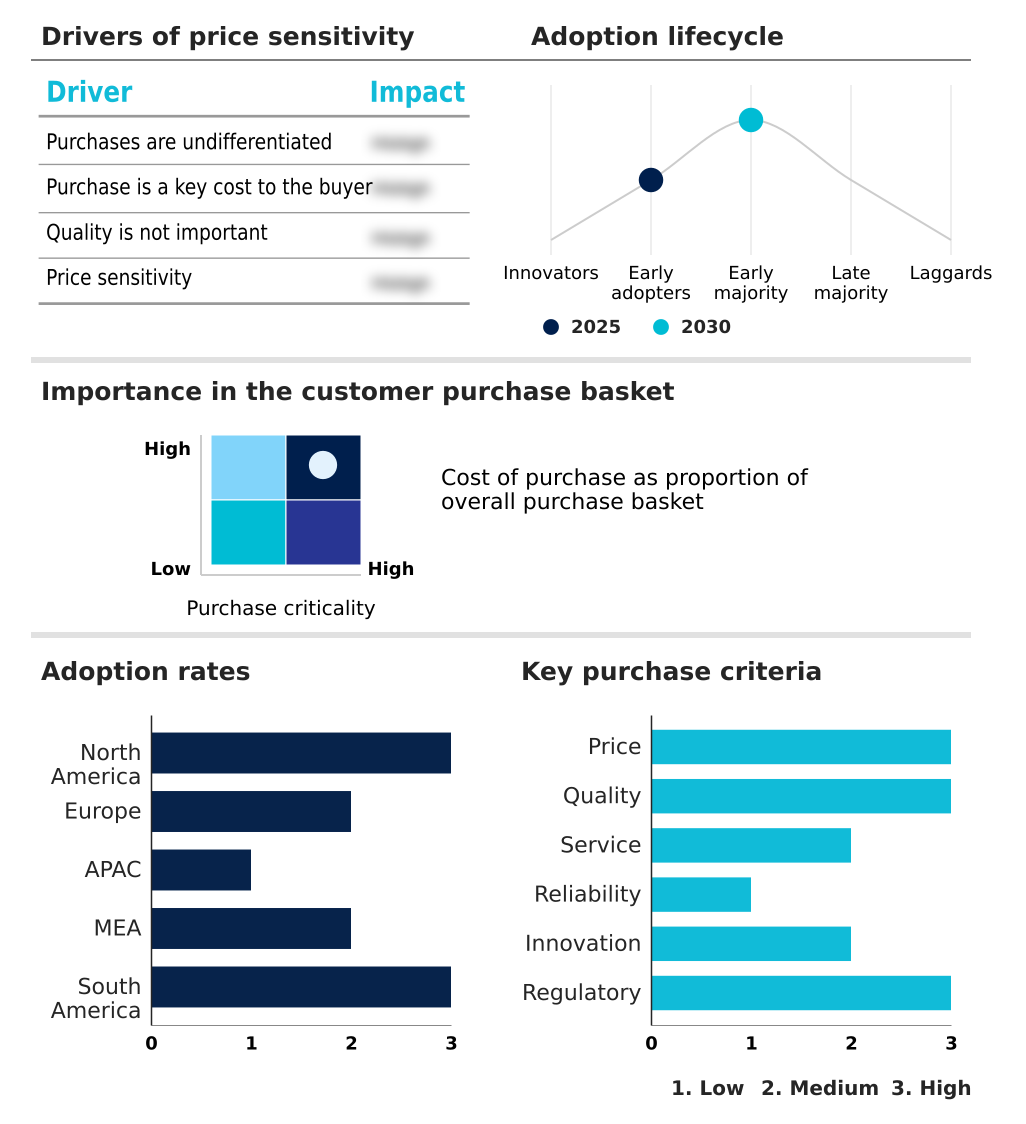
Exclusive Technavio Analysis on Customer Landscape

The industrial digital twin for heavy industries market forecasting report includes the adoption lifecycle of the market, covering from the innovator’s stage to the laggard’s stage. It focuses on adoption rates in different regions based on penetration. Furthermore, the industrial digital twin for heavy industries market report also includes key purchase criteria and drivers of price sensitivity to help companies evaluate and develop their market growth analysis strategies.

Customer Landscape of Industrial Digital Twin For Heavy Industries Industry

Competitive Landscape

Companies are implementing various strategies, such as strategic alliances, industrial digital twin for heavy industries market forecast, partnerships, mergers and acquisitions, geographical expansion, and product/service launches, to enhance their presence in the industry.

ABB Ltd. - Provides industrial digital twins via a proprietary platform, enabling real-time asset monitoring, predictive maintenance, and performance optimization for heavy equipment.

The industry research and growth report includes detailed analyses of the competitive landscape of the market and information about key companies, including:

  • ABB Ltd.
  • Altair Engineering Inc.
  • Amazon.com Inc.
  • ANSYS Inc.
  • Bentley Systems Inc.
  • Dassault Systemes SE
  • Emerson Electric Co.
  • General Electric Co.
  • Hexagon AB
  • Honeywell International Inc.
  • IBM Corp.
  • Microsoft Corp.
  • Mitsubishi Electric Corp.
  • Oracle Corp.
  • PTC Inc.
  • Robert Bosch GmbH
  • Rockwell Automation Inc.
  • SAP SE
  • Schneider Electric SE
  • Siemens AG

Qualitative and quantitative analysis of companies has been conducted to help clients understand the wider business environment as well as the strengths and weaknesses of key industry players. Data is qualitatively analyzed to categorize companies as pure play, category-focused, industry-focused, and diversified; it is quantitatively analyzed to categorize companies as dominant, leading, strong, tentative, and weak.

Recent Development and News in Industrial digital twin for heavy industries market

  • In May 2025, Emerson Electric integrated generative artificial intelligence agents into its DeltaV automation system to assist engineers in interpreting complex digital twin simulations of chemical processing plants.
  • In August 2025, SAP introduced a specialized digital thread synchronization tool for the heavy equipment manufacturing sector, enabling automated tracking of the carbon footprint of individual components.
  • In October 2025, Bentley Systems launched an immersive three-dimensional visualization extension for its iTwin platform, allowing stakeholders to conduct remote design reviews of industrial facilities using augmented reality headsets.
  • In February 2025, Schneider Electric collaborated with a global telecommunications leader to launch a dedicated 5G-enabled digital twin platform for heavy industrial applications, focusing on seamless sensor integration.

Dive into Technavio’s robust research methodology, blending expert interviews, extensive data synthesis, and validated models for unparalleled Industrial Digital Twin For Heavy Industries Market insights. See full methodology.

Market Scope
Page number 310
Base year 2025
Historic period 2020-2024
Forecast period 2026-2030
Growth momentum & CAGR Accelerate at a CAGR of 18.2%
Market growth 2026-2030 USD 2839.2 million
Market structure Fragmented
YoY growth 2025-2026(%) 16.2%
Key countries US, Canada, Mexico, Germany, UK, France, Italy, Spain, The Netherlands, China, Japan, India, South Korea, Australia, Indonesia, Saudi Arabia, UAE, South Africa, Qatar, Nigeria, Brazil, Argentina and Chile
Competitive landscape Leading Companies, Market Positioning of Companies, Competitive Strategies, and Industry Risks

Request Free Sample

Research Analyst Overview

  • The industrial digital twin market for heavy industries is maturing from a conceptual framework to a core operational tool, built on high-fidelity virtual replica technology and physics-based simulation. The integration of the industrial internet of things (iiot) with edge computing hardware is foundational, enabling real-time data synchronization and remote expert assistance in creating autonomous industrial environments.
  • A key boardroom-level consideration is how digital thread integration supports ESG compliance through circular economy tracking and digital product passports. Tools like generative design algorithms and machine learning algorithms are automating asset lifecycle optimization and creating sophisticated predictive maintenance models. This technology facilitates virtual commissioning and blast furnace optimization, with some deployments achieving a 30% reduction in commissioning time.
  • The ecosystem relies on high-precision sensors and emerging 5g-enabled digital platforms, alongside augmented reality headsets for industrial metaverse environments. Success hinges on integrating data from plm and erp systems, navigating cybersecurity vulnerabilities in converged ot and it landscapes, and establishing robust data interoperability standards for subsea wellhead monitoring and other critical applications.

What are the Key Data Covered in this Industrial Digital Twin For Heavy Industries Market Research and Growth Report?

  • What is the expected growth of the Industrial Digital Twin For Heavy Industries Market between 2026 and 2030?

    • USD 2.84 billion, at a CAGR of 18.2%

  • What segmentation does the market report cover?

    • The report is segmented by Component (Software, Services, and Hardware), Deployment (Cloud, On-premises, and Hybrid), Sector (Downstream, Upstream, and Midstream) and Geography (North America, Europe, APAC, Middle East and Africa, South America)

  • Which regions are analyzed in the report?

    • North America, Europe, APAC, Middle East and Africa and South America

  • What are the key growth drivers and market challenges?

    • Optimization of asset lifecycle and predictive maintenance, High initial capital expenditure and technical integration complexity

  • Who are the major players in the Industrial Digital Twin For Heavy Industries Market?

    • ABB Ltd., Altair Engineering Inc., Amazon.com Inc., ANSYS Inc., Bentley Systems Inc., Dassault Systemes SE, Emerson Electric Co., General Electric Co., Hexagon AB, Honeywell International Inc., IBM Corp., Microsoft Corp., Mitsubishi Electric Corp., Oracle Corp., PTC Inc., Robert Bosch GmbH, Rockwell Automation Inc., SAP SE, Schneider Electric SE and Siemens AG

Market Research Insights

  • Market dynamics are shaped by the pursuit of remote operational intelligence and superior asset performance management (apm). The shift toward predictive and prescriptive analytics is central, with implementations showing up to a 40% reduction in unplanned downtime compared to traditional maintenance schedules.
  • Sustainable manufacturing solutions, driven by regulations, are another key factor, as energy consumption modeling helps firms meet carbon footprint reporting goals. Effective manufacturing process optimization through heavy machinery simulation can improve production throughput by over 15%. This creates a strong business case for adoption despite challenges in legacy system integration.
  • The ability to achieve enhanced supply chain visibility enhancement provides a significant competitive advantage, connecting factory floor data collection with enterprise-level strategic planning for a more resilient operational framework.

We can help! Our analysts can customize this industrial digital twin for heavy industries market research report to meet your requirements.

Get in touch

1. Executive Summary

1.1 Market overview

Executive Summary - Chart on Market Overview
Executive Summary - Data Table on Market Overview
Executive Summary - Chart on Global Market Characteristics
Executive Summary - Chart on Market by Geography
Executive Summary - Chart on Market Segmentation by Component
Executive Summary - Chart on Market Segmentation by Deployment
Executive Summary - Chart on Market Segmentation by Sector
Executive Summary - Chart on Incremental Growth
Executive Summary - Data Table on Incremental Growth
Executive Summary - Chart on Company Market Positioning

2. Technavio Analysis

2.1 Analysis of price sensitivity, lifecycle, customer purchase basket, adoption rates, and purchase criteria

2.2 Criticality of inputs and Factors of differentiation

Chart on Overview on criticality of inputs and factors of differentiation

2.3 Factors of disruption

Chart on Overview on factors of disruption

2.4 Impact of drivers and challenges

Chart on Impact of drivers and challenges in 2025 and 2030

3. Market Landscape

3.1 Market ecosystem

Chart on Parent Market
Data Table on - Parent Market

3.2 Market characteristics

Chart on Market characteristics analysis

3.3 Value chain analysis

Chart on Value chain analysis

4. Market Sizing

4.1 Market definition

Data Table on Offerings of companies included in the market definition

4.2 Market segment analysis

Market segments

4.3 Market size 2025

4.4 Market outlook: Forecast for 2025-2030

Chart on Global - Market size and forecast 2025-2030 ($ million)
Data Table on Global - Market size and forecast 2025-2030 ($ million)
Chart on Global Market: Year-over-year growth 2025-2030 (%)
Data Table on Global Market: Year-over-year growth 2025-2030 (%)

5. Historic Market Size

5.1 Global Industrial Digital Twin For Heavy Industries Market 2020 - 2024

Historic Market Size - Data Table on Global Industrial Digital Twin For Heavy Industries Market 2020 - 2024 ($ million)

5.2 Component segment analysis 2020 - 2024

Historic Market Size - Component Segment 2020 - 2024 ($ million)

5.3 Deployment segment analysis 2020 - 2024

Historic Market Size - Deployment Segment 2020 - 2024 ($ million)

5.4 Sector segment analysis 2020 - 2024

Historic Market Size - Sector Segment 2020 - 2024 ($ million)

5.5 Geography segment analysis 2020 - 2024

Historic Market Size - Geography Segment 2020 - 2024 ($ million)

5.6 Country segment analysis 2020 - 2024

Historic Market Size - Country Segment 2020 - 2024 ($ million)

6. Qualitative Analysis

6.1 The AI impact on Global Industrial Digital Twin for Heavy Industries Market

6.2 Impact of geopolitical conflicts on Global Industrial Digital Twin for Heavy Industries Market

7. Five Forces Analysis

7.1 Five forces summary

Five forces analysis - Comparison between 2025 and 2030

7.2 Bargaining power of buyers

Bargaining power of buyers - Impact of key factors 2025 and 2030

7.3 Bargaining power of suppliers

Bargaining power of suppliers - Impact of key factors in 2025 and 2030

7.4 Threat of new entrants

Threat of new entrants - Impact of key factors in 2025 and 2030

7.5 Threat of substitutes

Threat of substitutes - Impact of key factors in 2025 and 2030

7.6 Threat of rivalry

Threat of rivalry - Impact of key factors in 2025 and 2030

7.7 Market condition

Chart on Market condition - Five forces 2025 and 2030

8. Market Segmentation by Component

8.1 Market segments

Chart on Component - Market share 2025-2030 (%)
Data Table on Component - Market share 2025-2030 (%)

8.2 Comparison by Component

Chart on Comparison by Component
Data Table on Comparison by Component

8.3 Software - Market size and forecast 2025-2030

Chart on Software - Market size and forecast 2025-2030 ($ million)
Data Table on Software - Market size and forecast 2025-2030 ($ million)
Chart on Software - Year-over-year growth 2025-2030 (%)
Data Table on Software - Year-over-year growth 2025-2030 (%)

8.4 Services - Market size and forecast 2025-2030

Chart on Services - Market size and forecast 2025-2030 ($ million)
Data Table on Services - Market size and forecast 2025-2030 ($ million)
Chart on Services - Year-over-year growth 2025-2030 (%)
Data Table on Services - Year-over-year growth 2025-2030 (%)

8.5 Hardware - Market size and forecast 2025-2030

Chart on Hardware - Market size and forecast 2025-2030 ($ million)
Data Table on Hardware - Market size and forecast 2025-2030 ($ million)
Chart on Hardware - Year-over-year growth 2025-2030 (%)
Data Table on Hardware - Year-over-year growth 2025-2030 (%)

8.6 Market opportunity by Component

Market opportunity by Component ($ million)
Data Table on Market opportunity by Component ($ million)

9. Market Segmentation by Deployment

9.1 Market segments

Chart on Deployment - Market share 2025-2030 (%)
Data Table on Deployment - Market share 2025-2030 (%)

9.2 Comparison by Deployment

Chart on Comparison by Deployment
Data Table on Comparison by Deployment

9.3 Cloud - Market size and forecast 2025-2030

Chart on Cloud - Market size and forecast 2025-2030 ($ million)
Data Table on Cloud - Market size and forecast 2025-2030 ($ million)
Chart on Cloud - Year-over-year growth 2025-2030 (%)
Data Table on Cloud - Year-over-year growth 2025-2030 (%)

9.4 On-premises - Market size and forecast 2025-2030

Chart on On-premises - Market size and forecast 2025-2030 ($ million)
Data Table on On-premises - Market size and forecast 2025-2030 ($ million)
Chart on On-premises - Year-over-year growth 2025-2030 (%)
Data Table on On-premises - Year-over-year growth 2025-2030 (%)

9.5 Hybrid - Market size and forecast 2025-2030

Chart on Hybrid - Market size and forecast 2025-2030 ($ million)
Data Table on Hybrid - Market size and forecast 2025-2030 ($ million)
Chart on Hybrid - Year-over-year growth 2025-2030 (%)
Data Table on Hybrid - Year-over-year growth 2025-2030 (%)

9.6 Market opportunity by Deployment

Market opportunity by Deployment ($ million)
Data Table on Market opportunity by Deployment ($ million)

10. Market Segmentation by Sector

10.1 Market segments

Chart on Sector - Market share 2025-2030 (%)
Data Table on Sector - Market share 2025-2030 (%)

10.2 Comparison by Sector

Chart on Comparison by Sector
Data Table on Comparison by Sector

10.3 Downstream - Market size and forecast 2025-2030

Chart on Downstream - Market size and forecast 2025-2030 ($ million)
Data Table on Downstream - Market size and forecast 2025-2030 ($ million)
Chart on Downstream - Year-over-year growth 2025-2030 (%)
Data Table on Downstream - Year-over-year growth 2025-2030 (%)

10.4 Upstream - Market size and forecast 2025-2030

Chart on Upstream - Market size and forecast 2025-2030 ($ million)
Data Table on Upstream - Market size and forecast 2025-2030 ($ million)
Chart on Upstream - Year-over-year growth 2025-2030 (%)
Data Table on Upstream - Year-over-year growth 2025-2030 (%)

10.5 Midstream - Market size and forecast 2025-2030

Chart on Midstream - Market size and forecast 2025-2030 ($ million)
Data Table on Midstream - Market size and forecast 2025-2030 ($ million)
Chart on Midstream - Year-over-year growth 2025-2030 (%)
Data Table on Midstream - Year-over-year growth 2025-2030 (%)

10.6 Market opportunity by Sector

Market opportunity by Sector ($ million)
Data Table on Market opportunity by Sector ($ million)

11. Customer Landscape

11.1 Customer landscape overview

Analysis of price sensitivity, lifecycle, customer purchase basket, adoption rates, and purchase criteria

12. Geographic Landscape

12.1 Geographic segmentation

Chart on Market share by geography 2025-2030 (%)
Data Table on Market share by geography 2025-2030 (%)

12.2 Geographic comparison

Chart on Geographic comparison
Data Table on Geographic comparison

12.3 North America - Market size and forecast 2025-2030

Chart on North America - Market size and forecast 2025-2030 ($ million)
Data Table on North America - Market size and forecast 2025-2030 ($ million)
Chart on North America - Year-over-year growth 2025-2030 (%)
Data Table on North America - Year-over-year growth 2025-2030 (%)
Chart on Regional Comparison - North America
Data Table on Regional Comparison - North America

12.3.1 US - Market size and forecast 2025-2030

Chart on US - Market size and forecast 2025-2030 ($ million)
Data Table on US - Market size and forecast 2025-2030 ($ million)
Chart on US - Year-over-year growth 2025-2030 (%)
Data Table on US - Year-over-year growth 2025-2030 (%)

12.3.2 Canada - Market size and forecast 2025-2030

Chart on Canada - Market size and forecast 2025-2030 ($ million)
Data Table on Canada - Market size and forecast 2025-2030 ($ million)
Chart on Canada - Year-over-year growth 2025-2030 (%)
Data Table on Canada - Year-over-year growth 2025-2030 (%)

12.3.3 Mexico - Market size and forecast 2025-2030

Chart on Mexico - Market size and forecast 2025-2030 ($ million)
Data Table on Mexico - Market size and forecast 2025-2030 ($ million)
Chart on Mexico - Year-over-year growth 2025-2030 (%)
Data Table on Mexico - Year-over-year growth 2025-2030 (%)

12.4 Europe - Market size and forecast 2025-2030

Chart on Europe - Market size and forecast 2025-2030 ($ million)
Data Table on Europe - Market size and forecast 2025-2030 ($ million)
Chart on Europe - Year-over-year growth 2025-2030 (%)
Data Table on Europe - Year-over-year growth 2025-2030 (%)
Chart on Regional Comparison - Europe
Data Table on Regional Comparison - Europe

12.4.1 Germany - Market size and forecast 2025-2030

Chart on Germany - Market size and forecast 2025-2030 ($ million)
Data Table on Germany - Market size and forecast 2025-2030 ($ million)
Chart on Germany - Year-over-year growth 2025-2030 (%)
Data Table on Germany - Year-over-year growth 2025-2030 (%)

12.4.2 UK - Market size and forecast 2025-2030

Chart on UK - Market size and forecast 2025-2030 ($ million)
Data Table on UK - Market size and forecast 2025-2030 ($ million)
Chart on UK - Year-over-year growth 2025-2030 (%)
Data Table on UK - Year-over-year growth 2025-2030 (%)

12.4.3 France - Market size and forecast 2025-2030

Chart on France - Market size and forecast 2025-2030 ($ million)
Data Table on France - Market size and forecast 2025-2030 ($ million)
Chart on France - Year-over-year growth 2025-2030 (%)
Data Table on France - Year-over-year growth 2025-2030 (%)

12.4.4 Italy - Market size and forecast 2025-2030

Chart on Italy - Market size and forecast 2025-2030 ($ million)
Data Table on Italy - Market size and forecast 2025-2030 ($ million)
Chart on Italy - Year-over-year growth 2025-2030 (%)
Data Table on Italy - Year-over-year growth 2025-2030 (%)

12.4.5 Spain - Market size and forecast 2025-2030

Chart on Spain - Market size and forecast 2025-2030 ($ million)
Data Table on Spain - Market size and forecast 2025-2030 ($ million)
Chart on Spain - Year-over-year growth 2025-2030 (%)
Data Table on Spain - Year-over-year growth 2025-2030 (%)

12.4.6 The Netherlands - Market size and forecast 2025-2030

Chart on The Netherlands - Market size and forecast 2025-2030 ($ million)
Data Table on The Netherlands - Market size and forecast 2025-2030 ($ million)
Chart on The Netherlands - Year-over-year growth 2025-2030 (%)
Data Table on The Netherlands - Year-over-year growth 2025-2030 (%)

12.5 APAC - Market size and forecast 2025-2030

Chart on APAC - Market size and forecast 2025-2030 ($ million)
Data Table on APAC - Market size and forecast 2025-2030 ($ million)
Chart on APAC - Year-over-year growth 2025-2030 (%)
Data Table on APAC - Year-over-year growth 2025-2030 (%)
Chart on Regional Comparison - APAC
Data Table on Regional Comparison - APAC

12.5.1 China - Market size and forecast 2025-2030

Chart on China - Market size and forecast 2025-2030 ($ million)
Data Table on China - Market size and forecast 2025-2030 ($ million)
Chart on China - Year-over-year growth 2025-2030 (%)
Data Table on China - Year-over-year growth 2025-2030 (%)

12.5.2 Japan - Market size and forecast 2025-2030

Chart on Japan - Market size and forecast 2025-2030 ($ million)
Data Table on Japan - Market size and forecast 2025-2030 ($ million)
Chart on Japan - Year-over-year growth 2025-2030 (%)
Data Table on Japan - Year-over-year growth 2025-2030 (%)

12.5.3 India - Market size and forecast 2025-2030

Chart on India - Market size and forecast 2025-2030 ($ million)
Data Table on India - Market size and forecast 2025-2030 ($ million)
Chart on India - Year-over-year growth 2025-2030 (%)
Data Table on India - Year-over-year growth 2025-2030 (%)

12.5.4 South Korea - Market size and forecast 2025-2030

Chart on South Korea - Market size and forecast 2025-2030 ($ million)
Data Table on South Korea - Market size and forecast 2025-2030 ($ million)
Chart on South Korea - Year-over-year growth 2025-2030 (%)
Data Table on South Korea - Year-over-year growth 2025-2030 (%)

12.5.5 Australia - Market size and forecast 2025-2030

Chart on Australia - Market size and forecast 2025-2030 ($ million)
Data Table on Australia - Market size and forecast 2025-2030 ($ million)
Chart on Australia - Year-over-year growth 2025-2030 (%)
Data Table on Australia - Year-over-year growth 2025-2030 (%)

12.5.6 Indonesia - Market size and forecast 2025-2030

Chart on Indonesia - Market size and forecast 2025-2030 ($ million)
Data Table on Indonesia - Market size and forecast 2025-2030 ($ million)
Chart on Indonesia - Year-over-year growth 2025-2030 (%)
Data Table on Indonesia - Year-over-year growth 2025-2030 (%)

12.6 Middle East and Africa - Market size and forecast 2025-2030

Chart on Middle East and Africa - Market size and forecast 2025-2030 ($ million)
Data Table on Middle East and Africa - Market size and forecast 2025-2030 ($ million)
Chart on Middle East and Africa - Year-over-year growth 2025-2030 (%)
Data Table on Middle East and Africa - Year-over-year growth 2025-2030 (%)
Chart on Regional Comparison - Middle East and Africa
Data Table on Regional Comparison - Middle East and Africa

12.6.1 Saudi Arabia - Market size and forecast 2025-2030

Chart on Saudi Arabia - Market size and forecast 2025-2030 ($ million)
Data Table on Saudi Arabia - Market size and forecast 2025-2030 ($ million)
Chart on Saudi Arabia - Year-over-year growth 2025-2030 (%)
Data Table on Saudi Arabia - Year-over-year growth 2025-2030 (%)

12.6.2 UAE - Market size and forecast 2025-2030

Chart on UAE - Market size and forecast 2025-2030 ($ million)
Data Table on UAE - Market size and forecast 2025-2030 ($ million)
Chart on UAE - Year-over-year growth 2025-2030 (%)
Data Table on UAE - Year-over-year growth 2025-2030 (%)

12.6.3 South Africa - Market size and forecast 2025-2030

Chart on South Africa - Market size and forecast 2025-2030 ($ million)
Data Table on South Africa - Market size and forecast 2025-2030 ($ million)
Chart on South Africa - Year-over-year growth 2025-2030 (%)
Data Table on South Africa - Year-over-year growth 2025-2030 (%)

12.6.4 Qatar - Market size and forecast 2025-2030

Chart on Qatar - Market size and forecast 2025-2030 ($ million)
Data Table on Qatar - Market size and forecast 2025-2030 ($ million)
Chart on Qatar - Year-over-year growth 2025-2030 (%)
Data Table on Qatar - Year-over-year growth 2025-2030 (%)

12.6.5 Nigeria - Market size and forecast 2025-2030

Chart on Nigeria - Market size and forecast 2025-2030 ($ million)
Data Table on Nigeria - Market size and forecast 2025-2030 ($ million)
Chart on Nigeria - Year-over-year growth 2025-2030 (%)
Data Table on Nigeria - Year-over-year growth 2025-2030 (%)

12.7 South America - Market size and forecast 2025-2030

Chart on South America - Market size and forecast 2025-2030 ($ million)
Data Table on South America - Market size and forecast 2025-2030 ($ million)
Chart on South America - Year-over-year growth 2025-2030 (%)
Data Table on South America - Year-over-year growth 2025-2030 (%)
Chart on Regional Comparison - South America
Data Table on Regional Comparison - South America

12.7.1 Brazil - Market size and forecast 2025-2030

Chart on Brazil - Market size and forecast 2025-2030 ($ million)
Data Table on Brazil - Market size and forecast 2025-2030 ($ million)
Chart on Brazil - Year-over-year growth 2025-2030 (%)
Data Table on Brazil - Year-over-year growth 2025-2030 (%)

12.7.2 Argentina - Market size and forecast 2025-2030

Chart on Argentina - Market size and forecast 2025-2030 ($ million)
Data Table on Argentina - Market size and forecast 2025-2030 ($ million)
Chart on Argentina - Year-over-year growth 2025-2030 (%)
Data Table on Argentina - Year-over-year growth 2025-2030 (%)

12.7.3 Chile - Market size and forecast 2025-2030

Chart on Chile - Market size and forecast 2025-2030 ($ million)
Data Table on Chile - Market size and forecast 2025-2030 ($ million)
Chart on Chile - Year-over-year growth 2025-2030 (%)
Data Table on Chile - Year-over-year growth 2025-2030 (%)

12.8 Market opportunity by geography

Market opportunity by geography ($ million)
Data Tables on Market opportunity by geography ($ million)

13. Drivers, Challenges, and Opportunity

13.1 Market drivers

Optimization of asset lifecycle and predictive maintenance
Sustainability and regulatory compliance for heavy industry
Convergence of industrial IoT and AI

13.2 Market challenges

High initial capital expenditure and technical integration complexity
Data interoperability and lack of industry standardization
Cybersecurity vulnerabilities and data integrity risks

13.3 Impact of drivers and challenges

Impact of drivers and challenges in 2025 and 2030

13.4 Market opportunities

Integration of generative AI and natural language interfaces
Expansion of digital thread for circular economy and sustainability tracking
Advancement of industrial metaverse and immersive collaborative environments

14. Competitive Landscape

14.1 Overview

14.2

Overview on criticality of inputs and factors of differentiation

14.3 Landscape disruption

Overview on factors of disruption

14.4 Industry risks

Impact of key risks on business

15. Competitive Analysis

15.1 Companies profiled

Companies covered

15.2 Company ranking index

15.3 Market positioning of companies

Matrix on companies position and classification

15.4 ABB Ltd.

ABB Ltd. - Overview
ABB Ltd. - Business segments
ABB Ltd. - Key news
ABB Ltd. - Key offerings
ABB Ltd. - Segment focus
SWOT

15.5 Altair Engineering Inc.

Altair Engineering Inc. - Overview
Altair Engineering Inc. - Product / Service
Altair Engineering Inc. - Key offerings
SWOT

15.6 Amazon.com Inc.

Amazon.com Inc. - Overview
Amazon.com Inc. - Business segments
Amazon.com Inc. - Key news
Amazon.com Inc. - Key offerings
Amazon.com Inc. - Segment focus
SWOT

15.7 ANSYS Inc.

ANSYS Inc. - Overview
ANSYS Inc. - Business segments
ANSYS Inc. - Key offerings
ANSYS Inc. - Segment focus
SWOT

15.8 Bentley Systems Inc.

Bentley Systems Inc. - Overview
Bentley Systems Inc. - Business segments
Bentley Systems Inc. - Key offerings
Bentley Systems Inc. - Segment focus
SWOT

15.9 Dassault Systemes SE

Dassault Systemes SE - Overview
Dassault Systemes SE - Business segments
Dassault Systemes SE - Key offerings
Dassault Systemes SE - Segment focus
SWOT

15.10 Emerson Electric Co.

Emerson Electric Co. - Overview
Emerson Electric Co. - Business segments
Emerson Electric Co. - Key news
Emerson Electric Co. - Key offerings
Emerson Electric Co. - Segment focus
SWOT

15.11 General Electric Co.

General Electric Co. - Overview
General Electric Co. - Business segments
General Electric Co. - Key offerings
General Electric Co. - Segment focus
SWOT

15.12 Hexagon AB

Hexagon AB - Overview
Hexagon AB - Business segments
Hexagon AB - Key offerings
Hexagon AB - Segment focus
SWOT

15.13 Honeywell International Inc.

Honeywell International Inc. - Overview
Honeywell International Inc. - Business segments
Honeywell International Inc. - Key news
Honeywell International Inc. - Key offerings
Honeywell International Inc. - Segment focus
SWOT

15.14 IBM Corp.

IBM Corp. - Overview
IBM Corp. - Business segments
IBM Corp. - Key news
IBM Corp. - Key offerings
IBM Corp. - Segment focus
SWOT

15.15 Microsoft Corp.

Microsoft Corp. - Overview
Microsoft Corp. - Business segments
Microsoft Corp. - Key news
Microsoft Corp. - Key offerings
Microsoft Corp. - Segment focus
SWOT

15.16 Mitsubishi Electric Corp.

Mitsubishi Electric Corp. - Overview
Mitsubishi Electric Corp. - Business segments
Mitsubishi Electric Corp. - Key offerings
Mitsubishi Electric Corp. - Segment focus
SWOT

15.17 Oracle Corp.

Oracle Corp. - Overview
Oracle Corp. - Business segments
Oracle Corp. - Key news
Oracle Corp. - Key offerings
Oracle Corp. - Segment focus
SWOT

15.18 PTC Inc.

PTC Inc. - Overview
PTC Inc. - Business segments
PTC Inc. - Key offerings
PTC Inc. - Segment focus
SWOT

16. Appendix

16.1 Scope of the report

Market definition
Objectives
Notes and caveats

16.2 Inclusions and exclusions checklist

Inclusions checklist
Exclusions checklist

16.3 Currency conversion rates for US$

16.4 Research methodology

16.5 Data procurement

Information sources

16.6 Data validation

16.7 Validation techniques employed for market sizing

16.8 Data synthesis

16.9 360 degree market analysis

16.10 List of abbreviations

Research Methodology

Technavio presents a detailed picture of the market by way of study, synthesis, and summation of data from multiple sources. The analysts have presented the various facets of the market with a particular focus on identifying the key industry influencers. The data thus presented is comprehensive, reliable, and the result of extensive research, both primary and secondary.

INFORMATION SOURCES

Primary sources

  • Manufacturers and suppliers
  • Channel partners
  • Industry experts
  • Strategic decision makers

Secondary sources

  • Industry journals and periodicals
  • Government data
  • Financial reports of key industry players
  • Historical data
  • Press releases

DATA ANALYSIS

Data Synthesis

  • Collation of data
  • Estimation of key figures
  • Analysis of derived insights

Data Validation

  • Triangulation with data models
  • Reference against proprietary databases
  • Corroboration with industry experts

REPORT WRITING

Qualitative

  • Market drivers
  • Market challenges
  • Market trends
  • Five forces analysis

Quantitative

  • Market size and forecast
  • Market segmentation
  • Geographical insights
  • Competitive landscape

Interested in this report?

Get your sample now to see our research methodology and insights!

Download Now

Frequently Asked Questions

Industrial Digital Twin For Heavy Industries market growth will increase by USD 2839.2 million during 2026-2030.

The Industrial Digital Twin For Heavy Industries market is expected to grow at a CAGR of 18.2% during 2026-2030.

Industrial Digital Twin For Heavy Industries market is segmented by Component (Software, Services, Hardware) Deployment (Cloud, On-premises, Hybrid) Sector (Downstream, Upstream, Midstream)

ABB Ltd., Altair Engineering Inc., Amazon.com Inc., ANSYS Inc., Bentley Systems Inc., Dassault Systemes SE, Emerson Electric Co., General Electric Co., Hexagon AB, Honeywell International Inc., IBM Corp., Microsoft Corp., Mitsubishi Electric Corp., Oracle Corp., PTC Inc., Robert Bosch GmbH, Rockwell Automation Inc., SAP SE, Schneider Electric SE, Siemens AG are a few of the key vendors in the Industrial Digital Twin For Heavy Industries market.

North America will register the highest growth rate of 29.8% among the other regions. Therefore, the Industrial Digital Twin For Heavy Industries market in North America is expected to garner significant business opportunities for the vendors during the forecast period.

US, Canada, Mexico, Germany, UK, France, Italy, Spain, The Netherlands, China, Japan, India, South Korea, Australia, Indonesia, Saudi Arabia, UAE, South Africa, Qatar, Nigeria, Brazil, Argentina, Chile

  • Optimization of asset lifecycle and predictive maintenance is the driving factor this market.

The Industrial Digital Twin For Heavy Industries market vendors should focus on grabbing business opportunities from the Component segment as it accounted for the largest market share in the base year.
RIA - Research AI Assistant
Ask RIA