Gasoline Market Analysis US - Size and Forecast 2023-2027

Gasoline Market Analysis US - Size and Forecast 2023-2027

Published: Feb 2023 128 Pages SKU: IRTNTR75011

Market Overview at a Glance

$258 mn L
Market Opportunity
-4.18%
CAGR
-3.81
YoY growth 2022-2023(%)

US Gasoline Market Size 2023-2027 

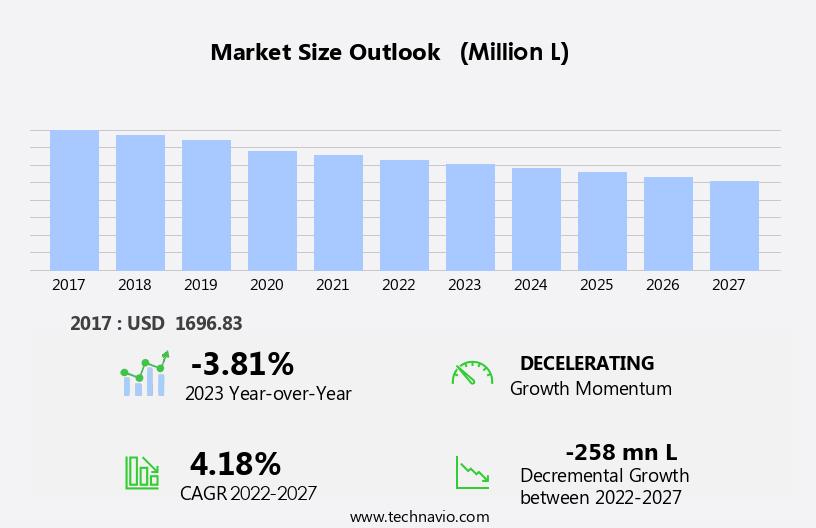
The US gasoline market size is forecast to decrease by -258 mn L, at a CAGR of -4.18% between 2022 and 2027.

  • The Gasoline Market in the US is driven by the increasing number of automobiles and the rise in oil and gas production. These factors contribute to the market's growth, as the demand for gasoline continues to escalate. However, the market faces challenges due to the fluctuation in prices of gasoline. This volatility can significantly impact market dynamics, making it essential for companies to navigate these price swings effectively. The oil industry's production levels, geopolitical tensions, and economic conditions are key factors influencing gasoline prices.
  • To capitalize on market opportunities and mitigate challenges, companies must adopt strategic initiatives such as price differentiation, supply chain optimization, and innovation in fuel efficiency technologies. By staying agile and responsive to market trends and price fluctuations, market participants can effectively position themselves for long-term success in the Gasoline Market.

What will be the size of the US Gasoline Market during the forecast period?

Gasoline Market in US Size

Explore in-depth regional segment analysis with market size data - historical 2017-2021 and forecasts 2023-2027 - in the full report.  
 Request Free Sample

  • The gasoline market in the US is influenced by various factors, including the composition of gasoline, energy policy impact, fuel additives chemistry, and fuel demand forecasting. The refining process of crude oil plays a significant role in producing high-quality gasoline that meets consumer preferences and regulatory requirements. Gasoline pricing models are shaped by the cost of crude oil, production process, and fuel market analysis. Fuel blending technology and gasoline quality assurance are crucial in optimizing engine performance and reducing emissions. Innovations in engine performance optimization and emissions reduction technologies continue to shape the gasoline industry. Fuel efficiency optimization and fuel policy analysis are essential in assessing the environmental impact of gasoline use.
  • The future of gasoline involves research into fuel alternatives, such as renewable fuels, and the development of new testing methods for fuel quality assessment. The use of fuel additives and their chemistry plays a vital role in enhancing fuel performance and reducing emissions. The gasoline industry remains dynamic, with ongoing efforts to improve fuel production processes and respond to changing consumer preferences and regulatory requirements.

How is this market segmented?

The market research report provides comprehensive data (region-wise segment analysis), with forecasts and estimates in "USD mn L" for the period 2023-2027, as well as historical data from 2017-2021 for the following segments.

  • Type
    • Regular
    • Premium
  • End-user
    • Transportation
    • Power generation
    • Others
  • Geography
    • North America
      • US

By Type Insights

The regular segment is estimated to witness significant growth during the forecast period.

The US gasoline market is a significant sector within the global energy industry, shaped by various factors including consumer behavior, climate change, and technological advancements. Regular gasoline, a hydrocarbon mixture derived from crude oil, is the most commonly used fuel for standard internal combustion engines. It typically contains around 10% ethanol for octane enhancement, with an octane rating of 87 or 88. Higher-performance engines may require higher-octane fuels to prevent engine damage from knocking or pinging. The petroleum industry's refining process produces regular gasoline, which is distributed through an extensive pipeline infrastructure to retailers. Gasoline retailing involves marketing and selling the fuel to consumers, with prices influenced by factors such as crude oil prices, taxes, and regional variations.

Government regulations play a crucial role in the gasoline market, with emissions standards and fuel efficiency requirements driving innovation in fuel technology. Alternative fuels, such as ethanol blends, renewable fuels, and electric vehicles, are gaining popularity due to their environmental benefits and potential to reduce carbon emissions. Fuel efficiency standards, such as Corporate Average Fuel Economy (CAFE) regulations, have led to advancements in engine performance and fuel economy. Fuel additives, including biofuel additives and octane enhancers, are used to improve fuel quality and performance. Geopolitical influences and fuel volatility can impact the gasoline market, with supply chain disruptions and price fluctuations affecting both domestic and international markets.

The energy sector's transition towards sustainable fuels and decarbonization is also shaping the future of the gasoline market. Regular gasoline remains widely available and affordable, making it a popular choice for most consumers. However, the evolving market dynamics and technological advancements are driving the adoption of alternative fuels and more efficient vehicles, potentially impacting the demand for regular gasoline in the future.

Gasoline Market in US Size

Download Free Sample Report

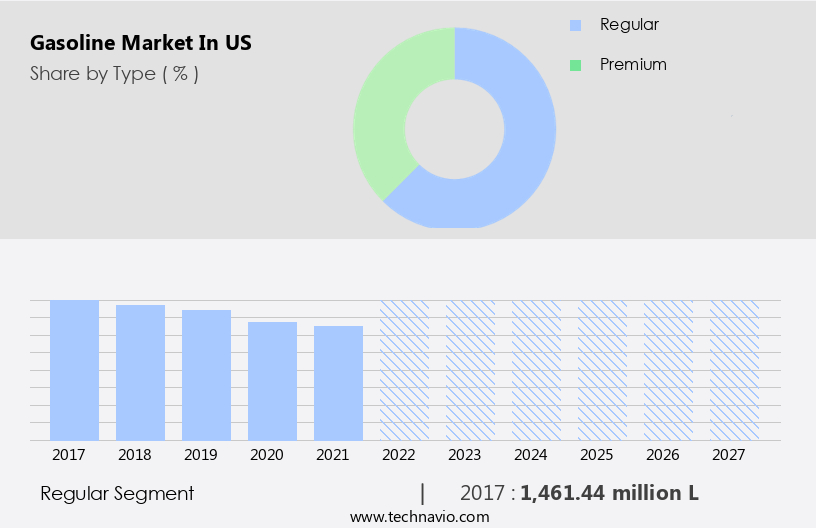
The Regular segment was valued at  USD 1,461.44 mn L in 2017 and showed a gradual increase during the forecast period.

Market Dynamics

Our researchers analyzed the data with 2022 as the base year, along with the key drivers, trends, and challenges. A holistic analysis of drivers will help companies refine their marketing strategies to gain a competitive advantage.

What are the US Gasoline Market drivers leading to the rise in adoption of the Industry?

  • The significant growth in the usage of automobiles is the primary factor fueling market expansion. 
  • The US gasoline market plays a significant role in the country's energy sector, with gasoline being the primary fuel for powering internal combustion engines in various vehicles, including passenger cars, two-wheelers, and light trucks. To ensure optimal engine performance and prevent damage, it is crucial that gasoline burns smoothly without knocking or premature detonation. In 2020, the US Energy Information Administration reported that the transportation sector was the largest consumer of petroleum products, accounting for over 60% of total petroleum consumption. Within this sector, gasoline was the most widely used petroleum product, representing approximately 90% of the transportation sector's petroleum consumption.
  • This strong dependence on gasoline underscores the importance of the automobile industry to the US economy. The consumption of gasoline is influenced by the number of passenger cars and light trucks in operation, as well as environmental regulations, fuel technology, and gasoline blending regulations. Alternative fuels, such as electric vehicles, are gaining popularity, but gasoline remains a dominant player in the market. Fuel additives and vehicle emissions standards also impact gasoline demand. Government regulations continue to shape the market dynamics, emphasizing fuel security and reducing emissions.

What are the US Gasoline Market trends shaping the Industry?

  • The current market trend indicates a significant increase in oil production. This upward trend is a noteworthy development in the energy sector.
  • The global gasoline market has experienced significant growth due to increased crude oil production in key regions, including the US and Canada. This expansion in production has resulted in a larger gasoline supply, leading to lower prices and heightened consumption. According to the US Energy Information Administration, US crude oil production surged from 8.8 million barrels per day in 2014 to 11.6 million barrels per day in 2022. A substantial portion of this increase originated from the Permian Basin in Texas and New Mexico. Parallelly, Canadian oil production has been on an upward trend over the past decade, with the country producing approximately 4 million barrels per day in 2022.
  • Consumer behavior is also influencing the gasoline market, with a growing emphasis on climate change mitigation and sustainability. Renewable fuels, such as ethanol blending and biodiesel, are gaining popularity. Additionally, the adoption of fuel cell vehicles, hybrid vehicles, and green gasoline is increasing. Fuel innovation, including advancements in fuel injection systems and fuel handling, is also contributing to market growth. Pipeline infrastructure remains a crucial factor in the gasoline market, ensuring the efficient transportation of fuel from production sites to consumers. Fuel marketing strategies continue to evolve, with companies focusing on improving gasoline quality and meeting the evolving needs of consumers.
  • The gasoline market is expected to continue its growth trajectory, driven by these market dynamics and the ongoing shift towards cleaner, more sustainable energy sources.

How does US Gasoline Market face challenges during its growth?

  • The volatile gasoline prices pose a significant challenge to the industry's growth trajectory. 
  • The gasoline market in the US is influenced by several factors that impact its growth. One significant factor is the price of gasoline compared to other fuels. When prices rise, consumers may reduce their consumption or even switch to alternative fuels, leading to decreased demand and slower market growth. Crude oil prices, supply and demand, geopolitical tensions, and weather events are among the factors that can influence gasoline prices. According to the US Energy Information Administration, the average retail price of regular gasoline in the US was USD2.25 per gallon in 2020, a 44% decrease from the previous year.
  • Another factor that affects the gasoline market is fuel economy. Consumers are increasingly seeking vehicles with better fuel efficiency to save money on gasoline. Fuel storage and distribution also play a role in market dynamics, with regional variations in fuel quality control and engine performance affecting consumer preferences. The petroleum industry is responding to these trends by investing in sustainable fuels, such as biofuel additives and reformulated gasoline, to improve fuel quality and reduce reliance on crude oil. Fuel taxes and energy security concerns also influence market dynamics. Overall, the gasoline market in the US is subject to various market forces, requiring ongoing analysis and adaptation by industry stakeholders.

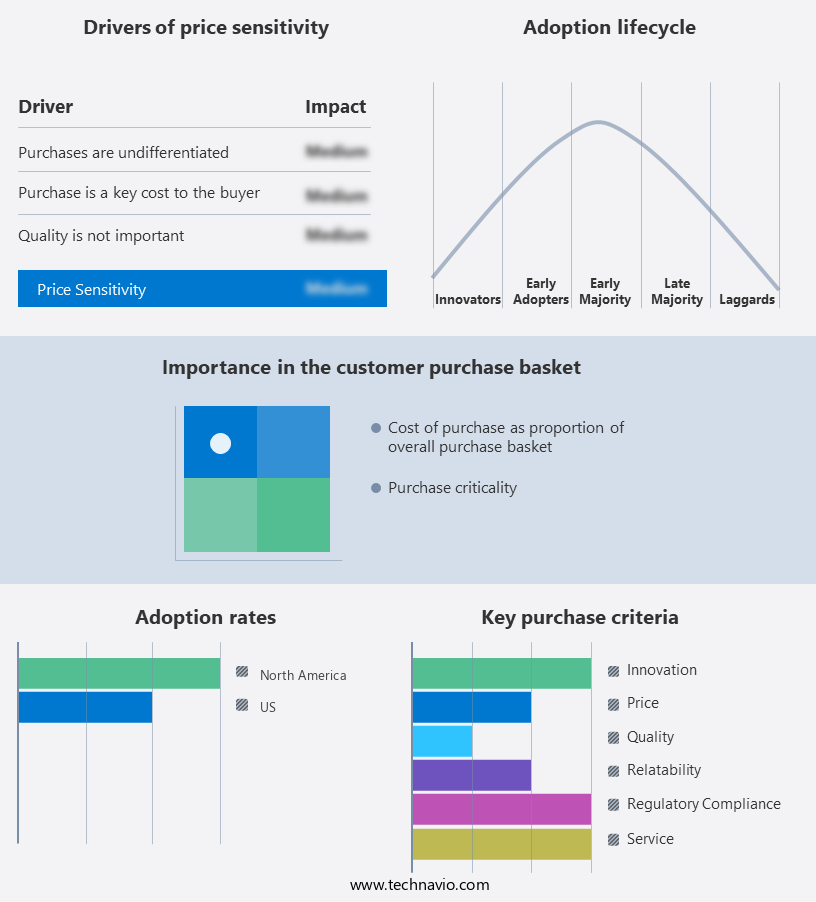
Exclusive US Gasoline Market Customer Landscape

The market forecasting report includes the adoption lifecycle of the market, covering from the innovator's stage to the laggard's stage. It focuses on adoption rates in different regions based on penetration. Furthermore, the report also includes key purchase criteria and drivers of price sensitivity to help companies evaluate and develop their market growth analysis strategies.

Gasoline Market in US Share by Geography

 Customer Landscape

Key Companies & Market Insights

Companies are implementing various strategies, such as strategic alliances, market forecast partnerships, mergers and acquisitions, geographical expansion, and product/service launches, to enhance their presence in the market.

The market research and growth report includes detailed analyses of the competitive landscape of the market and information about key companies, including:

  • Abraxas
  • BP Plc
  • Chesapeake Energy Corp
  • Chevron Corp.
  • ConocoPhillips Co.
  • Delek US Holdings Inc.
  • Devon Energy Corp
  • Enterprise Products Partners LP
  • EOG Resources Inc
  • Exxon Mobil Corp.
  • Marathon Petroleum Corp.
  • Occidental Petroleum Corp.
  • Ovintiv Inc.
  • Phillips 66
  • Pioneer Natural Resources Co
  • Schlumberger Ltd.
  • Shell plc
  • SouthWestern Energy Co.
  • Sunoco LP
  • Valero Energy Corp.

Qualitative and quantitative analysis of companies has been conducted to help clients understand the wider business environment as well as the strengths and weaknesses of key market players. Data is qualitatively analyzed to categorize companies as pure play, category-focused, industry-focused, and diversified; it is quantitatively analyzed to categorize companies as dominant, leading, strong, tentative, and weak.

Recent Development and News in Gasoline Market In US

  • In March 2023, ExxonMobil and BP announced a strategic collaboration to build three hydrogen production facilities in the US, marking a significant stride towards the decarbonization of the gasoline market. The partnership aims to produce up to 10 million tons per year of blue hydrogen, which is produced using natural gas with carbon capture and storage technology (ExxonMobil press release, 2023).
  • In August 2024, Tesla, the electric vehicle (EV) market leader, unveiled its new Supercharger V3, capable of delivering up to 25 miles of range per minute. This rapid charging technology is expected to further accelerate the shift from gasoline-powered vehicles towards EVs, potentially disrupting the traditional gasoline market (Tesla press release, 2024).
  • In November 2024, the US Environmental Protection Agency (EPA) approved the use of 15% ethanol (E15) fuel year-round, expanding the market for bioethanol-blended gasoline. This decision is expected to reduce greenhouse gas emissions and increase the use of renewable energy sources in the transportation sector (EPA press release, 2024).
  • In January 2025, Shell and Chevron announced a joint venture to construct a major refinery in Pennsylvania, representing a significant investment in the US gasoline market. The new refinery, with an estimated capacity of 300,000 barrels per day, will help meet the growing demand for gasoline in the region (Shell and Chevron press release, 2025).

Research Analyst Overview

The global gasoline market is a dynamic and evolving entity, influenced by various factors that shape its landscape and applications across diverse sectors. Climate change and consumer behavior are two significant drivers shaping the market's trajectory. The adoption of green gasoline, renewable fuels, and sustainable fuels is on the rise, driven by increasing environmental consciousness and regulatory pressures. Fuel injection systems and fuel handling technologies continue to advance, optimizing fuel efficiency and reducing carbon emissions. Fuel cell vehicles and hybrid vehicles are gaining popularity, further disrupting the traditional gasoline market. Ethanol blending and biofuel additives are becoming increasingly common, as the petroleum industry explores alternatives to crude oil.

Gasoline quality, pipeline infrastructure, and fuel marketing are essential components of the market, with fuel innovation and fuel technology playing a crucial role in enhancing fuel economy and engine performance. Fuel consumption patterns are subject to regional variations, influenced by factors such as energy security, fuel pricing strategies, and government regulations. Fuel efficiency standards, emissions regulations, and fuel safety are critical concerns for the energy sector, with geopolitical influences and fuel volatility adding complexity to the market. The petroleum industry is continually adapting to these challenges, implementing reformulated gasoline and gasoline blending regulations to meet evolving consumer demands and regulatory requirements.

Brand loyalty and fuel blends remain essential factors in the gasoline retailing and distribution landscape, with fuel taxes and fuel pricing strategies influencing consumer behavior and market dynamics. The gasoline supply chain is subject to numerous influences, including fuel efficiency standards, fuel technology, and alternative fuels, such as electric vehicles and alternative fuel additives. In summary, the gasoline market is a complex and dynamic entity, shaped by a multitude of factors that include climate change, consumer behavior, global market trends, and technological innovations. The ongoing unfolding of market activities and evolving patterns underscores the importance of continuous research and analysis to stay abreast of the latest developments and trends.

Dive into Technavio's robust research methodology, blending expert interviews, extensive data synthesis, and validated models for unparalleled Gasoline Market in US insights. See full methodology.

Market Scope

Report Coverage

Details

Page number

128

Base year

2022

Historic period

2017-2021

Forecast period

2023-2027

Growth momentum & CAGR

Decelerate at a CAGR of -4.18%

Market growth 2023-2027

-258 mn L

Market structure

Fragmented

YoY growth 2022-2023(%)

-3.81

Competitive landscape

Leading Companies, Market Positioning of Companies, Competitive Strategies, and Industry Risks

Request Free Sample

What are the Key Data Covered in this Market Research Report?

  • CAGR of the market during the forecast period
  • Detailed information on factors that will drive the market growth and forecasting between 2023 and 2027
  • Precise estimation of the size of the market  and its contribution of the market in focus to the parent market
  • Accurate predictions about upcoming market growth and trends and changes in consumer behaviour
  • Growth of the market across US
  • Thorough analysis of the market's competitive landscape and detailed information about companies
  • Comprehensive analysis of factors that will challenge the growth of market companies

We can help! Our analysts can customize this market research report to meet your requirements Get in touch

1 Executive Summary

  • 1.1 Market overview
    • Exhibit 01: Executive Summary – Chart on Market Overview
    • Exhibit 02: Executive Summary – Data Table on Market Overview
    • Exhibit 03: Executive Summary – Chart on Country Market Characteristics
    • Exhibit 04: Executive Summary – Chart on Market Segmentation by Type
    • Exhibit 05: Executive Summary – Chart on Market Segmentation by End-user
    • Exhibit 06: Executive Summary – Chart on Vendor Market Positioning

2 Market Landscape

  • 2.1 Market ecosystem
    • Exhibit 07: Parent market
    • Exhibit 08: Market Characteristics

3 Market Sizing

  • 3.1 Market definition
    • Exhibit 09: Offerings of vendors included in the market definition
  • 3.2 Market segment analysis
    • Exhibit 10: Market segments
  • 3.3 Market size 2022
    • 3.4 Market outlook: Forecast for 2022-2027
      • Exhibit 11: Chart on US - Market size and forecast 2022-2027 (million L)
      • Exhibit 12: Data Table on US - Market size and forecast 2022-2027 (million L)
      • Exhibit 13: Chart on US: Year-over-year growth 2022-2027 (%)
      • Exhibit 14: Data Table on US: Year-over-year growth 2022-2027 (%)

    4 Historic Market Size

    • 4.1 Gasoline market in US 2017 - 2021
      • Exhibit 15: Historic Market Size – Data Table on Gasoline market in US 2017 - 2021 (million L)
    • 4.2 Type Segment Analysis 2017 - 2021
      • Exhibit 16: Historic Market Size – Type Segment 2017 - 2021 (million L)
    • 4.3 End-user Segment Analysis 2017 - 2021
      • Exhibit 17: Historic Market Size – End-user Segment 2017 - 2021 (million L)

    5 Five Forces Analysis

    • 5.1 Five forces summary
      • Exhibit 18: Five forces analysis - Comparison between 2022 and 2027
    • 5.2 Bargaining power of buyers
      • Exhibit 19: Chart on Bargaining power of buyers – Impact of key factors 2022 and 2027
    • 5.3 Bargaining power of suppliers
      • Exhibit 20: Bargaining power of suppliers – Impact of key factors in 2022 and 2027
    • 5.4 Threat of new entrants
      • Exhibit 21: Threat of new entrants – Impact of key factors in 2022 and 2027
    • 5.5 Threat of substitutes
      • Exhibit 22: Threat of substitutes – Impact of key factors in 2022 and 2027
    • 5.6 Threat of rivalry
      • Exhibit 23: Threat of rivalry – Impact of key factors in 2022 and 2027
    • 5.7 Market condition
      • Exhibit 24: Chart on Market condition - Five forces 2022 and 2027

    6 Market Segmentation by Type

    • 6.1 Market segments
      • Exhibit 25: Chart on Type - Market share 2022-2027 (%)
      • Exhibit 26: Data Table on Type - Market share 2022-2027 (%)
    • 6.2 Comparison by Type
      • Exhibit 27: Chart on Comparison by Type
      • Exhibit 28: Data Table on Comparison by Type
    • 6.3 Regular - Market size and forecast 2022-2027
      • Exhibit 29: Chart on Regular- Market size and forecast 2022-2027 (million L)
      • Exhibit 30: Data Table on Regular- Market size and forecast 2022-2027 (million L)
      • Exhibit 31: Chart on Regular- Year-over-year growth 2022-2027 (%)
      • Exhibit 32: Data Table on Regular- Year-over-year growth 2022-2027 (%)
    • 6.4 Premium - Market size and forecast 2022-2027
      • Exhibit 33: Chart on Premium- Market size and forecast 2022-2027 (million L)
      • Exhibit 34: Data Table on Premium- Market size and forecast 2022-2027 (million L)
      • Exhibit 35: Chart on Premium- Year-over-year growth 2022-2027 (%)
      • Exhibit 36: Data Table on Premium- Year-over-year growth 2022-2027 (%)
    • 6.5 Market opportunity by Type
      • Exhibit 37: Market opportunity by Type (million L)
      • Exhibit 38: Data Table on Market opportunity by Type (million L)

    7 Market Segmentation by End-user

    • 7.1 Market segments
      • Exhibit 39: Chart on End-user - Market share 2022-2027 (%)
      • Exhibit 40: Data Table on End-user - Market share 2022-2027 (%)
    • 7.2 Comparison by End-user
      • Exhibit 41: Chart on Comparison by End-user
      • Exhibit 42: Data Table on Comparison by End-user
    • 7.3 Transportation - Market size and forecast 2022-2027
      • Exhibit 43: Chart on Transportation- Market size and forecast 2022-2027 (million L)
      • Exhibit 44: Data Table on Transportation- Market size and forecast 2022-2027 (million L)
      • Exhibit 45: Chart on Transportation- Year-over-year growth 2022-2027 (%)
      • Exhibit 46: Data Table on Transportation- Year-over-year growth 2022-2027 (%)
    • 7.4 Power generation - Market size and forecast 2022-2027
      • Exhibit 47: Chart on Power generation- Market size and forecast 2022-2027 (million L)
      • Exhibit 48: Data Table on Power generation- Market size and forecast 2022-2027 (million L)
      • Exhibit 49: Chart on Power generation- Year-over-year growth 2022-2027 (%)
      • Exhibit 50: Data Table on Power generation- Year-over-year growth 2022-2027 (%)
    • 7.5 Others - Market size and forecast 2022-2027
      • Exhibit 51: Chart on Others- Market size and forecast 2022-2027 (million L)
      • Exhibit 52: Data Table on Others- Market size and forecast 2022-2027 (million L)
      • Exhibit 53: Chart on Others- Year-over-year growth 2022-2027 (%)
      • Exhibit 54: Data Table on Others- Year-over-year growth 2022-2027 (%)
    • 7.6 Market opportunity by End-user
      • Exhibit 55: Market opportunity by End-user (million L)
      • Exhibit 56: Data Table on Market opportunity by End-user (million L)

    8 Customer Landscape

    • 8.1 Customer landscape overview
      • Exhibit 57: Analysis of price sensitivity, lifecycle, customer purchase basket, adoption rates, and purchase criteria

    9 Drivers, Challenges, and Trends

    • 9.1 Market drivers
      • 9.2 Market challenges
        • 9.3 Impact of drivers and challenges
          • Exhibit 58: Impact of drivers and challenges in 2022 and 2027
        • 9.4 Market trends

          10 Vendor Landscape

          • 10.1 Overview
            • 10.2 Vendor landscape
              • Exhibit 59: Overview on Criticality of inputs and Factors of differentiation
            • 10.3 Landscape disruption
              • Exhibit 60: Overview on factors of disruption
            • 10.4 Industry risks
              • Exhibit 61: Impact of key risks on business

            11 Vendor Analysis

            • 11.1 Vendors covered
              • Exhibit 62: Vendors covered
            • 11.2 Market positioning of vendors
              • Exhibit 63: Matrix on vendor position and classification
            • 11.3 Abraxas
              • Exhibit 64: Abraxas - Overview
              • Exhibit 65: Abraxas - Product / Service
              • Exhibit 66: Abraxas - Key offerings
            • 11.4 BP Plc
              • Exhibit 67: BP Plc - Overview
              • Exhibit 68: BP Plc - Business segments
              • Exhibit 69: BP Plc - Key offerings
              • Exhibit 70: BP Plc - Segment focus
            • 11.5 Chevron Corp.
              • Exhibit 71: Chevron Corp. - Overview
              • Exhibit 72: Chevron Corp. - Business segments
              • Exhibit 73: Chevron Corp. - Key news
              • Exhibit 74: Chevron Corp. - Key offerings
              • Exhibit 75: Chevron Corp. - Segment focus
            • 11.6 ConocoPhillips Co.
              • Exhibit 76: ConocoPhillips Co. - Overview
              • Exhibit 77: ConocoPhillips Co. - Business segments
              • Exhibit 78: ConocoPhillips Co. - Key offerings
              • Exhibit 79: ConocoPhillips Co. - Segment focus
            • 11.7 Enterprise Products Partners LP
              • Exhibit 80: Enterprise Products Partners LP - Overview
              • Exhibit 81: Enterprise Products Partners LP - Product / Service
              • Exhibit 82: Enterprise Products Partners LP - Key offerings
            • 11.8 EOG Resources Inc
              • Exhibit 83: EOG Resources Inc - Overview
              • Exhibit 84: EOG Resources Inc - Product / Service
              • Exhibit 85: EOG Resources Inc - Key offerings
            • 11.9 Exxon Mobil Corp.
              • Exhibit 86: Exxon Mobil Corp. - Overview
              • Exhibit 87: Exxon Mobil Corp. - Business segments
              • Exhibit 88: Exxon Mobil Corp. - Key news
              • Exhibit 89: Exxon Mobil Corp. - Key offerings
              • Exhibit 90: Exxon Mobil Corp. - Segment focus
            • 11.10 Marathon Petroleum Corp.
              • Exhibit 91: Marathon Petroleum Corp. - Overview
              • Exhibit 92: Marathon Petroleum Corp. - Business segments
              • Exhibit 93: Marathon Petroleum Corp. - Key news
              • Exhibit 94: Marathon Petroleum Corp. - Key offerings
              • Exhibit 95: Marathon Petroleum Corp. - Segment focus
            • 11.11 Occidental Petroleum Corp.
              • Exhibit 96: Occidental Petroleum Corp. - Overview
              • Exhibit 97: Occidental Petroleum Corp. - Business segments
              • Exhibit 98: Occidental Petroleum Corp. - Key offerings
              • Exhibit 99: Occidental Petroleum Corp. - Segment focus
            • 11.12 Phillips 66
              • Exhibit 100: Phillips 66 - Overview
              • Exhibit 101: Phillips 66 - Business segments
              • Exhibit 102: Phillips 66 - Key offerings
              • Exhibit 103: Phillips 66 - Segment focus
            • 11.13 Pioneer Natural Resources Co
              • Exhibit 104: Pioneer Natural Resources Co - Overview
              • Exhibit 105: Pioneer Natural Resources Co - Product / Service
              • Exhibit 106: Pioneer Natural Resources Co - Key offerings
            • 11.14 Schlumberger Ltd.
              • Exhibit 107: Schlumberger Ltd. - Overview
              • Exhibit 108: Schlumberger Ltd. - Business segments
              • Exhibit 109: Schlumberger Ltd. - Key news
              • Exhibit 110: Schlumberger Ltd. - Key offerings
              • Exhibit 111: Schlumberger Ltd. - Segment focus
            • 11.15 Shell plc
              • Exhibit 112: Shell plc - Overview
              • Exhibit 113: Shell plc - Business segments
              • Exhibit 114: Shell plc - Key news
              • Exhibit 115: Shell plc - Key offerings
              • Exhibit 116: Shell plc - Segment focus
            • 11.16 Sunoco LP
              • Exhibit 117: Sunoco LP - Overview
              • Exhibit 118: Sunoco LP - Product / Service
              • Exhibit 119: Sunoco LP - Key offerings
            • 11.17 Valero Energy Corp.
              • Exhibit 120: Valero Energy Corp. - Overview
              • Exhibit 121: Valero Energy Corp. - Business segments
              • Exhibit 122: Valero Energy Corp. - Key news
              • Exhibit 123: Valero Energy Corp. - Key offerings
              • Exhibit 124: Valero Energy Corp. - Segment focus

            12 Appendix

            • 12.1 Scope of the report
              • 12.2 Inclusions and exclusions checklist
                • Exhibit 125: Inclusions checklist
                • Exhibit 126: Exclusions checklist
              • 12.3 Currency conversion rates for US$
                • Exhibit 127: Currency conversion rates for US$
              • 12.4 Research methodology
                • Exhibit 128: Research methodology
                • Exhibit 129: Validation techniques employed for market sizing
                • Exhibit 130: Information sources
              • 12.5 List of abbreviations
                • Exhibit 131: List of abbreviations

              Research Methodology

              Technavio presents a detailed picture of the market by way of study, synthesis, and summation of data from multiple sources. The analysts have presented the various facets of the market with a particular focus on identifying the key industry influencers. The data thus presented is comprehensive, reliable, and the result of extensive research, both primary and secondary.

              INFORMATION SOURCES

              Primary sources

              • Manufacturers and suppliers
              • Channel partners
              • Industry experts
              • Strategic decision makers

              Secondary sources

              • Industry journals and periodicals
              • Government data
              • Financial reports of key industry players
              • Historical data
              • Press releases

              DATA ANALYSIS

              Data Synthesis

              • Collation of data
              • Estimation of key figures
              • Analysis of derived insights

              Data Validation

              • Triangulation with data models
              • Reference against proprietary databases
              • Corroboration with industry experts

              REPORT WRITING

              Qualitative

              • Market drivers
              • Market challenges
              • Market trends
              • Five forces analysis

              Quantitative

              • Market size and forecast
              • Market segmentation
              • Geographical insights
              • Competitive landscape

              Interested in this report?

              Get your sample now to see our research methodology and insights!

              Download Now

              Frequently Asked Questions

              Gasolinein US market growth will increase by -258 mn L during 2023-2027 .

              The Gasolinein US market is expected to grow at a CAGR of -4.18% during 2023-2027 .

              Gasolinein US market is segmented by Type( Regular, Premium) End-user( Transportation, Power generation, Others)

              Abraxas, BP Plc, Chesapeake Energy Corp, Chevron Corp., ConocoPhillips Co., Delek US Holdings Inc., Devon Energy Corp, Enterprise Products Partners LP, EOG Resources Inc, Exxon Mobil Corp., Marathon Petroleum Corp., Occidental Petroleum Corp., Ovintiv Inc., Phillips 66, Pioneer Natural Resources Co, Schlumberger Ltd., Shell plc, Southwestern Energy Co., Sunoco LP, Valero Energy Corp. are a few of the key vendors in the Gasolinein US market.

              North America will register the highest growth rate of 100% among the other regions. Therefore, the Gasolinein US market in North America is expected to garner significant business opportunities for the vendors during the forecast period.

              US, North America

              • Increasing number of automobilesGasoline is primarily used to power internal combustion engines in passenger cars is the driving factor this market.
              • two-wheelers is the driving factor this market.
              • and light trucks is the driving factor this market.
              • among other vehicles. To achieve performance inefficiency and avoid engine damage is the driving factor this market.
              • gasoline must burn smoothly without knocking or premature detonation. According to US Energy Information Administration is the driving factor this market.
              • in 2020 is the driving factor this market.
              • the transportation sector was the largest consumer of petroleum products in US is the driving factor this market.
              • accounting for more than 60% of total petroleum consumption. Within the transportation sector is the driving factor this market.
              • gasoline was the most widely used petroleum product is the driving factor this market.
              • accounting for more than 90% of transportation sector petroleum consumption. This indicates the strong dependence of the automobile industry on gasoline. The consumption of gasoline depends on the number of passenger cars and light trucks in operation. Urbanization and an increase in disposable income enhance the adoption rate of passenger vehicles. According to the World Bank Group is the driving factor this market.
              • the gross domestic product per capita in US was $62 is the driving factor this market.
              • 823 in 2018 is the driving factor this market.
              • which increased to $70 is the driving factor this market.
              • 248 in 2021. This indicates an increase in the purchasing power of people. Also is the driving factor this market.
              • with rapid urbanization is the driving factor this market.
              • road networks are expanded and modernized. These factors help increase the adoption of passenger cars and light trucks. Passenger car production volumes grew by 9.67% in 2021 compared with 2020. According to US Energy Information Administration (EIA) is the driving factor this market.
              • 123 billion gallons of motor gasoline were consumed in US in 2020 is the driving factor this market.
              • which accounted for 59% of the total transportation fuel consumption. Light-duty vehicles such as cars is the driving factor this market.
              • small trucks is the driving factor this market.
              • and utility vehicles accounted for 92% of all gasoline consumption in US in 2020. Therefore is the driving factor this market.
              • the increase in the number of registered vehicles is expected to drive the growth of the gasoline market in US during the forecast period. is the driving factor this market.

              The Gasolinein US market vendors should focus on grabbing business opportunities from the Regular segment as it accounted for the largest market share in the base year.