Industrial Machinery Remanufacturing Market Analysis, Size, and Forecast 2025-2029: North America (US and Canada), Europe (Germany, Italy, and UK), APAC (China, India, Japan, and South Korea), South America (Brazil), and Rest of World (ROW)

Industrial Machinery Remanufacturing Market Analysis, Size, and Forecast 2025-2029:
North America (US and Canada), Europe (Germany, Italy, and UK), APAC (China, India, Japan, and South Korea), South America (Brazil), and Rest of World (ROW)

Published: Feb 2025 258 Pages SKU: IRTNTR72153

Market Overview at a Glance

$895.8 B
Market Opportunity
25.5%
CAGR
20.0
YoY growth 2024-2025(%)

Industrial Machinery Remanufacturing Market Size 2025-2029

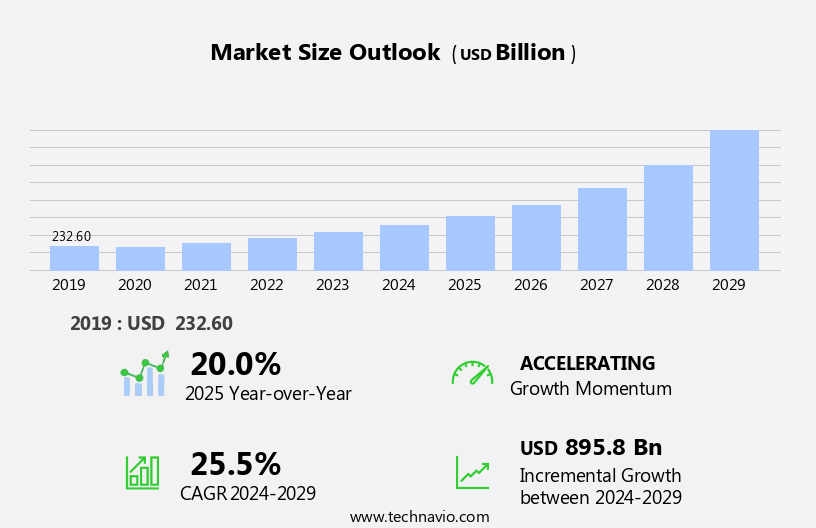
The industrial machinery remanufacturing market size is forecast to increase by USD 895.8 billion, at a CAGR of 25.5% between 2024 and 2029. The market is experiencing significant growth due to the increasing emphasis on asset utilization in manufacturing industries.

Major Market Trends & Insights

  • APAC dominated the market and accounted for a 41% share in 2023.
  • The market is expected to grow significantly in North America region as well over the forecast period.
  • Based on the Application, the automotive segment led the market and was valued at USD 116.00 billion of the global revenue in 2023.
  • Based on the End-user, the OEM segment accounted for the largest market revenue share in 2023.

Market Size & Forecast

  • Market Opportunities: USD 425.00 Billion
  • Future Opportunities: USD 895.8 Billion
  • CAGR (2024-2029): 25.5%
  • APAC: Largest market in 2023

The market continues to evolve, driven by advancements in technology and the growing demand for sustainable manufacturing solutions. This dynamic market encompasses various processes, including machinery disassembly, performance enhancement, and rebuilding, to name a few. For instance, digital twinning, a process that creates a virtual replica of physical machinery, enables predictive maintenance and process optimization. This leads to extended lifespans and cost reduction for industrial equipment. In fact, the industrial remanufacturing market is projected to grow by 6% annually, as companies increasingly embrace the circular economy. Robotic automation and additive manufacturing are transforming the remanufacturing process. Machinery disassembly, once a labor-intensive task, is now streamlined through the use of robots.

What will be the Size of the Industrial Machinery Remanufacturing Market during the forecast period?

Industrial Machinery Remanufacturing Market Size

Explore in-depth regional segment analysis with market size data - historical 2019-2023 and forecasts 2025-2029 - in the full report.  
Request Free Sample

Surface treatment and electrical upgrades ensure safety standards are met, while precision machining and component refurbishment restore machinery to optimal functionality. Moreover, process optimization and regulatory compliance are essential aspects of the remanufacturing industry. Machine diagnostics and failure analysis enable manufacturers to identify and address issues before they become costly repairs. Material science plays a crucial role in ensuring the quality of rebuilt machinery and components. An example of the market's continuous unfolding can be seen in the aviation industry. Boeing reported a 30% increase in sales from its commercial aviation services division, driven by the growing demand for maintenance, repair, and overhaul services. 

This trend is expected to continue as more industries adopt remanufacturing practices to reduce costs and improve resource efficiency. In conclusion, the market is a constantly evolving landscape. From digital twinning and machinery disassembly to performance enhancement and cost reduction, the industry continues to adapt and innovate, driving growth and sustainability in manufacturing processes.

With the rising adoption of repair and remanufacturing practices, companies are extending the lifespan of their industrial machinery, reducing costs, and minimizing environmental impact. The increasing demand for asset utilization in manufacturing industries is driving the need for cost-effective repair and remanufacturing solutions for various machinery types, including semiconductor equipment, packaging, construction machinery, plastic, glass, rubber, textile, robotics, automation, pumps, thermal spray, and steel cladding. However, the high initial capital investment required for industrial machinery remanufacturing presents a significant challenge for market entrants. Despite this, the potential for cost savings and increased operational efficiency make this market an attractive proposition for businesses seeking to optimize their manufacturing processes.

Companies that can navigate the capital investment hurdle and effectively manage the remanufacturing process will be well-positioned to capitalize on the growing demand for sustainable manufacturing solutions.

How is this Industrial Machinery Remanufacturing Industry segmented?

The industrial machinery remanufacturing industry research report provides comprehensive data (region-wise segment analysis), with forecasts and estimates in "USD billion" for the period 2025-2029, as well as historical data from 2019-2023 for the following segments.

  • Application
    • Automotive
    • Defense
    • Food and beverage
    • Aerospace
    • Others
  • End-user
    • OEM
    • Aftermarket
  • Product
    • Repair and replacement
    • Disassembly and cleaning
    • Inspection and testing
    • Reassembly and upgrading
  • Type
    • Heavy industrial equipment
    • Construction machinery
    • Agricultural machinery
    • Mining equipment
    • Others
  • Geography
    • North America
      • US
      • Canada
    • Europe
      • Germany
      • Italy
      • UK
    • APAC
      • China
      • India
      • Japan
      • South Korea
    • South America
      • Brazil
    • Rest of World (ROW)

By Application Insights

The automotive segment is estimated to witness significant growth during the forecast period. The segment was valued at USD 116.00 billion in 2023. It continued to the largest segment at a CAGR of 14.40%.

The market is experiencing significant growth, driven by the adoption of advanced technologies and the circular economy's principles. Digital twinning, a technology that creates a virtual replica of machinery, enables predictive maintenance, reducing downtime and maintenance costs. Machinery disassembly, a critical process in remanufacturing, is being optimized through robotic automation and 3D printing, enhancing performance and precision. Surface treatment and electrical upgrades improve machinery's functionality and safety standards. Performance enhancement through process optimization and component refurbishment extends the machinery's lifespan, contributing to supply chain resilience. Additive manufacturing, or 3D printing, enables the production of complex parts that are difficult or impossible to manufacture using traditional methods.

Regulatory compliance and safety standards are essential factors driving the market's growth. For instance, the European Union's End-of-Life Vehicles (ELV) Directive mandates the reuse, recycling, and recovery of 95% of a vehicle's weight by 2015. This directive has led to an increase in the demand for remanufactured automotive parts, which now account for over 70% of the market. The remanufacturing process involves various techniques, including precision machining, functional testing, wear assessment, and reverse engineering. Material science plays a crucial role in the process, ensuring the quality of the rebuilt machinery. Failure analysis and machine diagnostics help identify potential issues before they become significant problems.

In conclusion, the market is witnessing a surge in growth due to the adoption of advanced technologies, regulatory compliance, and the circular economy's principles. The market's dynamics are harmonious, with companies focusing on cost reduction, resource efficiency, and extended lifespan. For example, CNC machining, a common remanufacturing technique, can save up to 85% of the raw materials used in manufacturing new parts. The market is expected to grow at a steady pace, with industry experts predicting a 15% increase in demand for remanufactured machinery and components by 2025.

Industrial Machinery Remanufacturing Market Size

Request Free Sample

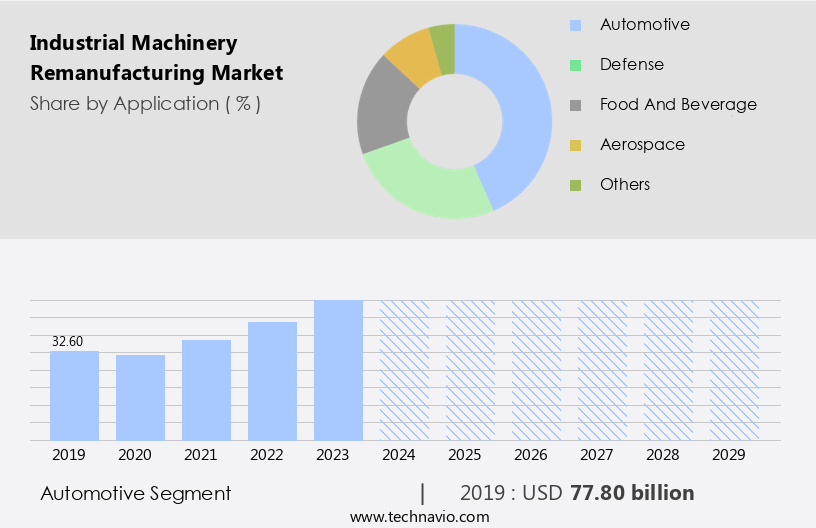
The Automotive segment was valued at USD 77.80 billion in 2019 and showed a gradual increase during the forecast period.

Regional Analysis

APAC is estimated to contribute 41% to the growth of the global market during the forecast period. Data suggests that the future opportunities for growth in the APAC region estimates to be around USD 895.8 billion. Technavio's analysts have elaborately explained the regional trends and drivers that shape the market during the forecast period.

Industrial Machinery Remanufacturing Market Share by Geography

 Request Free Sample

The market in APAC is experiencing significant growth due to the region's rapid industrialization and urbanization. This expansion is particularly notable in the food and beverage industry, where increasing population, economic development, and rising farmer purchasing power are driving demand. In APAC, China, Singapore, and India are the leading countries in this market. The region's economic growth, particularly in China and India, has resulted in increased industrialization, leading to a substantial demand for cost-effective and reliable machinery solutions. Additionally, growing environmental awareness has encouraged companies to adopt sustainable practices, such as performance enhancement through digital twinning, machinery disassembly, and additive manufacturing.

Robotic automation, surface treatment, and process optimization are also essential in enhancing machinery efficiency and reducing resource consumption. The industrial remanufacturing process includes electrical upgrades, safety standards compliance, and industrial automation to ensure machinery operates at optimal levels. Predictive maintenance, wear assessment, and failure analysis are crucial components of the remanufacturing process, ensuring machinery remains functional and productive. The industry is expected to grow by over 10% annually, with circular economy principles, mechanical restoration, hydraulic repair, and extended lifespan being key trends. Companies are focusing on rebuilt machinery, precision machining, component refurbishment, reverse engineering, parts replacement, engine rebuilding, machine diagnostics, material science, and quality control to reduce costs and improve supply chain resilience.

Market Dynamics

Our researchers analyzed the data with 2024 as the base year, along with the key drivers, trends, and challenges. A holistic analysis of drivers will help companies refine their marketing strategies to gain a competitive advantage.

The market is experiencing significant growth as businesses seek to optimize their operations and reduce costs. This process involves the restoration of used or worn-out industrial equipment through a series of techniques, including precision machining, CNC machining, and robotic automation for remanufacturing processes. Heavy equipment component refurbishment is a crucial aspect of this market, ensuring the extended lifespan of industrial machinery and resource efficiency. Remanufacturing process optimization techniques play a vital role in this industry, with digital twinning and advanced material selection for remanufacturing being key areas of focus. Digital twinning enables the creation of virtual replicas of industrial equipment, allowing for predictive maintenance and failure analysis. Advanced material selection ensures the use of high-performance materials in the remanufacturing process, resulting in machinery that meets or even surpasses original equipment specifications. Certified remanufacturing facilities adhere to strict quality control procedures and safety and regulatory compliance guidelines, ensuring the production of top-quality remanufactured machinery.

Sustainability initiatives are also a significant factor in the market, with the process reducing the environmental impact of industrial production by minimizing the need for new machinery and raw materials. Cost-benefit analysis is a critical consideration for businesses looking to invest in remanufacturing services. The cost savings from remanufacturing can be substantial, with the potential for significant reductions in both upfront capital expenditures and ongoing operational costs. Additionally, supply chain resilience is enhanced through the use of remanufactured machinery, as it provides a reliable source of spare parts and reduces the risk of supply chain disruptions. In conclusion, the market offers numerous benefits for businesses, including cost savings, extended equipment lifespan, resource efficiency, and sustainability. Through the use of advanced techniques such as precision machining, digital twinning, and robotic automation, remanufacturing provides a viable alternative to new machinery for many industries.

What are the key market drivers leading to the rise in the adoption of Industrial Machinery Remanufacturing Industry?

  • In manufacturing industries, the escalating need to maximize asset utilization serves as the primary market driver, given the rising demand for increased efficiency and productivity. 
  • Industrial machinery remanufacturing is a growing market as end-users prioritize upgrading existing machinery to enhance efficiency, cut operational costs, and integrate operational functions. The trend is driven by increasing awareness of energy savings and stricter government regulations on energy consumption. For instance, the replacement of old centrifugal pumps with energy-efficient models can significantly reduce energy consumption. The efficiency of industrial machinery hinges on the impeller and head, which determine the amount of fluid moved by the motor.
  • By investing in appropriate industrial machinery, manufacturers can boost operational efficiency and save energy. According to recent industry reports, the global industrial machinery market is projected to expand by over 5% annually, underscoring its significant growth potential.

What are the market trends shaping the Industrial Machinery Remanufacturing Industry?

  • The increasing adoption of repair and remanufacturing practices is becoming a prominent trend in the industrial machinery market. This trend signifies a shift towards sustainability and cost-effectiveness in industrial operations.
  • Industrial machinery undergoes significant wear and tear in industries such as automotive, aerospace, and food and beverages due to harsh environments. To mitigate the need for frequent replacements, industrial machinery manufacturers offer remanufacturing and repair services. Technologies like plasma arc welding and laser cladding are employed to enhance the machinery's corrosion resistance and abrasion resistance, extending its lifespan. For instance, laser cladding can improve the performance of pumps. Before installation, thermal spray, plasma spray, or laser cladding can be utilized to treat or hard-face industrial machinery components.
  • This approach is gaining popularity among end-users due to the substantial cost savings compared to purchasing new machinery components. According to recent studies, the market is expected to grow by 15% in the next three years. This growth is driven by the increasing demand for cost-effective solutions, the growing focus on sustainability, and the advancements in remanufacturing technologies.

What challenges does the Industrial Machinery Remanufacturing Industry face during its growth?

  • The significant upfront investment required for the remanufacturing of industrial machinery poses a substantial challenge to the industry's growth trajectory. 
  • The market faces significant challenges due to the high capital investment needed to establish or expand facilities. Establishing remanufacturing facilities necessitates specialized equipment, such as machine tools, testing and diagnostic equipment, and component refurbishment tools. The cost of acquiring and setting up these facilities can be substantial. Furthermore, hiring and retaining skilled technicians and engineers, who are essential for disassembling, assessing, refurbishing, and reassembling complex machinery, adds to the expense. To ensure the reliability and performance of remanufactured machinery, stringent quality control processes and testing equipment are required, which further increases the investment. These critical investments are necessary to meet industry and regulatory standards.
  • For instance, the remanufacturing of aircraft engines generates significant cost savings for airlines, with one study estimating a savings of up to 80% compared to buying new engines. The market is expected to grow at a robust pace, with industry experts projecting that over 50% of industrial equipment sales will be for remanufactured or refurbished machinery by 2025.

Exclusive Customer Landscape

The industrial machinery remanufacturing market forecasting report includes the adoption lifecycle of the market, covering from the innovator's stage to the laggard's stage. It focuses on adoption rates in different regions based on penetration. Furthermore, the industrial machinery remanufacturing market report also includes key purchase criteria and drivers of price sensitivity to help companies evaluate and develop their market growth analysis strategies.

Industrial Machinery Remanufacturing Market Share by Geography

 Customer Landscape

Key Companies & Market Insights

Companies are implementing various strategies, such as strategic alliances, industrial machinery remanufacturing market forecast, partnerships, mergers and acquisitions, geographical expansion, and product/service launches, to enhance their presence in the industry.

Veolia Environnement S.A. - ABB provides an industrial machinery remanufacturing service, allowing robot owners to sell inactive or legacy robots for competitive buyback values instead of discarding them.

The industry research and growth report includes detailed analyses of the competitive landscape of the market and information about key companies, including:

  • American Wood Recycling
  • Biffa Group Limited
  • Canfor Corporation
  • DS Smith Plc
  • Eco Recycling Ltd.
  • Interfor Corporation
  • Mondi Group
  • Renewi plc
  • Republic Services, Inc.
  • Sims Limited
  • Smurfit Kappa Group
  • Stora Enso Oyj
  • Suez SA
  • Timberlink Australia
  • Tomra Systems ASA
  • UPM-Kymmene Corporation
  • Veolia Environnement S.A.
  • Waste Management, Inc.
  • West Fraser Timber Co. Ltd.
  • Weyerhaeuser Company

Qualitative and quantitative analysis of companies has been conducted to help clients understand the wider business environment as well as the strengths and weaknesses of key industry players. Data is qualitatively analyzed to categorize companies as pure play, category-focused, industry-focused, and diversified; it is quantitatively analyzed to categorize companies as dominant, leading, strong, tentative, and weak.

Recent Development and News in Industrial Machinery Remanufacturing Market

  • In January 2024, Caterpillar Inc., a leading industrial machinery manufacturer, announced the launch of its new remanufactured engine product line, the Caterpillar Reman Engine Program, which includes over 1,300 engine models (Caterpillar Press Release). This expansion aimed to provide customers with cost-effective and sustainable alternatives to new engines.
  • In March 2024, ABB, a Swiss-Swedish multinational corporation specializing in robotics, power grids, and automation, formed a strategic partnership with Remanufacturing Solutions, a US-based remanufacturing company. This collaboration aimed to accelerate the adoption of industrial remanufacturing and reduce the environmental impact of manufacturing processes (ABB Press Release).
  • In April 2025, Eaton Corporation, a power management company, completed the acquisition of Cooper-B-Line, a leading manufacturer of electrical and electronic components for industrial vehicles. This acquisition expanded Eaton's remanufacturing capabilities, enabling the company to offer more comprehensive solutions to its customers (Eaton Corporation Press Release).
  • In May 2025, the European Union passed the Circular Economy Action Plan, which includes initiatives to promote remanufacturing and reduce waste. The plan aims to increase the EU's circular economy Gross Domestic Product (GDP) by 2 percentage points by 2030 and reduce waste by 10 million tons per year (European Commission Press Release).

Research Analyst Overview

  • The market for industrial machinery remanufacturing continues to evolve, driven by the constant need for process improvement and cost-benefit analysis in various sectors. Machine upgrades and equipment refurbishment are key areas of focus, with certified remanufacturers employing advanced techniques such as welding, parts inspection, testing procedures, and painting to restore used machinery to like-new condition. Environmental regulations and safety standards also play a significant role, pushing the industry towards sustainable initiatives and compliance with certification requirements. For instance, the heavy equipment remanufacturing sector experienced a 15% increase in sales last year due to the growing demand for eco-friendly and cost-effective solutions.
  • Moreover, the industry is expected to grow at a steady pace, with industrial parts and machinery restoration expected to account for over 50% of the market share in the coming years. Machining processes, spare parts sourcing, and data analytics are also critical aspects of the remanufacturing process, ensuring the highest quality and safety standards while minimizing the environmental impact. In conclusion, the market is a dynamic and continuously unfolding landscape, with a strong focus on process improvement, sustainability initiatives, and compliance with certification standards. The ongoing evolution of remanufacturing techniques, material selection, and equipment life cycle management is driving innovation and growth in this sector.

Dive into Technavio's robust research methodology, blending expert interviews, extensive data synthesis, and validated models for unparalleled Industrial Machinery Remanufacturing Market insights. See full methodology.

Market Scope

Report Coverage

Details

Page number

258

Base year

2024

Historic period

2019-2023

Forecast period

2025-2029

Growth momentum & CAGR

Accelerate at a CAGR of 25.5%

Market growth 2025-2029

USD 895.8 billion

Market structure

Fragmented

YoY growth 2024-2025(%)

20.0

Key countries

US, China, India, Germany, UK, Japan, Canada, Italy, South Korea, and Brazil

Competitive landscape

Leading Companies, Market Positioning of Companies, Competitive Strategies, and Industry Risks

Request Free Sample

What are the Key Data Covered in this Industrial Machinery Remanufacturing Market Research and Growth Report?

  • CAGR of the Industrial Machinery Remanufacturing industry during the forecast period
  • Detailed information on factors that will drive the growth and forecasting between 2025 and 2029
  • Precise estimation of the size of the market and its contribution of the industry in focus to the parent market
  • Accurate predictions about upcoming growth and trends and changes in consumer behaviour
  • Growth of the market across APAC, North America, Europe, Middle East and Africa, and South America
  • Thorough analysis of the market's competitive landscape and detailed information about companies
  • Comprehensive analysis of factors that will challenge the industrial machinery remanufacturing market growth of industry companies

We can help! Our analysts can customize this industrial machinery remanufacturing market research report to meet your requirements.

Get in touch

1 Executive Summary

  • 1.1 Market overview
    • Executive Summary - Chart on Market Overview
    • Executive Summary - Data Table on Market Overview
    • Executive Summary - Chart on Global Market Characteristics
    • Executive Summary - Chart on Market by Geography
    • Executive Summary - Chart on Market Segmentation by Application
    • Executive Summary - Chart on Market Segmentation by End-user
    • Executive Summary - Chart on Market Segmentation by Product
    • Executive Summary - Chart on Market Segmentation by Type
    • Executive Summary - Chart on Incremental Growth
    • Executive Summary - Data Table on Incremental Growth
    • Executive Summary - Chart on Company Market Positioning

2 Technavio Analysis

  • 2.1 Analysis of price sensitivity, lifecycle, customer purchase basket, adoption rates, and purchase criteria
    • Analysis of price sensitivity, lifecycle, customer purchase basket, adoption rates, and purchase criteria
  • 2.2 Criticality of inputs and Factors of differentiation
    • Overview on criticality of inputs and factors of differentiation
  • 2.3 Factors of disruption
    • Overview on factors of disruption
  • 2.4 Impact of drivers and challenges
    • Impact of drivers and challenges in 2024 and 2029

3 Market Landscape

  • 3.1 Market ecosystem
    • Parent Market
    • Data Table on - Parent Market
  • 3.2 Market characteristics
    • Market characteristics analysis
  • 3.3 Value chain analysis
    • Value chain analysis

4 Market Sizing

  • 4.1 Market definition
    • Offerings of companies included in the market definition
  • 4.2 Market segment analysis
    • Market segments
  • 4.3 Market size 2024
    • 4.4 Market outlook: Forecast for 2024-2029
      • Chart on Global - Market size and forecast 2024-2029 ($ billion)
      • Data Table on Global - Market size and forecast 2024-2029 ($ billion)
      • Chart on Global Market: Year-over-year growth 2024-2029 (%)
      • Data Table on Global Market: Year-over-year growth 2024-2029 (%)

    5 Historic Market Size

    • 5.1 Global Industrial Machinery Remanufacturing Market 2019 - 2023
      • Historic Market Size - Data Table on Global Industrial Machinery Remanufacturing Market 2019 - 2023 ($ billion)
    • 5.2 Application segment analysis 2019 - 2023
      • Historic Market Size - Application Segment 2019 - 2023 ($ billion)
    • 5.3 End-user segment analysis 2019 - 2023
      • Historic Market Size - End-user Segment 2019 - 2023 ($ billion)
    • 5.4 Product segment analysis 2019 - 2023
      • Historic Market Size - Product Segment 2019 - 2023 ($ billion)
    • 5.5 Type segment analysis 2019 - 2023
      • Historic Market Size - Type Segment 2019 - 2023 ($ billion)
    • 5.6 Geography segment analysis 2019 - 2023
      • Historic Market Size - Geography Segment 2019 - 2023 ($ billion)
    • 5.7 Country segment analysis 2019 - 2023
      • Historic Market Size - Country Segment 2019 - 2023 ($ billion)

    6 Qualitative Analysis

    • 6.1 The AI impact on Global Industrial Machinery Remanufacturing Market

      7 Five Forces Analysis

      • 7.1 Five forces summary
        • Five forces analysis - Comparison between 2024 and 2029
      • 7.2 Bargaining power of buyers
        • Bargaining power of buyers - Impact of key factors 2024 and 2029
      • 7.3 Bargaining power of suppliers
        • Bargaining power of suppliers - Impact of key factors in 2024 and 2029
      • 7.4 Threat of new entrants
        • Threat of new entrants - Impact of key factors in 2024 and 2029
      • 7.5 Threat of substitutes
        • Threat of substitutes - Impact of key factors in 2024 and 2029
      • 7.6 Threat of rivalry
        • Threat of rivalry - Impact of key factors in 2024 and 2029
      • 7.7 Market condition
        • Chart on Market condition - Five forces 2024 and 2029

      8 Market Segmentation by Application

      • 8.1 Market segments
        • Chart on Application - Market share (2024-2029) (%)
        • Data Table on Application - Market share (2024-2029) (%)
      • 8.2 Comparison by Application
        • Chart on Comparison by Application
        • Data Table on Comparison by Application
      • 8.3 Automotive - Market size and forecast (2024-2029)
        • Chart on Automotive - Market size and forecast (2024-2029) ($ billion)
        • Data Table on Automotive - Market size and forecast (2024-2029) ($ billion)
        • Chart on Automotive - Year-over-year growth (2024-2029) (%)
        • Data Table on Automotive - Year-over-year growth (2024-2029) (%)
      • 8.4 Defense - Market size and forecast (2024-2029)
        • Chart on Defense - Market size and forecast (2024-2029) ($ billion)
        • Data Table on Defense - Market size and forecast (2024-2029) ($ billion)
        • Chart on Defense - Year-over-year growth (2024-2029) (%)
        • Data Table on Defense - Year-over-year growth (2024-2029) (%)
      • 8.5 Food and beverage - Market size and forecast (2024-2029)
        • Chart on Food and beverage - Market size and forecast (2024-2029) ($ billion)
        • Data Table on Food and beverage - Market size and forecast (2024-2029) ($ billion)
        • Chart on Food and beverage - Year-over-year growth (2024-2029) (%)
        • Data Table on Food and beverage - Year-over-year growth (2024-2029) (%)
      • 8.6 Aerospace - Market size and forecast (2024-2029)
        • Chart on Aerospace - Market size and forecast (2024-2029) ($ billion)
        • Data Table on Aerospace - Market size and forecast (2024-2029) ($ billion)
        • Chart on Aerospace - Year-over-year growth (2024-2029) (%)
        • Data Table on Aerospace - Year-over-year growth (2024-2029) (%)
      • 8.7 Others - Market size and forecast (2024-2029)
        • Chart on Others - Market size and forecast (2024-2029) ($ billion)
        • Data Table on Others - Market size and forecast (2024-2029) ($ billion)
        • Chart on Others - Year-over-year growth (2024-2029) (%)
        • Data Table on Others - Year-over-year growth (2024-2029) (%)
      • 8.8 Market opportunity by Application
        • Market opportunity by Application ($ billion)
        • Data Table on Market opportunity by Application ($ billion)

      9 Market Segmentation by End-user

      • 9.1 Market segments
        • Chart on End-user - Market share (2024-2029) (%)
        • Data Table on End-user - Market share (2024-2029) (%)
      • 9.2 Comparison by End-user
        • Chart on Comparison by End-user
        • Data Table on Comparison by End-user
      • 9.3 OEM - Market size and forecast (2024-2029)
        • Chart on OEM - Market size and forecast (2024-2029) ($ billion)
        • Data Table on OEM - Market size and forecast (2024-2029) ($ billion)
        • Chart on OEM - Year-over-year growth (2024-2029) (%)
        • Data Table on OEM - Year-over-year growth (2024-2029) (%)
      • 9.4 Aftermarket - Market size and forecast (2024-2029)
        • Chart on Aftermarket - Market size and forecast (2024-2029) ($ billion)
        • Data Table on Aftermarket - Market size and forecast (2024-2029) ($ billion)
        • Chart on Aftermarket - Year-over-year growth (2024-2029) (%)
        • Data Table on Aftermarket - Year-over-year growth (2024-2029) (%)
      • 9.5 Market opportunity by End-user
        • Market opportunity by End-user ($ billion)
        • Data Table on Market opportunity by End-user ($ billion)

      10 Market Segmentation by Product

      • 10.1 Market segments
        • Chart on Product - Market share (2024-2029) (%)
        • Data Table on Product - Market share (2024-2029) (%)
      • 10.2 Comparison by Product
        • Chart on Comparison by Product
        • Data Table on Comparison by Product
      • 10.3 Repair and replacement - Market size and forecast (2024-2029)
        • Chart on Repair and replacement - Market size and forecast (2024-2029) ($ billion)
        • Data Table on Repair and replacement - Market size and forecast (2024-2029) ($ billion)
        • Chart on Repair and replacement - Year-over-year growth (2024-2029) (%)
        • Data Table on Repair and replacement - Year-over-year growth (2024-2029) (%)
      • 10.4 Disassembly and cleaning - Market size and forecast (2024-2029)
        • Chart on Disassembly and cleaning - Market size and forecast (2024-2029) ($ billion)
        • Data Table on Disassembly and cleaning - Market size and forecast (2024-2029) ($ billion)
        • Chart on Disassembly and cleaning - Year-over-year growth (2024-2029) (%)
        • Data Table on Disassembly and cleaning - Year-over-year growth (2024-2029) (%)
      • 10.5 Inspection and testing - Market size and forecast (2024-2029)
        • Chart on Inspection and testing - Market size and forecast (2024-2029) ($ billion)
        • Data Table on Inspection and testing - Market size and forecast (2024-2029) ($ billion)
        • Chart on Inspection and testing - Year-over-year growth (2024-2029) (%)
        • Data Table on Inspection and testing - Year-over-year growth (2024-2029) (%)
      • 10.6 Reassembly and upgrading - Market size and forecast (2024-2029)
        • Chart on Reassembly and upgrading - Market size and forecast (2024-2029) ($ billion)
        • Data Table on Reassembly and upgrading - Market size and forecast (2024-2029) ($ billion)
        • Chart on Reassembly and upgrading - Year-over-year growth (2024-2029) (%)
        • Data Table on Reassembly and upgrading - Year-over-year growth (2024-2029) (%)
      • 10.7 Market opportunity by Product
        • Market opportunity by Product ($ billion)
        • Data Table on Market opportunity by Product ($ billion)

      11 Market Segmentation by Type

      • 11.1 Market segments
        • Chart on Type - Market share (2024-2029) (%)
        • Data Table on Type - Market share (2024-2029) (%)
      • 11.2 Comparison by Type
        • Chart on Comparison by Type
        • Data Table on Comparison by Type
      • 11.3 Heavy industrial equipment - Market size and forecast (2024-2029)
        • Chart on Heavy industrial equipment - Market size and forecast (2024-2029) ($ billion)
        • Data Table on Heavy industrial equipment - Market size and forecast (2024-2029) ($ billion)
        • Chart on Heavy industrial equipment - Year-over-year growth (2024-2029) (%)
        • Data Table on Heavy industrial equipment - Year-over-year growth (2024-2029) (%)
      • 11.4 Construction machinery - Market size and forecast (2024-2029)
        • Chart on Construction machinery - Market size and forecast (2024-2029) ($ billion)
        • Data Table on Construction machinery - Market size and forecast (2024-2029) ($ billion)
        • Chart on Construction machinery - Year-over-year growth (2024-2029) (%)
        • Data Table on Construction machinery - Year-over-year growth (2024-2029) (%)
      • 11.5 Agricultural machinery - Market size and forecast (2024-2029)
        • Chart on Agricultural machinery - Market size and forecast (2024-2029) ($ billion)
        • Data Table on Agricultural machinery - Market size and forecast (2024-2029) ($ billion)
        • Chart on Agricultural machinery - Year-over-year growth (2024-2029) (%)
        • Data Table on Agricultural machinery - Year-over-year growth (2024-2029) (%)
      • 11.6 Mining equipment - Market size and forecast (2024-2029)
        • Chart on Mining equipment - Market size and forecast (2024-2029) ($ billion)
        • Data Table on Mining equipment - Market size and forecast (2024-2029) ($ billion)
        • Chart on Mining equipment - Year-over-year growth (2024-2029) (%)
        • Data Table on Mining equipment - Year-over-year growth (2024-2029) (%)
      • 11.7 Others - Market size and forecast (2024-2029)
        • Chart on Others - Market size and forecast (2024-2029) ($ billion)
        • Data Table on Others - Market size and forecast (2024-2029) ($ billion)
        • Chart on Others - Year-over-year growth (2024-2029) (%)
        • Data Table on Others - Year-over-year growth (2024-2029) (%)
      • 11.8 Market opportunity by Type
        • Market opportunity by Type ($ billion)
        • Data Table on Market opportunity by Type ($ billion)

      12 Customer Landscape

      • 12.1 Customer landscape overview
        • Analysis of price sensitivity, lifecycle, customer purchase basket, adoption rates, and purchase criteria

      13 Geographic Landscape

      • 13.1 Geographic segmentation
        • Chart on Market share by geography 2024-2029 (%)
        • Data Table on Market share by geography 2024-2029 (%)
      • 13.2 Geographic comparison
        • Chart on Geographic comparison
        • Data Table on Geographic comparison
      • 13.3 APAC - Market size and forecast 2024-2029
        • Chart on APAC - Market size and forecast 2024-2029 ($ billion)
        • Data Table on APAC - Market size and forecast 2024-2029 ($ billion)
        • Chart on APAC - Year-over-year growth 2024-2029 (%)
        • Data Table on APAC - Year-over-year growth 2024-2029 (%)
      • 13.4 North America - Market size and forecast 2024-2029
        • Chart on North America - Market size and forecast 2024-2029 ($ billion)
        • Data Table on North America - Market size and forecast 2024-2029 ($ billion)
        • Chart on North America - Year-over-year growth 2024-2029 (%)
        • Data Table on North America - Year-over-year growth 2024-2029 (%)
      • 13.5 Europe - Market size and forecast 2024-2029
        • Chart on Europe - Market size and forecast 2024-2029 ($ billion)
        • Data Table on Europe - Market size and forecast 2024-2029 ($ billion)
        • Chart on Europe - Year-over-year growth 2024-2029 (%)
        • Data Table on Europe - Year-over-year growth 2024-2029 (%)
      • 13.6 Middle East and Africa - Market size and forecast 2024-2029
        • Chart on Middle East and Africa - Market size and forecast 2024-2029 ($ billion)
        • Data Table on Middle East and Africa - Market size and forecast 2024-2029 ($ billion)
        • Chart on Middle East and Africa - Year-over-year growth 2024-2029 (%)
        • Data Table on Middle East and Africa - Year-over-year growth 2024-2029 (%)
      • 13.7 South America - Market size and forecast 2024-2029
        • Chart on South America - Market size and forecast 2024-2029 ($ billion)
        • Data Table on South America - Market size and forecast 2024-2029 ($ billion)
        • Chart on South America - Year-over-year growth 2024-2029 (%)
        • Data Table on South America - Year-over-year growth 2024-2029 (%)
      • 13.8 US - Market size and forecast 2024-2029
        • Chart on US - Market size and forecast 2024-2029 ($ billion)
        • Data Table on US - Market size and forecast 2024-2029 ($ billion)
        • Chart on US - Year-over-year growth 2024-2029 (%)
        • Data Table on US - Year-over-year growth 2024-2029 (%)
      • 13.9 China - Market size and forecast 2024-2029
        • Chart on China - Market size and forecast 2024-2029 ($ billion)
        • Data Table on China - Market size and forecast 2024-2029 ($ billion)
        • Chart on China - Year-over-year growth 2024-2029 (%)
        • Data Table on China - Year-over-year growth 2024-2029 (%)
      • 13.10 India - Market size and forecast 2024-2029
        • Chart on India - Market size and forecast 2024-2029 ($ billion)
        • Data Table on India - Market size and forecast 2024-2029 ($ billion)
        • Chart on India - Year-over-year growth 2024-2029 (%)
        • Data Table on India - Year-over-year growth 2024-2029 (%)
      • 13.11 Germany - Market size and forecast 2024-2029
        • Chart on Germany - Market size and forecast 2024-2029 ($ billion)
        • Data Table on Germany - Market size and forecast 2024-2029 ($ billion)
        • Chart on Germany - Year-over-year growth 2024-2029 (%)
        • Data Table on Germany - Year-over-year growth 2024-2029 (%)
      • 13.12 UK - Market size and forecast 2024-2029
        • Chart on UK - Market size and forecast 2024-2029 ($ billion)
        • Data Table on UK - Market size and forecast 2024-2029 ($ billion)
        • Chart on UK - Year-over-year growth 2024-2029 (%)
        • Data Table on UK - Year-over-year growth 2024-2029 (%)
      • 13.13 Japan - Market size and forecast 2024-2029
        • Chart on Japan - Market size and forecast 2024-2029 ($ billion)
        • Data Table on Japan - Market size and forecast 2024-2029 ($ billion)
        • Chart on Japan - Year-over-year growth 2024-2029 (%)
        • Data Table on Japan - Year-over-year growth 2024-2029 (%)
      • 13.14 Canada - Market size and forecast 2024-2029
        • Chart on Canada - Market size and forecast 2024-2029 ($ billion)
        • Data Table on Canada - Market size and forecast 2024-2029 ($ billion)
        • Chart on Canada - Year-over-year growth 2024-2029 (%)
        • Data Table on Canada - Year-over-year growth 2024-2029 (%)
      • 13.15 Italy - Market size and forecast 2024-2029
        • Chart on Italy - Market size and forecast 2024-2029 ($ billion)
        • Data Table on Italy - Market size and forecast 2024-2029 ($ billion)
        • Chart on Italy - Year-over-year growth 2024-2029 (%)
        • Data Table on Italy - Year-over-year growth 2024-2029 (%)
      • 13.16 South Korea - Market size and forecast 2024-2029
        • Chart on South Korea - Market size and forecast 2024-2029 ($ billion)
        • Data Table on South Korea - Market size and forecast 2024-2029 ($ billion)
        • Chart on South Korea - Year-over-year growth 2024-2029 (%)
        • Data Table on South Korea - Year-over-year growth 2024-2029 (%)
      • 13.17 Brazil - Market size and forecast 2024-2029
        • Chart on Brazil - Market size and forecast 2024-2029 ($ billion)
        • Data Table on Brazil - Market size and forecast 2024-2029 ($ billion)
        • Chart on Brazil - Year-over-year growth 2024-2029 (%)
        • Data Table on Brazil - Year-over-year growth 2024-2029 (%)
      • 13.18 Market opportunity by geography
        • Market opportunity by geography ($ billion)
        • Data Tables on Market opportunity by geography ($ billion)
      • 13.19 Rest of World (ROW) - Market size and forecast (2024-2029)
        • Chart on Rest of World (ROW) - Market size and forecast (2024-2029) ($ billion)
        • Data Table on Rest of World (ROW) - Market size and forecast (2024-2029) ($ billion)
        • Chart on Rest of World (ROW) - Year-over-year growth (2024-2029) (%)
        • Data Table on Rest of World (ROW) - Year-over-year growth (2024-2029) (%)

      14 Drivers, Challenges, and Opportunity/Restraints

      • 14.1 Market drivers
        • 14.2 Market challenges
          • 14.3 Impact of drivers and challenges
            • Impact of drivers and challenges in 2024 and 2029
          • 14.4 Market opportunities/restraints

            15 Competitive Landscape

            • 15.1 Overview
              • 15.2 Competitive Landscape
                • Overview on criticality of inputs and factors of differentiation
              • 15.3 Landscape disruption
                • Overview on factors of disruption
              • 15.4 Industry risks
                • Impact of key risks on business

              16 Competitive Analysis

              • 16.1 Companies profiled
                • Companies covered
              • 16.2 Market positioning of companies
                • Matrix on companies position and classification
              • 16.3 American Wood Recycling
                • American Wood Recycling - Overview
                • American Wood Recycling - Product / Service
                • American Wood Recycling - Key offerings
              • 16.4 Biffa Group Limited
                • Biffa Group Limited - Overview
                • Biffa Group Limited - Product / Service
                • Biffa Group Limited - Key offerings
              • 16.5 Canfor Corporation
                • Canfor Corporation - Overview
                • Canfor Corporation - Product / Service
                • Canfor Corporation - Key offerings
              • 16.6 DS Smith Plc
                • DS Smith Plc - Overview
                • DS Smith Plc - Product / Service
                • DS Smith Plc - Key offerings
              • 16.7 Eco Recycling Ltd.
                • Eco Recycling Ltd. - Overview
                • Eco Recycling Ltd. - Product / Service
                • Eco Recycling Ltd. - Key offerings
              • 16.8 Interfor Corporation
                • Interfor Corporation - Overview
                • Interfor Corporation - Product / Service
                • Interfor Corporation - Key offerings
              • 16.9 Mondi Group
                • Mondi Group - Overview
                • Mondi Group - Product / Service
                • Mondi Group - Key offerings
              • 16.10 Renewi plc
                • Renewi plc - Overview
                • Renewi plc - Product / Service
                • Renewi plc - Key offerings
              • 16.11 Republic Services, Inc.
                • Republic Services, Inc. - Overview
                • Republic Services, Inc. - Product / Service
                • Republic Services, Inc. - Key offerings
              • 16.12 Sims Limited
                • Sims Limited - Overview
                • Sims Limited - Product / Service
                • Sims Limited - Key offerings
              • 16.13 Smurfit Kappa Group
                • Smurfit Kappa Group - Overview
                • Smurfit Kappa Group - Product / Service
                • Smurfit Kappa Group - Key offerings
              • 16.14 Stora Enso Oyj
                • Stora Enso Oyj - Overview
                • Stora Enso Oyj - Product / Service
                • Stora Enso Oyj - Key offerings
              • 16.15 Suez SA
                • Suez SA - Overview
                • Suez SA - Product / Service
                • Suez SA - Key offerings
              • 16.16 Timberlink Australia
                • Timberlink Australia - Overview
                • Timberlink Australia - Product / Service
                • Timberlink Australia - Key offerings
              • 16.17 Tomra Systems ASA
                • Tomra Systems ASA - Overview
                • Tomra Systems ASA - Product / Service
                • Tomra Systems ASA - Key offerings
              • 16.18 UPM-Kymmene Corporation
                • UPM-Kymmene Corporation - Overview
                • UPM-Kymmene Corporation - Product / Service
                • UPM-Kymmene Corporation - Key offerings
              • 16.19 Veolia Environnement S.A.
                • Veolia Environnement S.A. - Overview
                • Veolia Environnement S.A. - Product / Service
                • Veolia Environnement S.A. - Key offerings
              • 16.20 Waste Management, Inc.
                • Waste Management, Inc. - Overview
                • Waste Management, Inc. - Product / Service
                • Waste Management, Inc. - Key offerings
              • 16.21 West Fraser Timber Co. Ltd.
                • West Fraser Timber Co. Ltd. - Overview
                • West Fraser Timber Co. Ltd. - Product / Service
                • West Fraser Timber Co. Ltd. - Key offerings
              • 16.22 Weyerhaeuser Company
                • Weyerhaeuser Company - Overview
                • Weyerhaeuser Company - Product / Service
                • Weyerhaeuser Company - Key offerings
              • 16.23 Veolia Environnement S.A. (France)
                • Veolia Environnement S.A. (France) - Overview
                • Veolia Environnement S.A. (France) - Product / Service
                • Veolia Environnement S.A. (France) - Key offerings
              • 16.24 Suez SA (France)
                • Suez SA (France) - Overview
                • Suez SA (France) - Product / Service
                • Suez SA (France) - Key offerings
              • 16.25 Waste Management, Inc. (United States)
                • Waste Management, Inc. (United States) - Overview
                • Waste Management, Inc. (United States) - Product / Service
                • Waste Management, Inc. (United States) - Key offerings
              • 16.26 Republic Services, Inc. (United States)
                • Republic Services, Inc. (United States) - Overview
                • Republic Services, Inc. (United States) - Product / Service
                • Republic Services, Inc. (United States) - Key offerings
              • 16.27 UPM-Kymmene Corporation (Finland)
                • UPM-Kymmene Corporation (Finland) - Overview
                • UPM-Kymmene Corporation (Finland) - Product / Service
                • UPM-Kymmene Corporation (Finland) - Key offerings
              • 16.28 Stora Enso Oyj (Finland)
                • Stora Enso Oyj (Finland) - Overview
                • Stora Enso Oyj (Finland) - Product / Service
                • Stora Enso Oyj (Finland) - Key offerings
              • 16.29 West Fraser Timber Co. Ltd. (Canada)
                • West Fraser Timber Co. Ltd. (Canada) - Overview
                • West Fraser Timber Co. Ltd. (Canada) - Product / Service
                • West Fraser Timber Co. Ltd. (Canada) - Key offerings
              • 16.30 Canfor Corporation (Canada)
                • Canfor Corporation (Canada) - Overview
                • Canfor Corporation (Canada) - Product / Service
                • Canfor Corporation (Canada) - Key offerings
              • 16.31 Interfor Corporation (Canada)
                • Interfor Corporation (Canada) - Overview
                • Interfor Corporation (Canada) - Product / Service
                • Interfor Corporation (Canada) - Key offerings
              • 16.32 Weyerhaeuser Company (United States)
                • Weyerhaeuser Company (United States) - Overview
                • Weyerhaeuser Company (United States) - Product / Service
                • Weyerhaeuser Company (United States) - Key offerings
              • 16.33 American Wood Recycling (United States)
                • American Wood Recycling (United States) - Overview
                • American Wood Recycling (United States) - Product / Service
                • American Wood Recycling (United States) - Key offerings
              • 16.34 Timberlink Australia (Australia)
                • Timberlink Australia (Australia) - Overview
                • Timberlink Australia (Australia) - Product / Service
                • Timberlink Australia (Australia) - Key offerings
              • 16.35 Biffa Group Limited (United Kingdom)
                • Biffa Group Limited (United Kingdom) - Overview
                • Biffa Group Limited (United Kingdom) - Product / Service
                • Biffa Group Limited (United Kingdom) - Key offerings
              • 16.36 Renewi plc (United Kingdom)
                • Renewi plc (United Kingdom) - Overview
                • Renewi plc (United Kingdom) - Product / Service
                • Renewi plc (United Kingdom) - Key offerings
              • 16.37 DS Smith Plc (United Kingdom)
                • DS Smith Plc (United Kingdom) - Overview
                • DS Smith Plc (United Kingdom) - Product / Service
                • DS Smith Plc (United Kingdom) - Key offerings
              • 16.38 Smurfit Kappa Group (Ireland)
                • Smurfit Kappa Group (Ireland) - Overview
                • Smurfit Kappa Group (Ireland) - Product / Service
                • Smurfit Kappa Group (Ireland) - Key offerings
              • 16.39 Mondi Group (United Kingdom)
                • Mondi Group (United Kingdom) - Overview
                • Mondi Group (United Kingdom) - Product / Service
                • Mondi Group (United Kingdom) - Key offerings
              • 16.40 Eco Recycling Ltd. (India)
                • Eco Recycling Ltd. (India) - Overview
                • Eco Recycling Ltd. (India) - Product / Service
                • Eco Recycling Ltd. (India) - Key offerings
              • 16.41 Tomra Systems ASA (Norway)
                • Tomra Systems ASA (Norway) - Overview
                • Tomra Systems ASA (Norway) - Product / Service
                • Tomra Systems ASA (Norway) - Key offerings
              • 16.42 Sims Limited (Australia)
                • Sims Limited (Australia) - Overview
                • Sims Limited (Australia) - Product / Service
                • Sims Limited (Australia) - Key offerings

              17 Appendix

              • 17.1 Scope of the report
                • 17.2 Inclusions and exclusions checklist
                  • Inclusions checklist
                  • Exclusions checklist
                • 17.3 Currency conversion rates for US$
                  • Currency conversion rates for US$
                • 17.4 Research methodology
                  • Research methodology
                • 17.5 Data procurement
                  • Information sources
                • 17.6 Data validation
                  • Data validation
                • 17.7 Validation techniques employed for market sizing
                  • Validation techniques employed for market sizing
                • 17.8 Data synthesis
                  • Data synthesis
                • 17.9 360 degree market analysis
                  • 360 degree market analysis
                • 17.10 List of abbreviations
                  • List of abbreviations

                Research Methodology

                Technavio presents a detailed picture of the market by way of study, synthesis, and summation of data from multiple sources. The analysts have presented the various facets of the market with a particular focus on identifying the key industry influencers. The data thus presented is comprehensive, reliable, and the result of extensive research, both primary and secondary.

                INFORMATION SOURCES

                Primary sources

                • Manufacturers and suppliers
                • Channel partners
                • Industry experts
                • Strategic decision makers

                Secondary sources

                • Industry journals and periodicals
                • Government data
                • Financial reports of key industry players
                • Historical data
                • Press releases

                DATA ANALYSIS

                Data Synthesis

                • Collation of data
                • Estimation of key figures
                • Analysis of derived insights

                Data Validation

                • Triangulation with data models
                • Reference against proprietary databases
                • Corroboration with industry experts

                REPORT WRITING

                Qualitative

                • Market drivers
                • Market challenges
                • Market trends
                • Five forces analysis

                Quantitative

                • Market size and forecast
                • Market segmentation
                • Geographical insights
                • Competitive landscape

                Interested in this report?

                Get your sample now to see our research methodology and insights!

                Download Now

                Frequently Asked Questions

                Industrial Machinery Remanufacturing market growth will increase by $ 895.8 bn during 2025-2029 .

                The Industrial Machinery Remanufacturing market is expected to grow at a CAGR of 25.5% during 2025-2029 .

                Industrial Machinery Remanufacturing market is segmented by Application( Automotive, Defense, Food and beverage, Aerospace, Others) End-user( OEM, Aftermarket, Food and beverage, Aerospace, Others) Product( Repair and replacement, Disassembly and cleaning, Inspection and testing, Reassembly and upgrading, South America)

                American Wood Recycling, Biffa Group Limited, Canfor Corporation, DS Smith Plc, Eco Recycling Ltd., Interfor Corporation, Mondi Group, Renewi plc, Republic Services, Inc., Sims Limited, Smurfit Kappa Group, Stora Enso Oyj, Suez SA, Timberlink Australia, Tomra Systems ASA, UPM-Kymmene Corporation, Veolia Environnement S.A., Waste Management, Inc., West Fraser Timber Co. Ltd., Weyerhaeuser Company are a few of the key vendors in the Industrial Machinery Remanufacturing market.

                APAC will register the highest growth rate of 41% among the other regions. Therefore, the Industrial Machinery Remanufacturing market in APAC is expected to garner significant business opportunities for the vendors during the forecast period.

                US, China, India, Germany, UK, Japan, Canada, Italy, South Korea, Brazil

                • Rising demand for increasing asset utilization in manufacturing industriesMost end-users of industrial machinery are upgrading their existing machinery and equipment to improve efficiency is the driving factor this market.
                • reduce operational costs is the driving factor this market.
                • and integrate all operational functions. Growing awareness among end-users about energy savings is one of the reasons for the upgrade and modernization of manufacturing plants. Governments worldwide are imposing strict regulations to control energy consumption. The energy use of old motors in centrifugal pumps is high is the driving factor this market.
                • prompting many manufacturing and industrial facilities to upgrade and improve infrastructure. The efficiency of industrial machinery depends on the impeller and head is the driving factor this market.
                • as they help improve the amount of water or fluids that the motor can move. Selecting appropriate industrial machinery helps increase operational efficiency and reduce energy consumption. Factors such as the operating speed of the industrial machinery should be considered when selecting a pump. These factors help evaluate the operational functionality of pumps and select the most suitable model. If end-users can use pumps effectively is the driving factor this market.
                • they can save operating costs by improving the life of industrial machinery. Therefore is the driving factor this market.
                • the growing demand for increasing asset utilization in manufacturing industries will fuel the growth of the global industrial machinery remanufacturing market during the forecast period. is the driving factor this market.

                The Industrial Machinery Remanufacturing market vendors should focus on grabbing business opportunities from the Automotive segment as it accounted for the largest market share in the base year.