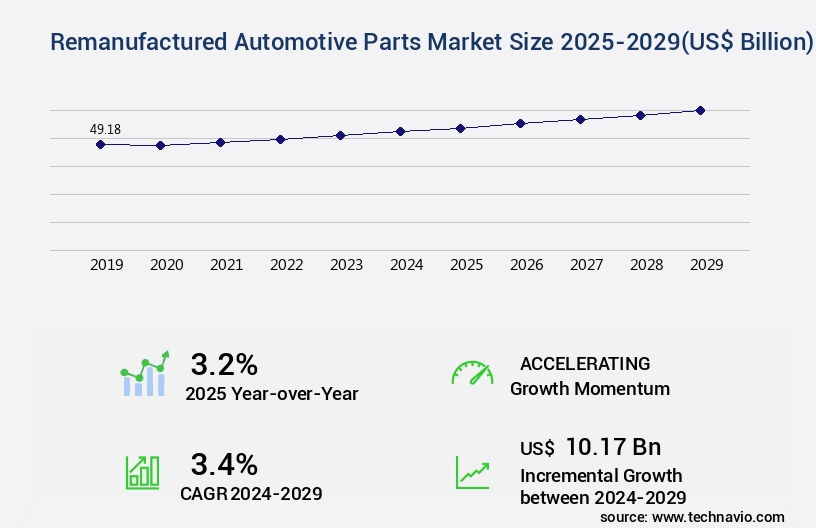
Remanufactured Automotive Parts Market Size 2025-2029
The remanufactured automotive parts market size is forecast to increase by USD 10.17 billion, at a CAGR of 3.4% between 2024 and 2029.
- The market continues to evolve, driven by the aging vehicle fleet and the increasing popularity of 3D printing in the automotive aftermarket industry. Remanufactured parts offer cost-effective solutions for vehicle owners, as they undergo a rigorous process of restoration to meet or even surpass original equipment manufacturer (OEM) specifications. The adoption of remanufactured parts is particularly significant in the context of electric vehicles (EVs). With the growing number of EVs on the road, the demand for affordable and sustainable aftermarket solutions is increasing. Remanufactured EV batteries, for instance, provide an economical alternative to purchasing new ones. These batteries undergo a thorough refurbishment process, restoring their capacity and performance to near-new levels.
- The 3D printing technology is another disruptive trend shaping the market. This innovative technology enables the production of complex and custom parts on-demand, reducing inventory costs and lead times. Moreover, it allows for the creation of parts that are not readily available in the market, ensuring vehicle owners have access to essential components for their vehicles. The remanufacturing process not only benefits consumers but also contributes to environmental sustainability. By extending the life cycle of automotive components, the industry reduces the demand for raw materials and the associated environmental impact of their extraction and manufacturing. Additionally, the remanufacturing process generates fewer greenhouse gas emissions compared to producing new parts.
- In terms of market dynamics, the market is characterized by continuous growth and innovation. The market is driven by the increasing demand for cost-effective and sustainable solutions, as well as advancements in technology, such as 3D printing and battery refurbishment. Furthermore, the market is influenced by regulatory initiatives promoting the circular economy and reducing waste. Comparatively, the market for new automotive parts is expected to face challenges due to the growing popularity of remanufactured parts. The remanufactured parts market is projected to capture a larger share of the overall aftermarket, as more consumers become aware of the benefits and cost savings associated with these solutions.
Major Market Trends & Insights
- North America dominated the market and accounted for a 44% during the forecast period.
- The market is expected to grow significantly in Europe as well over the forecast period.
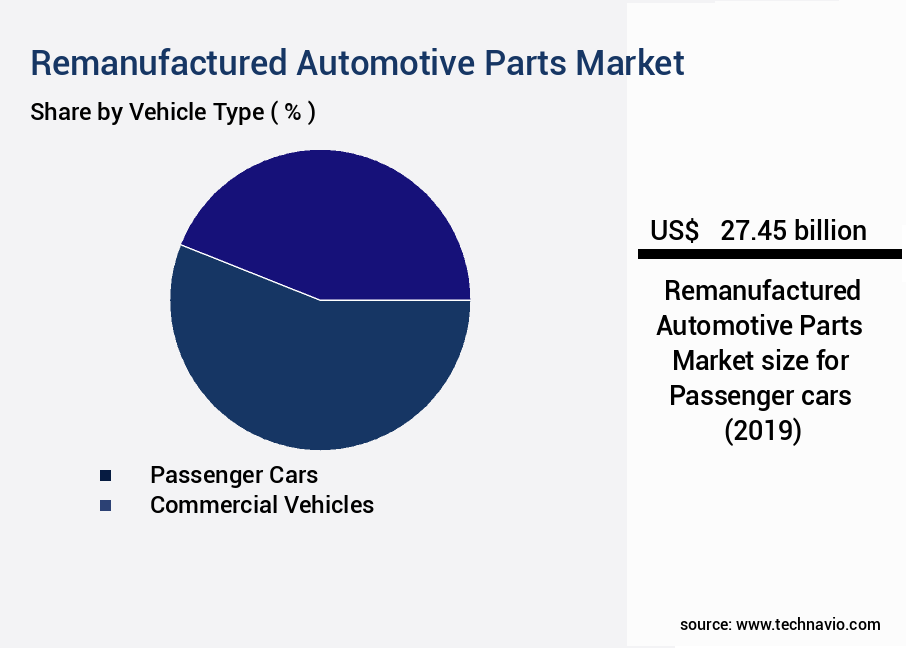
- By the Vehicle Type, the Passenger cars sub-segment was valued at USD 27.45 billion in 2023
- By the Component, the Electrical and electronic parts sub-segment accounted for the largest market revenue share in 2023
Market Size & Forecast
- Market Opportunities: USD 33.06 billion
- Future Opportunities: USD 10.17 billion
- CAGR : 3.4%
- North America: Largest market in 2023
What will be the Size of the Remanufactured Automotive Parts Market during the forecast period?
Get Key Insights on Market Forecast (PDF) Request Free Sample
- The market represents a significant and continually evolving sector within the global automotive industry. This forecasted expansion underscores the potential for increased revenue and market penetration in the automotive parts sector. Comparing the current market adoption rate to the anticipated growth, it becomes evident that the market is poised for a substantial increase in demand.
- The gap between the current and projected market share highlights the potential for businesses to capitalize on this expanding market. In terms of process improvements, remanufacturing facilities employ various techniques to enhance the quality and efficiency of their operations. These techniques include advanced machining processes, parts cleaning methods, and waste management strategies. For instance, advanced machining processes like CNC machining and laser cutting enable precise and accurate component refurbishment. Parts cleaning methods, such as ultrasonic cleaning and vapor degreasing, ensure that components are thoroughly cleaned before being reassembled. Waste management strategies, like recycling and reusing materials, minimize the environmental impact of the remanufacturing process.
- Regulatory compliance is another crucial aspect of the market. Compliance with safety, environmental, and quality control standards is essential for maintaining the integrity and credibility of the market. Regulatory bodies, such as the Environmental Protection Agency (EPA) and the International Organization for Standardization (ISO), set stringent requirements for remanufacturing facilities. These requirements cover various aspects, including process improvement, predictive maintenance, and root cause analysis. The remanufacturing process itself consists of several steps, including disassembly, inspection, repair and overhaul, parts refurbishment, and reassembly. Each step is crucial in ensuring the quality and functionality of the final product.
- Component testing protocols and equipment play a vital role in evaluating the performance of remanufactured parts. These tests help to identify any defects or issues, ensuring that only high-quality parts are released to the market. The remanufacturing yield is another essential factor that influences the profitability and sustainability of remanufacturing businesses. A high remanufacturing yield, which refers to the percentage of input parts that can be successfully remanufactured and sold as new, is a key indicator of operational efficiency and financial success. In conclusion, the market is a dynamic and evolving sector that offers significant opportunities for growth and innovation.
- With a current market adoption rate of 27.3% and future growth expectations of 25%, this market presents a compelling case for businesses looking to capitalize on the increasing demand for cost-effective, high-quality alternatives to new automotive parts. The ongoing focus on process improvements, regulatory compliance, and quality control ensures that the market remains competitive and sustainable, making it an attractive proposition for businesses in the automotive industry.
How is this Remanufactured Automotive Parts Industry segmented?
The remanufactured automotive parts industry research report provides comprehensive data (region-wise segment analysis), with forecasts and estimates in "USD billion" for the period 2025-2029, as well as historical data from 2019-2023 for the following segments.
- Vehicle Type
- Passenger cars
- Commercial vehicles
- Component
- Electrical and electronic parts
- Engine
- Transmission
- Wheels and breaks
- Others
- Application
- Aftermarket
- OEM
- Material Sources
- Recycled Metals
- Reused Components
- Refurbished Parts
- Geography
- North America
- US
- Canada
- Mexico
- Europe
- France
- Germany
- Italy
- Spain
- UK
- Middle East and Africa
- UAE
- APAC
- China
- India
- Japan
- South Korea
- South America
- Brazil
- Rest of World (ROW)
- North America
By Vehicle Type Insights
The passenger cars segment is estimated to witness significant growth during the forecast period. The market in the US is currently experiencing significant growth, with the passenger car segment witnessing a notable increase in adoption due to the rising disposable income of middle-class individuals. In the SUV and crossover vehicles market, the preference for fuel efficiency and three-row seats is driving growth. Crossovers, which are built from car frames and are lighter than SUVs, are gaining popularity for their improved fuel efficiency. The increasing average annual miles traveled and the focus of vehicle owners on regular maintenance and upgrades present substantial opportunities for market participants.
According to a market analysis, the market is projected to expand by 15% by 2025. This growth is attributed to the environmental benefits, cost savings, and the increasing demand for sustainability in the automotive industry.
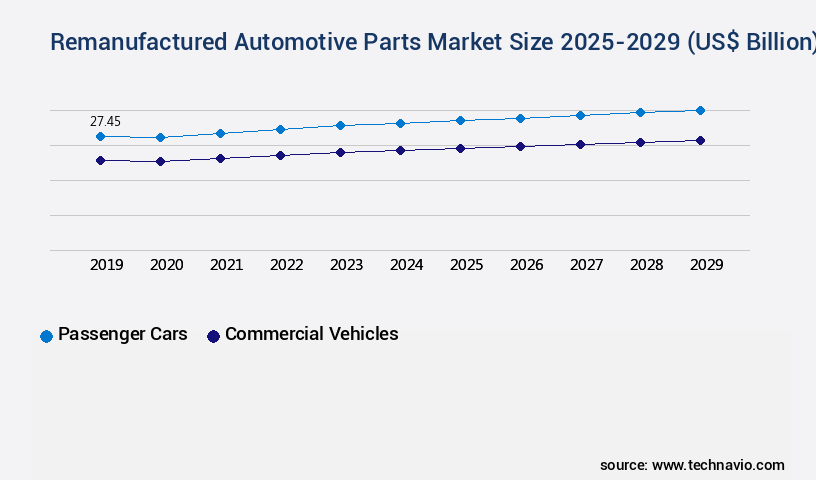
The Passenger cars segment was valued at USD 27.45 billion in 2019 and showed a gradual increase during the forecast period.
Regional Analysis
North America is estimated to contribute 44% to the growth of the global market during the forecast period.Technavio's analysts have elaborately explained the regional trends and drivers that shape the market during the forecast period.

See How Remanufactured Automotive Parts Market Demand is Rising in North America Request Free Sample
The market in North America is experiencing significant growth, driven by the increasing demand for commercial vehicles in various sectors. Approximately 50% of the total in-use vehicles in the region are commercial vehicles, with the large commercial vehicles (LCVs) segment accounting for the majority of sales. The ongoing expansion of industries such as oil and gas, agriculture, mining, and manufacturing has led to a surge in demand for commercial vehicles, particularly heavy-duty vehicles, for transporting raw materials and finished products. Additionally, consumer preferences in the US have contributed to the increasing sales of SUVs and pickup trucks, leading to a consistent growth trend in this market segment.
According to recent market research, the sales of remanufactured automotive parts in North America are projected to increase by 5% annually over the next five years. Compared to new automotive parts, remanufactured parts offer several advantages, including cost savings, reduced environmental impact, and improved performance. As a result, the market is becoming an increasingly attractive alternative for businesses and consumers alike. In conclusion, the market in North America is experiencing steady growth, fueled by the demand for commercial vehicles in various industries and consumer preferences for cost-effective and sustainable automotive solutions. With a projected annual growth rate of 5% over the next five years, this market is poised for continued expansion.
Market Dynamics
Our researchers analyzed the data with 2024 as the base year, along with the key drivers, trends, and challenges. A holistic analysis of drivers will help companies refine their marketing strategies to gain a competitive advantage.
The global automotive parts remanufacturing market is undergoing continuous transformation as industries focus on sustainability, cost efficiency, and performance reliability. The remanufactured automotive parts lifecycle has become central to extending the usability of critical components while maintaining rigorous quality control in automotive parts remanufacturing. Businesses are adopting sustainable practices in automotive parts remanufacturing not only to meet regulatory demands but also to reduce environmental impact, making cost-effective automotive parts remanufacturing an integral strategy for balancing performance and affordability.
Growing awareness of the impact of remanufacturing on automotive waste has highlighted the role of the circular economy in automotive sector development. Market participants emphasize remanufactured parts performance evaluation to assure customers of quality equivalence to new components, supported by advanced technologies in automotive parts remanufacturing that optimize precision and efficiency. Additionally, adherence to regulatory compliance for automotive part remanufacturing aligns with policies promoting extended producer responsibility, reinforcing the environmental benefits of automotive parts remanufacturing and its contribution to long-term resource conservation.
From an economic standpoint, the economic aspects of automotive parts remanufacturing reveal tangible savings compared with new manufacturing. A direct comparison of adoption data shows that while 42% of enterprises currently prefer new components, 58% are increasingly choosing remanufactured alternatives due to proven performance and lower costs. This shift underscores the viability of quality assurance methods for remanufactured parts and advanced testing and validation of remanufactured components across applications.
The industry continues to expand into diverse segments, including remanufacturing for various automotive components, specialized automotive component remanufacturing process, and evolving remanufacturing techniques for engine parts. Strengthening the automotive parts remanufacturing supply chain and adopting best practices in automotive parts remanufacturing are further enabling consistent market growth and long-term scalability.
What are the key market drivers leading to the rise in the adoption of Remanufactured Automotive Parts Industry?
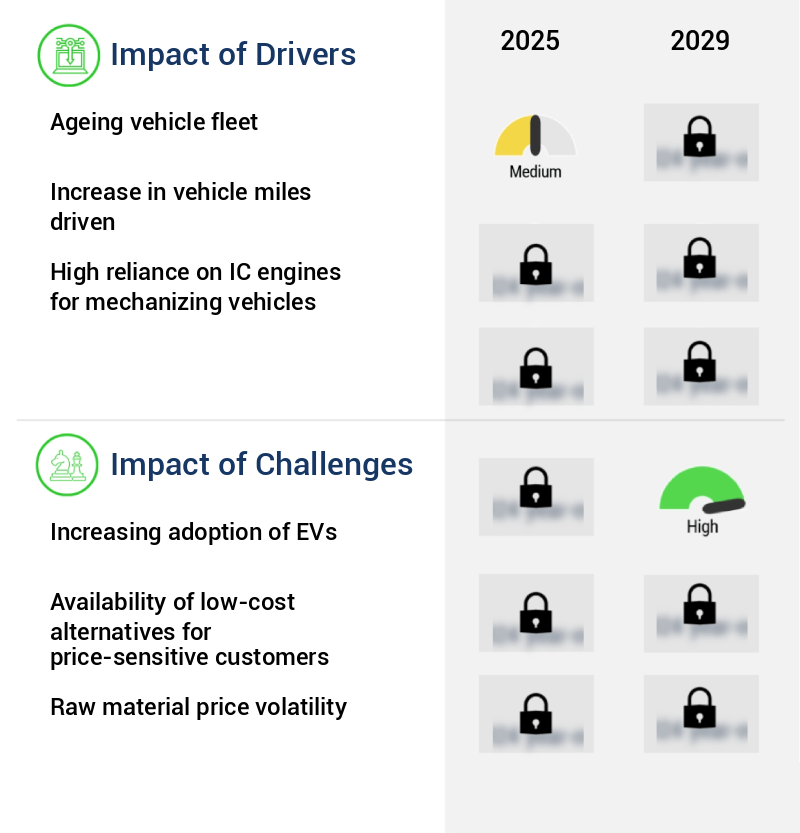
- The aging vehicle fleet serves as the primary catalyst for market growth. The market is experiencing significant growth due to the increasing average age of vehicles, particularly in regions like North America and Europe. According to industry reports, the average life of commercial vehicles in the EU is 12.4 years, and the total number of in-service commercial vehicles is on the rise globally. This trend presents a substantial opportunity for companies specializing in remanufactured automotive parts.
- As vehicles age, their components undergo continuous wear and tear, necessitating replacement to ensure optimal safety and comfort. Although some automotive parts have extended replacement cycles, many components need to be replaced more frequently. The remanufacturing process plays a crucial role in extending the life cycle of these components, thereby reducing the overall cost of vehicle ownership.Remanufacturing involves the process of disassembling, cleaning, testing, and rebuilding used automotive parts to meet or even exceed original equipment manufacturer (OEM) specifications. This process not only reduces the environmental impact of producing new parts but also offers cost savings for consumers and businesses. The market is expected to continue evolving, with advancements in technology and increasing consumer awareness driving growth.
- The market's dynamics are influenced by various factors, including regulatory requirements, technological advancements, and consumer preferences. This growth is attributed to the increasing demand for cost-effective and eco-friendly solutions, coupled with the growing awareness of the benefits of remanufactured parts. Despite the growth potential, the remanufacturing industry faces challenges, such as the availability of high-quality used parts, the need for skilled labor, and the lack of standardization in the industry. Addressing these challenges will be crucial for market participants to maintain their competitive edge and capitalize on the opportunities presented by the evolving market landscape.
What are the market trends shaping the Remanufactured Automotive Parts Industry?
- The 3D printing industry within the automotive aftermarket sector is experiencing significant growth, representing an emerging market trend.The global manufacturing industry is undergoing significant transformations, with the integration of advanced technologies such as automation and material science.
- One such innovation, 3D printing, is poised to revolutionize the manufacturing sector, including the automotive industry, during the forecast period. Currently, the application of 3D printing is primarily limited to low-volume part production. The automotive parts market, specifically the remanufactured sector, is witnessing notable changes as well. Remanufactured parts are those that have undergone a process of rebuilding or refurbishing to restore them to their original specifications and performance levels. These parts offer several advantages, including cost savings, reduced environmental impact, and improved product quality.According to a recent study,
- This growth can be attributed to the increasing demand for cost-effective and sustainable solutions, stringent regulations for vehicle emissions, and the growing popularity of electric and hybrid vehicles. Moreover, advancements in technologies such as 3D printing, augmented reality, and virtual reality are expected to significantly impact the market. These technologies can enhance the production process, improve the quality of parts, and reduce the time and cost associated with remanufacturing.In conclusion, The market is experiencing significant growth, driven by various factors such as cost savings, sustainability, and technological advancements. The market is expected to continue evolving, with the integration of advanced technologies playing a crucial role in shaping its future.
What challenges does the Remanufactured Automotive Parts Industry face during its growth?
- The surge in electric vehicle (EV) adoption poses a significant challenge to the automotive industry's growth trajectory. The market has witnessed significant growth in recent years, driven by the increasing focus on sustainability and cost savings in the automotive industry. Remanufactured parts are recycled components that undergo a rigorous refurbishing process, restoring them to their original specifications and performance levels. This process not only reduces the need for new parts production but also significantly cuts down on waste and emissions.
- According to the Global Automotive Aftermarket Remanufacturing Alliance (GARA),This growth can be attributed to the increasing demand for cost-effective alternatives to new parts, the growing awareness of the environmental benefits of remanufacturing, and the continuous advancements in technology and processes. The market's growth is evident in various sectors, including engines, transmissions, brakes, and electrical components. For instance, the engine remanufacturing market is expected to grow at the highest CAGR during the forecast period due to the increasing demand for fuel-efficient engines and the growing popularity of diesel engines in commercial vehicles. The transmission remanufacturing market is also expected to witness significant growth due to the high replacement rate of transmissions and the increasing demand for cost-effective solutions.
- In conclusion, the market is a dynamic and evolving sector that offers significant opportunities for growth and innovation. Its ability to provide cost-effective, sustainable, and high-performance alternatives to new parts makes it an attractive option for both OEMs and consumers. The market's continued growth is expected to be driven by technological advancements, increasing environmental awareness, and the growing demand for cost savings in the automotive industry.
Exclusive Customer Landscape
The remanufactured automotive parts market forecasting report includes the adoption lifecycle of the market, covering from the innovator's stage to the laggard's stage. It focuses on adoption rates in different regions based on penetration. Furthermore, the remanufactured automotive parts market report also includes key purchase criteria and drivers of price sensitivity to help companies evaluate and develop their market growth analysis strategies.

Customer Landscape of Remanufactured Automotive Parts Industry
Key Companies & Market Insights
Companies are implementing various strategies, such as strategic alliances, remanufactured automotive parts market forecast, partnerships, mergers and acquisitions, geographical expansion, and product/service launches, to enhance their presence in the industry.
Cardone Industries - This company specializes in the production and distribution of high-quality remanufactured automotive components. Their extensive product line includes essential parts such as rocker arms, cylinder heads, connecting rods, oil pumps, water pumps, fuel pumps, air compressors, governors, blowers, and EGR valves. Through advanced engineering processes, they ensure optimal performance and durability, providing cost-effective solutions for automotive repair and maintenance.
The industry research and growth report includes detailed analyses of the competitive landscape of the market and information about key companies, including:
- Cardone Industries
- BBB Industries
- Remy International
- Jasper Engines & Transmissions
- ATC Drivetrain
- LKQ Corporation
- Denso Corporation
- Bosch Automotive Service Solutions
- Valeo SA (France)
- Delphi Technologies
- Aisin Seiki Co., Ltd.
- Mitsuba Corporation
- Meritor, Inc.
- Standard Motor Products, Inc.
- GKN Automotive
- Schaeffler AG
- ZF Friedrichshafen AG
- Maval Industries
- ATP Automotive
- Cloyes Gear & Products, Inc.
Qualitative and quantitative analysis of companies has been conducted to help clients understand the wider business environment as well as the strengths and weaknesses of key industry players. Data is qualitatively analyzed to categorize companies as pure play, category-focused, industry-focused, and diversified; it is quantitatively analyzed to categorize companies as dominant, leading, strong, tentative, and weak.
Recent Development and News in Remanufactured Automotive Parts Market
- In January 2024, Caterpillar Inc. Announced the expansion of its remanufacturing capabilities for heavy-duty diesel engines, targeting the automotive aftermarket (PRNewswire). This strategic move aimed to increase its market share in the remanufactured automotive parts sector.
- In March 2024, NSK Ltd., a leading global automotive component manufacturer, formed a partnership with Schaeffler AG to jointly develop and produce remanufactured automotive bearings (Bloomberg). This collaboration aimed to improve product quality and competitiveness in the market.
- In May 2024, BorgWarner Inc. Completed the acquisition of Remy International Inc., a leading global automotive components supplier specializing in starters, alternators, and electric motor systems (SEC Filing). This acquisition expanded BorgWarner's product portfolio and strengthened its position in the market.
- In April 2025, the European Union passed a new regulation, the Circular Economy Action Plan, which encourages the remanufacturing industry to grow by providing incentives and reducing regulatory barriers (European Commission). This policy change is expected to significantly boost the European the market.
Research Analyst Overview
- The market encompasses a dynamic and evolving landscape, with various processes and applications shaping its growth and development. Engine component remanufacturing, a key sector, involves the disassembly, cleaning, machining, and repair of engine blocks, alternators, turbochargers, catalytic converters, and other components to restore their original performance levels. Performance benchmarking plays a crucial role in ensuring the quality and reliability of remanufactured parts. Component testing methods, such as non-destructive testing and parts inspection techniques, are employed to evaluate the condition and functionality of the components. Customer satisfaction metrics are also closely monitored to maintain high standards and foster repeat business.
- The remanufacturing process extends to various automotive parts, including starter motors, cylinder heads, brake calipers, and fuel injectors. Remanufacturing certifications, such as those from the Automotive Recyclers Association (ARA) and the International Automotive Remanufacturing Council (IARC), help establish industry standards and ensure the credibility of remanufactured parts. Extended producer responsibility (EPR) initiatives and circular economy principles are increasingly influencing the remanufacturing industry. Quality control procedures, supply chain optimization, and inventory management systems are essential components of these initiatives, aiming to minimize waste and promote sustainable practices. The market is expected to grow at a steady pace, with a projected growth rate of approximately 5% per year.
- This growth is driven by the increasing demand for cost-effective and sustainable alternatives to new parts, as well as the continuous advancements in remanufacturing technology and processes. The remanufacturing industry's commitment to waste reduction strategies, logistics and distribution, and warranty claims processing further enhances its appeal to businesses and consumers alike. By embracing the principles of the circular economy, remanufacturers contribute to a more sustainable future for the automotive industry.
Dive into Technavio's robust research methodology, blending expert interviews, extensive data synthesis, and validated models for unparalleled Remanufactured Automotive Parts Market insights. See full methodology.
|
Market Scope |
|
|
Report Coverage |
Details |
|
Page number |
219 |
|
Base year |
2024 |
|
Historic period |
2019-2023 |
|
Forecast period |
2025-2029 |
|
Growth momentum & CAGR |
Accelerate at a CAGR of 3.4% |
|
Market growth 2025-2029 |
USD 10.17 billion |
|
Market structure |
Fragmented |
|
YoY growth 2024-2025(%) |
3.2 |
|
Key countries |
US, China, Germany, Canada, India, South Korea, France, Japan, Italy, Brazil, UAE, UK, Spain, and Mexico |
|
Competitive landscape |
Leading Companies, Market Positioning of Companies, Competitive Strategies, and Industry Risks |
What are the Key Data Covered in this Remanufactured Automotive Parts Market Research and Growth Report?
- CAGR of the Remanufactured Automotive Parts industry during the forecast period
- Detailed information on factors that will drive the growth and forecasting between 2025 and 2029
- Precise estimation of the size of the market and its contribution of the industry in focus to the parent market
- Accurate predictions about upcoming growth and trends and changes in consumer behaviour
- Growth of the market across North America, Europe, APAC, South America, and Middle East and Africa
- Thorough analysis of the market's competitive landscape and detailed information about companies
- Comprehensive analysis of factors that will challenge the remanufactured automotive parts market growth of industry companies
We can help! Our analysts can customize this remanufactured automotive parts market research report to meet your requirements.
 RIA -
RIA - 
