Semiconductor Equipment Market Size 2025-2029
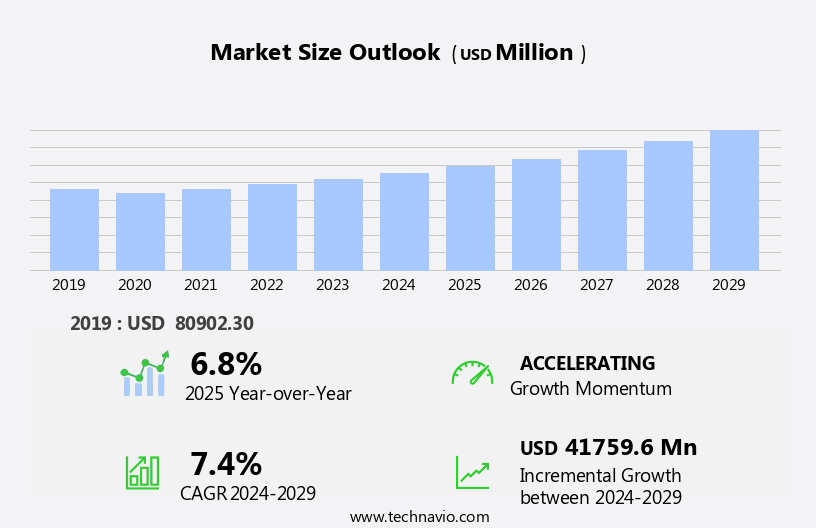
The semiconductor equipment market size is forecast to increase by USD 41.76 billion at a CAGR of 7.4% between 2024 and 2029.
- The market is experiencing significant growth, driven by increasing investments in fabrication facilities and the rising number of chip fabrication plants worldwide. This trend is a result of the continuous advancements in technology and the increasing demand for semiconductor devices in various industries, including consumer electronics, automotive, and industrial automation. However, the semiconductor industry is known for its cyclical nature, which presents both opportunities and challenges. Manufacturers must navigate the industry's cyclical patterns and remain agile to capitalize on market opportunities. Additionally, the intensifying competition and the need for innovation to stay ahead of the curve are critical factors shaping the market's strategic landscape. The market is a dynamic and innovative industry that plays a crucial role in the production of advanced chips powering technology trends such as artificial intelligence, 5G, and the Internet of Things.
- Companies seeking to capitalize on market opportunities and navigate challenges effectively should focus on developing advanced technologies, expanding their production capacity, and exploring new markets to diversify their revenue streams. Collaborations, mergers and acquisitions, and strategic partnerships can also help companies stay competitive and mitigate risks. Overall, the market presents significant growth opportunities for companies that can adapt to the industry's dynamic nature and respond effectively to market trends and challenges.
What will be the Size of the Semiconductor Equipment Market during the forecast period?
- This market encompasses various equipment types, including those used for chip manufacturing, yield enhancement, intellectual property, equipment reliability, and process optimization. Emerging technologies like mixed-signal design, digital twin, and heterogeneous integration are driving the industry forward, while semiconductor standards, process simulation, and data analysis enable process optimization and supply chain management. Semiconductor trade shows, industry consortiums, and semiconductor conferences serve as platforms for showcasing disruptive technologies, such as advanced node manufacturing, 3D integration, and smart manufacturing.
- The industry faces challenges like equipment maintenance, talent acquisition, and government policy, while venture capital and ip licensing fuel innovation. Semiconductor design areas like circuit design, analog design, soc design, and design automation continue to evolve, with a focus on digital design and data acquisition. The future of semiconductor manufacturing relies on process monitoring, semiconductor education, and the adoption of emerging technologies to meet increasing demand.
How is this Semiconductor Equipment Industry segmented?
The semiconductor equipment industry research report provides comprehensive data (region-wise segment analysis), with forecasts and estimates in "USD million" for the period 2025-2029, as well as historical data from 2019-2023 for the following segments.
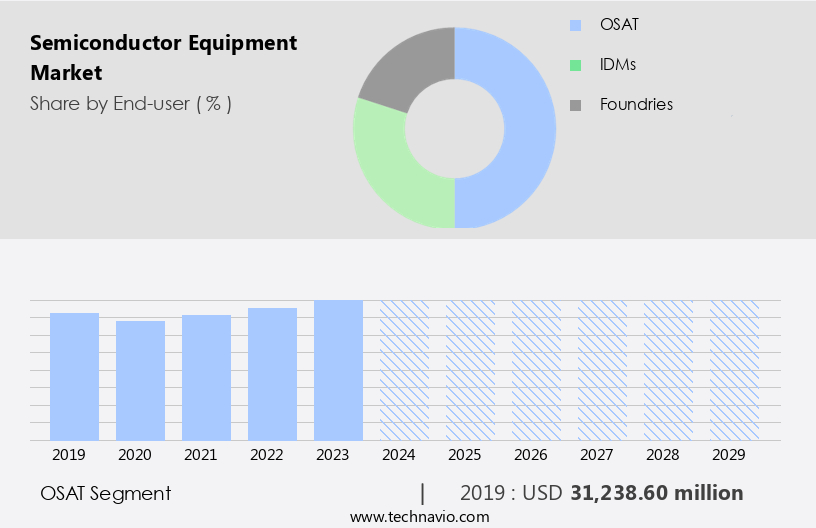
- End-user
- OSAT
- IDMs
- Foundries
- Type
- Front-end equipment
- Back-end equipment
- Application
- Semiconductor fabrication plants
- Semiconductor electronics manufacturing
- Testing and quality control
- Geography
- APAC
- Australia
- China
- India
- Japan
- South Korea
- North America
- US
- Canada
- Europe
- Germany
- UK
- South America
- Brazil
- Middle East and Africa
- APAC
By End-user Insights
The osat segment is estimated to witness significant growth during the forecast period. The market encompasses various technologies and processes essential for the manufacturing of semiconductor devices, including Wire Bonding, Extreme Ultraviolet Lithography (EUVL), Moore's Law, Cloud Computing, and Advanced Packaging. Key technologies include Lithography Equipment (Deep UV and EUV), Etching Equipment (Plasma and Dry), Deposition Equipment (Chemical Vapor Deposition and Atomic Layer Deposition), Inspection Equipment (Optical and Electron Beam), Cleaning Equipment, and Process Control solutions. Market dynamics are driven by the increasing demand for high-performance computing, 5G technology, and the Internet of Things. Semiconductor Materials such as Silicon Wafers, Compound Semiconductors, and Integrated Circuits are integral to this industry.
Get a glance at the market report of share of various segments Request Free Sample
The OSAT segment was valued at USD 31.24 billion in 2019 and showed a gradual increase during the forecast period.
Regional Analysis
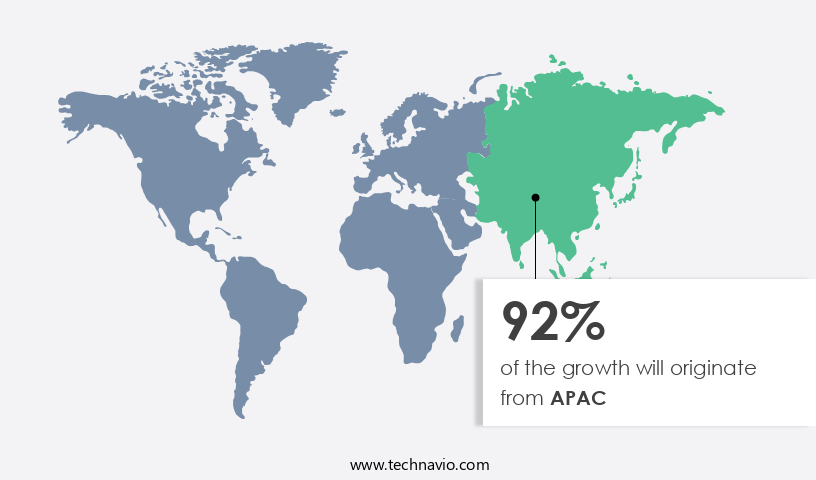
APAC is estimated to contribute 92% to the growth of the global market during the forecast period.Technavio's analysts have elaborately explained the regional trends and drivers that shape the market during the forecast period.
For more insights on the market size of various regions, Request Free Sample
The market is driven by the continuous advancements in semiconductor devices, including Memory Chips, Analog Devices, Compound Semiconductors, Digital Devices, and Mixed-Signal Devices, which necessitate the use of advanced manufacturing technologies. Moore's Law continues to push the boundaries of semiconductor technology, leading to the adoption of advanced packaging techniques like Flip Chip, Wafer Bonding, and Advanced Packaging. Technological innovations in areas such as Extreme Ultraviolet Lithography (EUVL), Deep Ultraviolet Lithography, and Atomic Layer Deposition are transforming the semiconductor manufacturing landscape. These technologies enable the production of smaller, more efficient, and high-performance semiconductor devices, driving the demand for Lithography Equipment, Etching Equipment, Deposition Equipment, and Inspection Equipment.
Market Dynamics
Our researchers analyzed the data with 2024 as the base year, along with the key drivers, trends, and challenges. A holistic analysis of drivers will help companies refine their marketing strategies to gain a competitive advantage.
What are the key market drivers leading to the rise in the adoption of Semiconductor Equipment Industry?
- Growing investments in fabrication facilities is the key driver of the market. The market is witnessing significant investments from memory manufacturers to increase production capacity and expand product offerings. Companies such as Samsung Electronics, Western Digital, Micron Technology, Toshiba, SK Hynix, and Intel are investing in new fabrication facilities to meet the growing demand for semiconductor chips. This trend is creating opportunities for supply chain members, including chip makers, equipment manufacturers, and material suppliers. Micron Technology, for instance, announced plans to invest around USD6-USD8 billion over the next five years to boost memory chip production in Singapore. Such investments are driving advancements in next-generation fabrication facilities, ensuring market competitiveness and innovation.
- Moreover, the emergence of Cloud Computing, 5G Technology, High Performance Computing, Big Data Analytics, Internet of Things, and Artificial Intelligence is fueling the growth of the semiconductor industry, further increasing the demand for semiconductor manufacturing equipment. The market also benefits from the adoption of Cleanroom Technology, ensuring optimal process control during semiconductor manufacturing. Semiconductor Manufacturing Equipment includes various categories such as Wafer Fabrication Equipment, Process Control Equipment, Deposition Equipment, Metrology Equipment, and Packaging Equipment. These tools facilitate the production of Integrated Circuits using Silicon Wafers, ensuring the highest level of quality and efficiency. The market is experiencing significant growth due to the increasing demand for advanced semiconductor devices and the continuous innovation in semiconductor manufacturing technologies. The market dynamics are influenced by factors such as cost of ownership, technology advancements, and the growing adoption of semiconductor devices in various industries.
What are the market trends shaping the Semiconductor Equipment Industry?
- Increase in number of chip fabrication (fabs) worldwide is the upcoming market trend. The semiconductor industry's growth is driven by the rising sales of consumer electronics, including smartphones, hybrid PCs, wearables, and video game consoles. This trend is leading to an expansion of fabrication plants (fabs) in the industry, with approximately 90% of new fabs being 300mm during the forecast period. This significant investment will primarily go towards the production of memory and logic devices, depending on market demand. The proliferation of new fabs will significantly influence the market, with sectors such as wafer-level manufacturing equipment, die-level packaging, assembly manufacturing equipment, and test equipment experiencing substantial growth.
- Advanced packaging techniques like Wafer Bonding, Flip Chip, and Die Attach are crucial for enhancing device performance and miniaturization. Cost of Ownership and process optimization are critical factors influencing the adoption of semiconductor manufacturing equipment. Big Data Analytics and Machine Learning are transforming the industry by enabling predictive maintenance and process optimization. Additionally, Artificial Intelligence and Automation are streamlining manufacturing processes and improving overall efficiency. The semiconductor industry's growth is fueled by government initiatives and investments in research and development in major regions like APAC. China, in particular, is witnessing significant growth due to its strong financial backing and government support for the semiconductor industry. Semiconductor Manufacturing Equipment, including packaging and test equipment, plays a pivotal role in this expansion.
What challenges does the Semiconductor Equipment Industry face during its growth?
- Cyclical nature of semiconductor industry is a key challenge affecting the industry growth. The market experiences cyclical fluctuations, leading to increased operating costs for companies. During downturns, risks such as low demand, overcapacity, and price wars shape the market dynamics. Capital expenditures by semiconductor equipment providers contribute to higher operational expenses, compelling device manufacturers to decrease production. This, in turn, impacts the demand for semiconductor equipment, leading to reduced sales, delayed revenue recognition, and excess inventory. Moreover, cyclical downturns often result in workforce reductions and cost-cutting measures, which may hinder innovation and development within the industry. These factors collectively impede the growth of the market during cyclical periods.
- Extreme ultraviolet lithography (EUVL) and deep ultraviolet lithography are the latest advancements in lithography technology, offering higher resolution and smaller feature sizes. Deposition equipment, including chemical vapor deposition (CVD) and atomic layer deposition (ALD), is used to deposit thin films on the wires during wire bonding and in the fabrication of advanced packaging structures. Wafer bonding is another essential process, which involves joining two wafers together to create a single integrated circuit. Process control is a vital aspect of semiconductor manufacturing, ensuring consistent and reliable production. Metrology equipment is used to measure the dimensions and properties of the semiconductor structures, while test equipment is employed to evaluate the functionality and performance of the devices.
Exclusive Customer Landscape
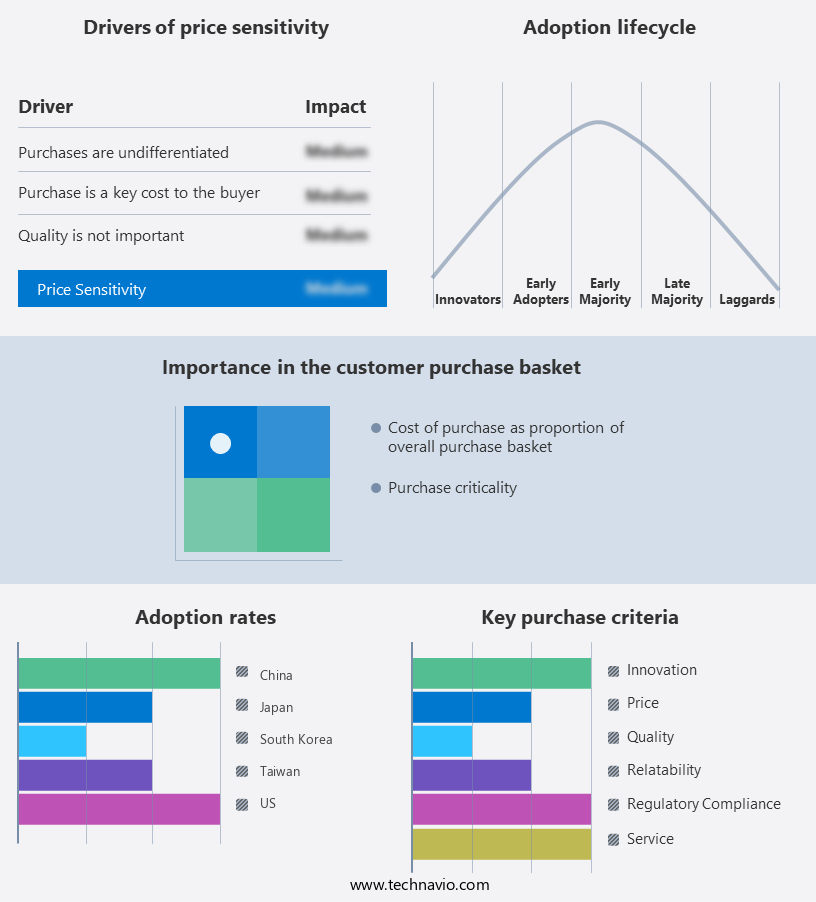
The semiconductor equipment market forecasting report includes the adoption lifecycle of the market, covering from the innovator's stage to the laggard's stage. It focuses on adoption rates in different regions based on penetration. Furthermore, the semiconductor equipment market report also includes key purchase criteria and drivers of price sensitivity to help companies evaluate and develop their market growth analysis strategies.
Customer Landscape
Key Companies & Market Insights
Companies are implementing various strategies, such as strategic alliances, semiconductor equipment market forecast, partnerships, mergers and acquisitions, geographical expansion, and product/service launches, to enhance their presence in the industry.
Advanced Dicing Technologies - The company specializes in providing advanced automated test equipment (ATE) for semiconductor devices, including the V93000 SoC Test System and T2000 Test Platform.
The industry research and growth report includes detailed analyses of the competitive landscape of the market and information about key companies, including:
- Advanced Dicing Technologies
- Advantest Corp.
- Applied Materials Inc.
- ASM International NV
- ASML
- Daifuku Co. Ltd.
- EV Group
- Evatec AG
- Hitachi High Tech Corp.
- KLA Corp.
- Lam Research Corp.
- Modutek Corp.
- Nikon Corp.
- Nordson Corp.
- Nova Ltd.
- Onto Innovation Inc.
- Screen Holdings Co. Ltd
- Teradyne Inc.
- Tokyo Electron Ltd.
- Veeco Instruments Inc.
Qualitative and quantitative analysis of companies has been conducted to help clients understand the wider business environment as well as the strengths and weaknesses of key industry players. Data is qualitatively analyzed to categorize companies as pure play, category-focused, industry-focused, and diversified; it is quantitatively analyzed to categorize companies as dominant, leading, strong, tentative, and weak.
Research Analyst Overview
The market encompasses a diverse range of technologies and processes essential to the production of semiconductor devices. These devices serve as the foundation for various advanced technologies, including cloud computing, high performance computing, artificial intelligence, 5G technology, and the Internet of Things. Semiconductor manufacturing involves several stages, starting with the preparation of silicon wafers. Cleaning equipment plays a crucial role in ensuring the wafers are free from contaminants, enhancing the overall quality of the semiconductor devices. Subsequently, various etching techniques, such as wet etching and plasma etching, are employed to create intricate patterns on the wafers. Lithography equipment is a critical component of semiconductor manufacturing, enabling the transfer of patterns onto the wafers using photolithography. The semiconductor tooling and machinery market, including wafer fabrication equipment, are experiencing increased demand to support the production of various semiconductor components, such as Silicon Carbide, Jet wave machines, optoelectronics, sensors, discretes, 2D, 25D, 3D, and non-volatile memory.
Semiconductor materials, such as silicon, compound semiconductors, and other advanced materials, are used in the fabrication of various semiconductor devices, including digital devices, mixed-signal devices, and analog devices. The cost of ownership for semiconductor manufacturing equipment is a significant factor influencing market dynamics, with continuous efforts being made to improve efficiency and reduce costs. The market is driven by the growing demand for smaller, faster, and more energy-efficient devices. Moore's Law, which describes the exponential increase in transistor density on integrated circuits, continues to shape the industry's technological advancements. Machine learning and artificial intelligence are increasingly being adopted in semiconductor manufacturing to optimize processes, improve yield, and reduce costs. The market is expected to continue growing due to the increasing number of mobile subscriptions, mobile broadband subscriptions, and smartphone-related subscriptions.
Advanced packaging technologies, such as flip chip and wafer-level packaging, are gaining popularity due to their ability to enhance device performance and reduce power consumption. The market is a dynamic and innovative industry, driven by the constant pursuit of smaller, faster, and more energy-efficient semiconductor devices. The market is characterized by continuous technological advancements, with a focus on improving efficiency, reducing costs, and enhancing performance.
|
Market Scope |
|
|
Report Coverage |
Details |
|
Page number |
218 |
|
Base year |
2024 |
|
Historic period |
2019-2023 |
|
Forecast period |
2025-2029 |
|
Growth momentum & CAGR |
Accelerate at a CAGR of 7.4% |
|
Market growth 2025-2029 |
USD 41759.6 million |
|
Market structure |
Fragmented |
|
YoY growth 2024-2025(%) |
6.8 |
|
Key countries |
China, India, Japan, South Korea, Australia, US, Canada, UK, Brazil, and Germany |
|
Competitive landscape |
Leading Companies, Market Positioning of Companies, Competitive Strategies, and Industry Risks |
What are the Key Data Covered in this Semiconductor Equipment Market Research and Growth Report?
- CAGR of the Semiconductor Equipment industry during the forecast period
- Detailed information on factors that will drive the growth and forecasting between 2025 and 2029
- Precise estimation of the size of the market and its contribution of the industry in focus to the parent market
- Accurate predictions about upcoming growth and trends and changes in consumer behaviour
- Growth of the market across APAC, North America, Europe, South America, and Middle East and Africa
- Thorough analysis of the market's competitive landscape and detailed information about companies
- Comprehensive analysis of factors that will challenge the semiconductor equipment market growth of industry companies
We can help! Our analysts can customize this semiconductor equipment market research report to meet your requirements.
 RIA -
RIA - 
